×
  • Cat-intel
  • MedIntelliX
  • Resources
  • About Us
  • Request Free Sample ×

    Kindly complete the form below to receive a free sample of this Report

    Leading companies partner with us for data-driven Insights

    clients tt-cursor
    Hero Background

    Europe Visual Analytics Market

    ID: MRFR/ICT/60110-HCR
    200 Pages
    Aarti Dhapte
    October 2025

    Europe Visual Analytics Market Research Report By Component (Software, Services), By Deployment (On-Demand, On-Premise), By Industry (IT, Retail, BFSI, Manufacturing, Military & Defense, Transportation & Logistics, Others) and By Regional (Germany, UK, France, Russia, Italy, Spain, Rest of Europe)-Forecast to 2035

    Share:
    Download PDF ×

    We do not share your information with anyone. However, we may send you emails based on your report interest from time to time. You may contact us at any time to opt-out.

    Europe Visual Analytics Market Infographic
    Purchase Options

    Europe Visual Analytics Market Summary

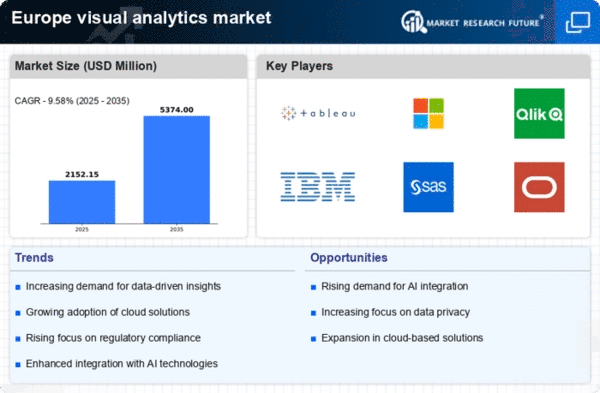
    As per MRFR analysis, the visual analytics market Size was estimated at 1964.0 USD Million in 2024. The visual analytics market is projected to grow from 2152.15 USD Million in 2025 to 5374.0 USD Million by 2035, exhibiting a compound annual growth rate (CAGR) of 9.58% during the forecast period 2025 - 2035.

    Key Market Trends & Highlights

    The Europe visual analytics market is experiencing robust growth driven by technological advancements and increasing demand for data insights.

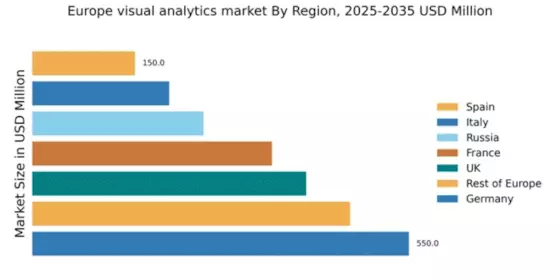
    • Germany remains the largest market for visual analytics, reflecting a strong emphasis on data-driven decision making.
    • The UK is identified as the fastest-growing region, showcasing a rising interest in real-time analytics and user-friendly interfaces.
    • There is a notable trend towards the integration of AI and machine learning technologies, enhancing analytical capabilities across sectors.
    • Key market drivers include the rising demand for data-driven decision making and the expansion of cloud-based solutions, which are shaping the market landscape.

    Market Size & Forecast

    2024 Market Size 1964.0 (USD Million)
    2035 Market Size 5374.0 (USD Million)

    Major Players

    Tableau Software (US), Microsoft (US), Qlik (US), IBM (US), SAS (US), Oracle (US), Sisense (US), Domo (US), TIBCO Software (US)

    Europe Visual Analytics Market Trends

    The visual analytics market is currently experiencing a notable transformation, driven by advancements in technology and an increasing demand for data-driven decision-making. Organizations across various sectors are recognizing the value of visual analytics in interpreting complex data sets, which enhances their ability to derive actionable insights. This trend is particularly evident in industries such as finance, healthcare, and retail, where the need for real-time data visualization is paramount. As businesses strive to remain competitive, the integration of visual analytics tools into their operations appears to be a strategic priority. Furthermore, the growing emphasis on data literacy among employees suggests that organizations are investing in training programs to empower their workforce in utilizing these tools effectively. In addition, the rise of cloud-based solutions is reshaping the landscape of the visual analytics market. These solutions offer scalability, flexibility, and cost-effectiveness, making them attractive to businesses of all sizes. The ability to access data from anywhere and collaborate in real-time is likely to enhance productivity and foster innovation. As organizations continue to embrace digital transformation, the demand for sophisticated visual analytics tools is expected to grow, indicating a robust future for this market. Overall, the visual analytics market is poised for significant growth, driven by technological advancements and a shift towards data-centric strategies.

    Increased Adoption of AI and Machine Learning

    The integration of artificial intelligence (AI) and machine learning technologies into visual analytics tools is becoming more prevalent. This trend enables organizations to automate data analysis processes, uncover patterns, and generate insights more efficiently. As businesses seek to leverage these advanced technologies, the visual analytics market is likely to witness a surge in demand for AI-driven solutions.

    Focus on Data Governance and Security

    With the rise in data breaches and privacy concerns, organizations are placing greater emphasis on data governance and security within the visual analytics market. Companies are increasingly adopting solutions that ensure compliance with regulations and protect sensitive information. This focus on security is expected to shape the development of visual analytics tools, making them more robust and reliable.

    Growing Importance of Real-Time Analytics

    The demand for real-time analytics is on the rise as organizations strive to make timely decisions based on current data. This trend is particularly relevant in sectors such as finance and healthcare, where immediate insights can significantly impact outcomes. As a result, the visual analytics market is likely to evolve, offering more tools that facilitate real-time data visualization and analysis.

    Europe Visual Analytics Market Drivers

    Expansion of Cloud-Based Solutions

    The shift towards cloud-based solutions is significantly impacting the visual analytics market in Europe. Organizations are increasingly adopting cloud technologies to enhance their data storage and processing capabilities, which in turn facilitates more efficient data analysis and visualization. The visual analytics market is witnessing a rapid expansion of cloud-based offerings, as these solutions provide scalability, flexibility, and cost-effectiveness. With the cloud market projected to grow by 25% in the coming years, the visual analytics sector is likely to benefit from this trend, as businesses seek to leverage cloud technologies to improve their analytical capabilities and drive better business outcomes.

    Emphasis on User-Friendly Interfaces

    User experience is becoming a critical factor in the visual analytics market in Europe, as organizations seek tools that are not only powerful but also user-friendly. The visual analytics market is responding to this demand by developing intuitive interfaces that allow users, regardless of their technical expertise, to easily navigate and interpret data. This focus on usability is likely to drive adoption rates, particularly among non-technical users who require insights for decision making. As a result, the market is witnessing a shift towards solutions that prioritize design and accessibility, which could potentially lead to a 20% increase in user engagement with visual analytics tools over the next few years.

    Integration of Advanced Technologies

    The integration of advanced technologies such as artificial intelligence (AI) and machine learning (ML) is transforming the visual analytics market in Europe. These technologies enable more sophisticated data analysis and visualization capabilities, allowing organizations to uncover insights that were previously difficult to obtain. The visual analytics market is adapting to these advancements, with many vendors incorporating AI-driven features into their offerings. This integration not only enhances the user experience but also improves the accuracy of data interpretations. As organizations increasingly adopt these technologies, the market is expected to expand, with a projected value reaching €5 billion by 2027, reflecting a growing recognition of the importance of advanced analytics in business operations.

    Rising Demand for Data-Driven Decision Making

    The visual analytics market in Europe is experiencing a notable surge in demand as organizations increasingly prioritize data-driven decision making. This trend is largely fueled by the need for businesses to enhance operational efficiency and gain competitive advantages. According to recent estimates, the market is projected to grow at a CAGR of approximately 15% over the next five years. Companies are recognizing that leveraging visual analytics tools can significantly improve their ability to interpret complex data sets, leading to more informed strategic choices. As a result, the visual analytics market is witnessing a proliferation of solutions designed to cater to diverse business needs, from small enterprises to large corporations, thereby driving overall market growth.

    Growing Need for Data Compliance and Regulation

    As data privacy regulations become more stringent across Europe, the visual analytics market is adapting to meet compliance requirements. Organizations are increasingly aware of the need to ensure that their data practices align with regulations such as the General Data Protection Regulation (GDPR). This growing emphasis on compliance is driving demand for visual analytics solutions that incorporate robust data governance features. The visual analytics market is likely to see a rise in offerings that not only provide analytical capabilities but also ensure that data handling practices are transparent and secure. This trend may lead to a market growth of approximately 10% as businesses invest in compliant analytics solutions.

    Market Segment Insights

    By Components: Software (Largest) vs. Services (Fastest-Growing)

    In the Europe visual analytics market, the allocation of market share between software and services is critical for understanding competitive dynamics. Software holds the largest share, driven by its essential role in data analysis, visualization, and decision-making processes. This robust segment caters to various industries, providing comprehensive capabilities that align with business intelligence needs. On the other hand, the services segment is witnessing rapid growth, fueled by an increasing demand for custom analytics solutions and consulting services. With businesses seeking to enhance their analytical capabilities, service providers are stepping up with innovative offerings. This trend is anticipated to continue, as organizations look to implement tailored visual analytics solutions to meet specific requirements, resulting in a growing reliance on expert services.

    Software: Dominant vs. Services: Emerging

    The software segment is the dominant force in the Europe visual analytics market, characterized by established players and a well-defined product spectrum ranging from basic visualization tools to advanced predictive analytics platforms. These software solutions are critical for facilitating data-driven decision-making across industries. Conversely, the services segment is emerging, showcasing rapid development as organizations increasingly seek specialized consulting and support services to derive insights from their data. This segment includes training, implementation, and managed services, reflecting a trend where companies prioritize expert guidance to navigate the complexities of visual analytics. As a result, both segments are crucial for the holistic growth of the market, with software leading the charge while services rapidly adapt to evolving business needs.

    By Deployment: On-Demand (Largest) vs. On-Premise (Fastest-Growing)

    The deployment segment of the visual analytics market in Europe is witnessing significant growth driven by varying preferences of businesses. On-Demand solutions dominate the market, favored for their flexibility and scalability, making them appealing for various organizations that require quick insights without the need for extensive upfront investment. In contrast, On-Premise solutions are gaining traction among large enterprises that prioritize data security and control, contributing to their growing market share. Growth trends in this segment can be attributed to increasing demand for real-time data analysis and the rise of cloud-based services. On-Demand deployments are benefitting from the shift toward remote work and digital transformation, while On-Premise options are resonating with organizations focusing on compliance and regulatory requirements. As businesses adapt to changing market conditions, both deployment types are expected to flourish, albeit at different rates depending on user needs.

    On-Demand (Dominant) vs. On-Premise (Emerging)

    On-Demand deployment in the visual analytics realm is characterized by its accessibility and user-friendly interface, allowing businesses to generate insights quickly. This deployment type caters to organizations of all sizes, particularly small to medium enterprises, who value lower initial costs and the ability to scale services as needed. The model typically involves subscription pricing, making it financially attractive. On the other hand, On-Premise solutions are emerging as a key choice for larger organizations, providing them with greater control over their data and compliance with strict regulations. These systems require higher upfront investments but offer tailored solutions that meet the specific needs of enterprises, particularly in industries such as finance and healthcare where data sensitivity is paramount.

    By Industry: IT (Largest) vs. Retail (Fastest-Growing)

    In the visual analytics market, the IT industry holds the largest market share among various segments, driven by the increasing demand for data-driven decision-making and insights. Furthermore, sectors like Retail are rapidly catching up, attributed to a substantial shift toward online shopping, which necessitates sophisticated data analysis to enhance customer experiences and optimize inventory management. The growth of the visual analytics market in these segments is fueled by technological advancements and a deeper integration of analytics into business operations. In particular, the BFSI and Manufacturing sectors are also showing promising trends. The focus on real-time analytics and data visualization tools is anticipated to reshape operations, leading to faster, more informed decisions across these industries.

    IT (Dominant) vs. Retail (Emerging)

    The IT sector is currently dominating the visual analytics market, serving as a critical component for organizations that rely on vast amounts of data for operational efficiency and competitive advantage. Its focus on security, real-time analytics, and cloud computing solutions positions it as an essential player. On the other hand, Retail is emerging as a vibrant segment, driven by a heightened need for customer insight and personalized marketing strategies. Retailers are increasingly adopting visual analytics to optimize user experiences and manage supply chains effectively, thus responding swiftly to market trends. This shift indicates an evolving landscape where traditional sectors are being challenged by dynamic industries seeking innovation through data.

    Get more detailed insights about Europe Visual Analytics Market

    Regional Insights

    Germany : Strong Demand and Innovation Drive Growth

    Key markets include major cities like Berlin, Munich, and Frankfurt, which are home to numerous tech startups and established enterprises. The competitive landscape features significant players such as Tableau, Microsoft, and Qlik, all vying for market share. The business environment is characterized by a strong focus on R&D and collaboration between academia and industry. Sectors like finance, healthcare, and manufacturing are increasingly adopting visual analytics solutions to enhance operational efficiency and customer insights.

    UK : Innovation and Investment Drive Demand

    Key markets include London, Manchester, and Edinburgh, where a vibrant tech ecosystem thrives. Major players like IBM and SAS have a strong presence, fostering competition and innovation. The local market dynamics are influenced by a collaborative environment among startups and established firms. Industries such as e-commerce and telecommunications are leveraging visual analytics to enhance customer engagement and operational efficiency.

    France : Strong Growth in Diverse Sectors

    Key markets include Paris, Lyon, and Marseille, where numerous tech companies and startups are emerging. The competitive landscape features major players like Oracle and Qlik, which are actively expanding their offerings. The business environment is characterized by a focus on innovation and collaboration, with local firms increasingly adopting analytics to improve operational efficiency and customer insights. The French government is also promoting data-driven initiatives to enhance competitiveness.

    Russia : Market Expansion Amid Challenges

    Key markets include Moscow and St. Petersburg, where a burgeoning tech scene is fostering innovation. Major players like Microsoft and IBM are establishing a presence, contributing to a competitive landscape. The local market dynamics are influenced by a mix of state-owned enterprises and private firms, with a focus on enhancing operational efficiency through analytics. Industries such as energy and finance are increasingly adopting visual analytics to drive growth and improve decision-making processes.

    Italy : Focus on Innovation and Adoption

    Key markets include Milan, Rome, and Turin, where a mix of traditional industries and tech startups are driving demand. The competitive landscape features players like Tableau and SAS, which are expanding their offerings to cater to local needs. The business environment is characterized by a growing emphasis on data-driven strategies, with industries such as fashion and automotive leveraging analytics to enhance operational efficiency and customer engagement.

    Spain : Growth Driven by Digital Transformation

    Key markets include Madrid and Barcelona, where a vibrant tech ecosystem is emerging. Major players like Qlik and Oracle are establishing a presence, contributing to a competitive landscape. The local market dynamics are influenced by a mix of startups and established firms, with industries such as tourism and retail increasingly adopting visual analytics to enhance customer experiences and operational efficiency. The focus on data-driven decision-making is reshaping the business environment.

    Rest of Europe : Growth Across Multiple Markets

    Key markets include cities across Scandinavia, the Benelux region, and Eastern Europe, where a mix of established firms and startups are driving demand. The competitive landscape features major players like IBM and Microsoft, which are expanding their offerings to cater to local needs. Local market dynamics are characterized by a focus on innovation and collaboration, with industries such as healthcare and finance leveraging visual analytics to improve decision-making and operational efficiency.

    Key Players and Competitive Insights

    The visual analytics market in Europe is characterized by a dynamic competitive landscape, driven by the increasing demand for data-driven decision-making across various sectors. Key players such as Tableau Software (US), Microsoft (US), and Qlik (US) are at the forefront, leveraging their technological prowess to enhance their offerings. Tableau Software (US) focuses on innovation through continuous product enhancements, while Microsoft (US) emphasizes integration with its broader ecosystem, including Azure and Power BI. Qlik (US) appears to be concentrating on expanding its cloud capabilities, which aligns with the growing trend towards cloud-based solutions. Collectively, these strategies foster a competitive environment that encourages rapid advancements and diverse offerings in visual analytics.

    In terms of business tactics, companies are increasingly localizing their operations to better serve regional markets, optimizing supply chains to enhance efficiency. The competitive structure of the market is moderately fragmented, with several players vying for market share. This fragmentation allows for a variety of solutions, catering to different customer needs, while the influence of major players remains substantial, shaping market trends and customer expectations.

    In October 2025, Tableau Software (US) announced a strategic partnership with a leading European telecommunications provider to enhance data visualization capabilities for their customer service operations. This collaboration is expected to streamline data access and improve customer insights, thereby reinforcing Tableau's position in the market. The strategic importance of this partnership lies in its potential to drive customer engagement and satisfaction through enhanced data-driven insights.

    In September 2025, Microsoft (US) unveiled a new feature in Power BI that integrates advanced AI capabilities, allowing users to generate insights from unstructured data. This move is significant as it positions Microsoft as a leader in AI-driven analytics, catering to the increasing demand for sophisticated data analysis tools. By enhancing its product offerings, Microsoft is likely to attract a broader customer base, further solidifying its competitive edge.

    In August 2025, Qlik (US) launched a new cloud-based analytics platform aimed at small to medium-sized enterprises (SMEs). This initiative is crucial as it opens up new market segments, allowing Qlik to diversify its customer base and increase market penetration. The focus on SMEs indicates a strategic shift towards inclusivity in analytics, which could reshape competitive dynamics in the sector.

    As of November 2025, current trends in the visual analytics market include a strong emphasis on digitalization, sustainability, and the integration of AI technologies. Strategic alliances are increasingly shaping the competitive landscape, enabling companies to pool resources and expertise. Looking ahead, competitive differentiation is likely to evolve, with a shift from price-based competition to a focus on innovation, technological advancements, and supply chain reliability. This transition suggests that companies will need to invest in cutting-edge technologies and sustainable practices to maintain their competitive positions.

    Key Companies in the Europe Visual Analytics Market market include

    Industry Developments

    The Europe Visual Analytics Market has seen notable developments recently, particularly with major players engaging in strategic mergers and acquisitions. In September 2023, Oracle announced its acquisition of a small visual analytics firm based in Germany to enhance its cloud offerings. Moreover, Microsoft has made significant strides in expanding its Power BI capabilities within the region. In June 2023, SAP launched a new visual analytics tool aimed at improving data storytelling and business intelligence for European enterprises.

    The market is experiencing robust growth, with companies like Qlik and Tableau Software reporting increased demand for their solutions, driven by the growing emphasis on data-driven decision-making among European businesses. TIBCO Software has also expanded its presence in Europe by strengthening partnerships with local distributors.

    In the past two to three years, the market has witnessed substantial investments in Research and Development, particularly from IBM and Alteryx, to innovate and enhance visual analytics capabilities. Overall, these developments signal a dynamic and evolving landscape in the Europe Visual Analytics Market, shaping the future of data visualization and business intelligence solutions.

    Future Outlook

    Europe Visual Analytics Market Future Outlook

    The visual analytics market is projected to grow at a 9.58% CAGR from 2024 to 2035, driven by increasing data complexity, demand for real-time insights, and advancements in AI technologies.

    New opportunities lie in:

    • Development of AI-driven predictive analytics tools for enhanced decision-making.
    • Integration of visual analytics in IoT applications for real-time data visualization.
    • Expansion of cloud-based visual analytics platforms to improve accessibility and collaboration.

    By 2035, the visual analytics market is expected to achieve substantial growth, driven by technological advancements and increasing demand.

    Market Segmentation

    Europe Visual Analytics Market Industry Outlook

    • IT
    • Retail
    • BFSI
    • Manufacturing
    • Military & Defense
    • Transportation & Logistics
    • Others

    Europe Visual Analytics Market Components Outlook

    • Software
    • Services

    Europe Visual Analytics Market Deployment Outlook

    • On-Demand
    • On-Premise

    Report Scope

    MARKET SIZE 20241964.0(USD Million)
    MARKET SIZE 20252152.15(USD Million)
    MARKET SIZE 20355374.0(USD Million)
    COMPOUND ANNUAL GROWTH RATE (CAGR)9.58% (2024 - 2035)
    REPORT COVERAGERevenue Forecast, Competitive Landscape, Growth Factors, and Trends
    BASE YEAR2024
    Market Forecast Period2025 - 2035
    Historical Data2019 - 2024
    Market Forecast UnitsUSD Million
    Key Companies Profiled["Tableau Software (US)", "Microsoft (US)", "Qlik (US)", "IBM (US)", "SAS (US)", "Oracle (US)", "Sisense (US)", "Domo (US)", "TIBCO Software (US)"]
    Segments CoveredComponents, Deployment, Industry
    Key Market OpportunitiesIntegration of artificial intelligence enhances decision-making capabilities in the visual analytics market.
    Key Market DynamicsRising demand for data-driven decision-making fuels growth in the visual analytics market across Europe.
    Countries CoveredGermany, UK, France, Russia, Italy, Spain, Rest of Europe

    Leave a Comment

    FAQs

    What is the expected market size of the Europe Visual Analytics Market in 2024?

    The Europe Visual Analytics Market is expected to be valued at 1.96 billion USD in 2024.

    What will be the projected market value of the Europe Visual Analytics Market in 2035?

    By 2035, the Europe Visual Analytics Market is anticipated to reach approximately 10.73 billion USD.

    What is the expected compound annual growth rate (CAGR) for the Europe Visual Analytics Market from 2025 to 2035?

    The expected CAGR for the Europe Visual Analytics Market from 2025 to 2035 is 16.696%.

    Which are the major players in the Europe Visual Analytics Market?

    Key players in the market include Oracle, Microsoft, SAP, SAS, Qlik, and Tableau Software among others.

    How much will the software segment of the Europe Visual Analytics Market be worth in 2035?

    The software segment of the Europe Visual Analytics Market is projected to be valued at 6.41 billion USD in 2035.

    What is the market size for the services component of the Europe Visual Analytics Market in 2024?

    In 2024, the services segment of the Europe Visual Analytics Market is expected to be valued at 0.79 billion USD.

    Which region is expected to dominate the Europe Visual Analytics Market in terms of size?

    Germany is expected to dominate the market, with a value of 0.6 billion USD in 2024 and rising to 3.34 billion USD in 2035.

    What will be the market size for the UK in the Europe Visual Analytics Market by 2035?

    The UK market size in the Europe Visual Analytics Market is projected to reach 2.85 billion USD by 2035.

    How much is the France segment expected to grow by 2035?

    The France segment is expected to grow from 0.4 billion USD in 2024 to 2.3 billion USD by 2035.

    What challenges are currently impacting the Europe Visual Analytics Market?

    Current challenges facing the Europe Visual Analytics Market include data privacy concerns and integration complexities.

    Download Free Sample

    Kindly complete the form below to receive a free sample of this Report

    Case Study
    Chemicals and Materials

    Compare Licence

    ×
    Features License Type
    Single User Multiuser License Enterprise User
    Price $4,950 $5,950 $7,250
    Maximum User Access Limit 1 User Upto 10 Users Unrestricted Access Throughout the Organization
    Free Customization
    Direct Access to Analyst
    Deliverable Format
    Platform Access
    Discount on Next Purchase 10% 15% 15%
    Printable Versions