Request Free Sample ×

Kindly complete the form below to receive a free sample of this Report

* Please use a valid business email

Leading companies partner with us for data-driven Insights

clients tt-cursor
Hero Background

Europe Used Cooking Oil Market

ID: MRFR/FnB/45041-HCR
128 Pages
Pradeep Nandi
Last Updated: April 06, 2026

Europe Used Cooking Oil Market Size, Share, Industry Trend & Analysis Research Report By Source (Food Manufacturers, HoReCa, Household, Others) and By Application (Biodiesel, Oleochemical Products, Animal Feed, Others)-Forecast to 2035

Share:
Download PDF ×

We do not share your information with anyone. However, we may send you emails based on your report interest from time to time. You may contact us at any time to opt-out.

Europe Used Cooking Oil Market Infographic
Purchase Options
  1. 1 SECTION I: EXECUTIVE SUMMARY AND KEY HIGHLIGHTS
    1. 1.1 EXECUTIVE SUMMARY
      1. 1.1.1 Market Overview
      2. 1.1.2 Key Findings
      3. 1.1.3 Market Segmentation
      4. 1.1.4 Competitive Landscape
      5. 1.1.5 Challenges and Opportunities
      6. 1.1.6 Future Outlook
  2. 2 SECTION II: SCOPING, METHODOLOGY AND MARKET STRUCTURE
    1. 2.1 MARKET INTRODUCTION
      1. 2.1.1 Definition
      2. 2.1.2 Scope of the study
        1. 2.1.2.1 Research Objective
        2. 2.1.2.2 Assumption
        3. 2.1.2.3 Limitations
    2. 2.2 RESEARCH METHODOLOGY
      1. 2.2.1 Overview
      2. 2.2.2 Data Mining
      3. 2.2.3 Secondary Research
      4. 2.2.4 Primary Research
        1. 2.2.4.1 Primary Interviews and Information Gathering Process
        2. 2.2.4.2 Breakdown of Primary Respondents
      5. 2.2.5 Forecasting Model
      6. 2.2.6 Market Size Estimation
        1. 2.2.6.1 Bottom-Up Approach
        2. 2.2.6.2 Top-Down Approach
      7. 2.2.7 Data Triangulation
      8. 2.2.8 Validation
  3. 3 SECTION III: QUALITATIVE ANALYSIS
    1. 3.1 MARKET DYNAMICS
      1. 3.1.1 Overview
      2. 3.1.2 Drivers
      3. 3.1.3 Restraints
      4. 3.1.4 Opportunities
    2. 3.2 MARKET FACTOR ANALYSIS
      1. 3.2.1 Value chain Analysis
      2. 3.2.2 Porter's Five Forces Analysis
        1. 3.2.2.1 Bargaining Power of Suppliers
        2. 3.2.2.2 Bargaining Power of Buyers
        3. 3.2.2.3 Threat of New Entrants
        4. 3.2.2.4 Threat of Substitutes
        5. 3.2.2.5 Intensity of Rivalry
      3. 3.2.3 COVID-19 Impact Analysis
        1. 3.2.3.1 Market Impact Analysis
        2. 3.2.3.2 Regional Impact
        3. 3.2.3.3 Opportunity and Threat Analysis
  4. 4 SECTION IV: QUANTITATIVE ANALYSIS
    1. 4.1 Food, Beverages & Nutrition, BY Application (USD Billion)
      1. 4.1.1 Biodiesel Production
      2. 4.1.2 Animal Feed
      3. 4.1.3 Industrial Lubricants
      4. 4.1.4 Cosmetics
      5. 4.1.5 Biofuels
    2. 4.2 Food, Beverages & Nutrition, BY End Use (USD Billion)
      1. 4.2.1 Food Industry
      2. 4.2.2 Energy Sector
      3. 4.2.3 Agriculture
      4. 4.2.4 Chemical Industry
      5. 4.2.5 Pharmaceuticals
    3. 4.3 Food, Beverages & Nutrition, BY Source (USD Billion)
      1. 4.3.1 Fried Food
      2. 4.3.2 Baking Oil
      3. 4.3.3 Fast Food
      4. 4.3.4 Household Cooking
      5. 4.3.5 Commercial Cooking
    4. 4.4 Food, Beverages & Nutrition, BY Processing Method (USD Billion)
      1. 4.4.1 Transesterification
      2. 4.4.2 Filtration
      3. 4.4.3 Dehydration
      4. 4.4.4 Refining
      5. 4.4.5 Blending
    5. 4.5 Food, Beverages & Nutrition, BY Quality Grade (USD Billion)
      1. 4.5.1 Food Grade
      2. 4.5.2 Technical Grade
      3. 4.5.3 Industrial Grade
      4. 4.5.4 Refined Grade
      5. 4.5.5 Unrefined Grade
  5. 5 SECTION V: COMPETITIVE ANALYSIS
    1. 5.1 Competitive Landscape
      1. 5.1.1 Overview
      2. 5.1.2 Competitive Analysis
      3. 5.1.3 Market share Analysis
      4. 5.1.4 Major Growth Strategy in the Food, Beverages & Nutrition
      5. 5.1.5 Competitive Benchmarking
      6. 5.1.6 Leading Players in Terms of Number of Developments in the Food, Beverages & Nutrition
      7. 5.1.7 Key developments and growth strategies
        1. 5.1.7.1 New Product Launch/Service Deployment
        2. 5.1.7.2 Merger & Acquisitions
        3. 5.1.7.3 Joint Ventures
      8. 5.1.8 Major Players Financial Matrix
        1. 5.1.8.1 Sales and Operating Income
        2. 5.1.8.2 Major Players R&D Expenditure. 2023
    2. 5.2 Company Profiles
      1. 5.2.1 Biodiesel Technologies (DE)
        1. 5.2.1.1 Financial Overview
        2. 5.2.1.2 Products Offered
        3. 5.2.1.3 Key Developments
        4. 5.2.1.4 SWOT Analysis
        5. 5.2.1.5 Key Strategies
      2. 5.2.2 Neste (FI)
        1. 5.2.2.1 Financial Overview
        2. 5.2.2.2 Products Offered
        3. 5.2.2.3 Key Developments
        4. 5.2.2.4 SWOT Analysis
        5. 5.2.2.5 Key Strategies
      3. 5.2.3 Renewable Energy Group (US)
        1. 5.2.3.1 Financial Overview
        2. 5.2.3.2 Products Offered
        3. 5.2.3.3 Key Developments
        4. 5.2.3.4 SWOT Analysis
        5. 5.2.3.5 Key Strategies
      4. 5.2.4 Cargill (US)
        1. 5.2.4.1 Financial Overview
        2. 5.2.4.2 Products Offered
        3. 5.2.4.3 Key Developments
        4. 5.2.4.4 SWOT Analysis
        5. 5.2.4.5 Key Strategies
      5. 5.2.5 ADM (US)
        1. 5.2.5.1 Financial Overview
        2. 5.2.5.2 Products Offered
        3. 5.2.5.3 Key Developments
        4. 5.2.5.4 SWOT Analysis
        5. 5.2.5.5 Key Strategies
      6. 5.2.6 Ecovia (IT)
        1. 5.2.6.1 Financial Overview
        2. 5.2.6.2 Products Offered
        3. 5.2.6.3 Key Developments
        4. 5.2.6.4 SWOT Analysis
        5. 5.2.6.5 Key Strategies
      7. 5.2.7 Saria (DE)
        1. 5.2.7.1 Financial Overview
        2. 5.2.7.2 Products Offered
        3. 5.2.7.3 Key Developments
        4. 5.2.7.4 SWOT Analysis
        5. 5.2.7.5 Key Strategies
      8. 5.2.8 Veolia (FR)
        1. 5.2.8.1 Financial Overview
        2. 5.2.8.2 Products Offered
        3. 5.2.8.3 Key Developments
        4. 5.2.8.4 SWOT Analysis
        5. 5.2.8.5 Key Strategies
      9. 5.2.9 Bunge (US)
        1. 5.2.9.1 Financial Overview
        2. 5.2.9.2 Products Offered
        3. 5.2.9.3 Key Developments
        4. 5.2.9.4 SWOT Analysis
        5. 5.2.9.5 Key Strategies
    3. 5.3 Appendix
      1. 5.3.1 References
      2. 5.3.2 Related Reports
  6. 6 LIST OF FIGURES
    1. 6.1 MARKET SYNOPSIS
    2. 6.2 EUROPE MARKET ANALYSIS BY APPLICATION
    3. 6.3 EUROPE MARKET ANALYSIS BY END USE
    4. 6.4 EUROPE MARKET ANALYSIS BY SOURCE
    5. 6.5 EUROPE MARKET ANALYSIS BY PROCESSING METHOD
    6. 6.6 EUROPE MARKET ANALYSIS BY QUALITY GRADE
    7. 6.7 KEY BUYING CRITERIA OF FOOD, BEVERAGES & NUTRITION
    8. 6.8 RESEARCH PROCESS OF MRFR
    9. 6.9 DRO ANALYSIS OF FOOD, BEVERAGES & NUTRITION
    10. 6.10 DRIVERS IMPACT ANALYSIS: FOOD, BEVERAGES & NUTRITION
    11. 6.11 RESTRAINTS IMPACT ANALYSIS: FOOD, BEVERAGES & NUTRITION
    12. 6.12 SUPPLY / VALUE CHAIN: FOOD, BEVERAGES & NUTRITION
    13. 6.13 FOOD, BEVERAGES & NUTRITION, BY APPLICATION, 2024 (% SHARE)
    14. 6.14 FOOD, BEVERAGES & NUTRITION, BY APPLICATION, 2024 TO 2035 (USD Billion)
    15. 6.15 FOOD, BEVERAGES & NUTRITION, BY END USE, 2024 (% SHARE)
    16. 6.16 FOOD, BEVERAGES & NUTRITION, BY END USE, 2024 TO 2035 (USD Billion)
    17. 6.17 FOOD, BEVERAGES & NUTRITION, BY SOURCE, 2024 (% SHARE)
    18. 6.18 FOOD, BEVERAGES & NUTRITION, BY SOURCE, 2024 TO 2035 (USD Billion)
    19. 6.19 FOOD, BEVERAGES & NUTRITION, BY PROCESSING METHOD, 2024 (% SHARE)
    20. 6.20 FOOD, BEVERAGES & NUTRITION, BY PROCESSING METHOD, 2024 TO 2035 (USD Billion)
    21. 6.21 FOOD, BEVERAGES & NUTRITION, BY QUALITY GRADE, 2024 (% SHARE)
    22. 6.22 FOOD, BEVERAGES & NUTRITION, BY QUALITY GRADE, 2024 TO 2035 (USD Billion)
    23. 6.23 BENCHMARKING OF MAJOR COMPETITORS
  7. 7 LIST OF TABLES
    1. 7.1 LIST OF ASSUMPTIONS
  8. 7.1.1
    1. 7.2 Europe MARKET SIZE ESTIMATES; FORECAST
      1. 7.2.1 BY APPLICATION, 2026-2035 (USD Billion)
      2. 7.2.2 BY END USE, 2026-2035 (USD Billion)
      3. 7.2.3 BY SOURCE, 2026-2035 (USD Billion)
      4. 7.2.4 BY PROCESSING METHOD, 2026-2035 (USD Billion)
      5. 7.2.5 BY QUALITY GRADE, 2026-2035 (USD Billion)
    2. 7.3 PRODUCT LAUNCH/PRODUCT DEVELOPMENT/APPROVAL
  9. 7.3.1
    1. 7.4 ACQUISITION/PARTNERSHIP
  10. 7.4.1

Europe Food, Beverages & Nutrition Market Segmentation

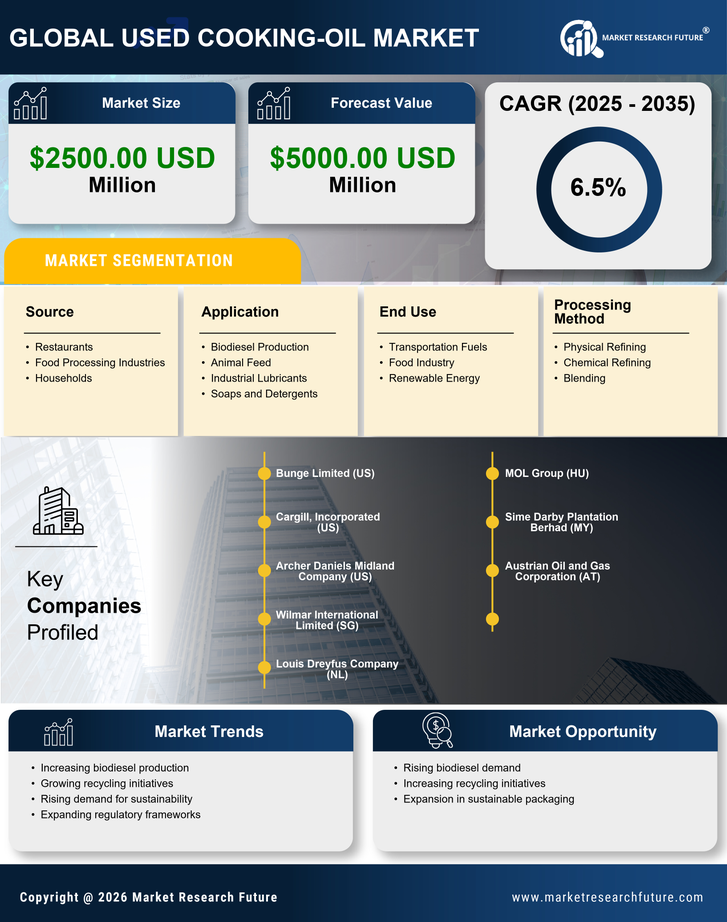
Food, Beverages & Nutrition By Application (USD Billion, 2022-2035)

  • Biodiesel Production
  • Animal Feed
  • Industrial Lubricants
  • Cosmetics
  • Biofuels

Food, Beverages & Nutrition By End Use (USD Billion, 2022-2035)

  • Food Industry
  • Energy Sector
  • Agriculture
  • Chemical Industry
  • Pharmaceuticals

Food, Beverages & Nutrition By Source (USD Billion, 2022-2035)

  • Fried Food
  • Baking Oil
  • Fast Food
  • Household Cooking
  • Commercial Cooking

Food, Beverages & Nutrition By Processing Method (USD Billion, 2022-2035)

  • Transesterification
  • Filtration
  • Dehydration
  • Refining
  • Blending

Food, Beverages & Nutrition By Quality Grade (USD Billion, 2022-2035)

  • Food Grade
  • Technical Grade
  • Industrial Grade
  • Refined Grade
  • Unrefined Grade

Compare Licence

×
Features License Type
Single User Multiuser License Enterprise User
Price $4,950 $5,950 $7,250
Maximum User Access Limit 1 User Upto 10 Users Unrestricted Access Throughout the Organization
Free Customization
Direct Access to Analyst
Deliverable Format
Platform Access
Discount on Next Purchase 10% 15% 15%
Printable Versions