Request Free Sample ×

Kindly complete the form below to receive a free sample of this Report

* Please use a valid business email

Leading companies partner with us for data-driven Insights

clients tt-cursor
Hero Background

Europe Intelligent Traffic Management System Market

ID: MRFR/AT/54921-HCR
200 Pages
Triveni Bhoyar
Last Updated: February 06, 2026

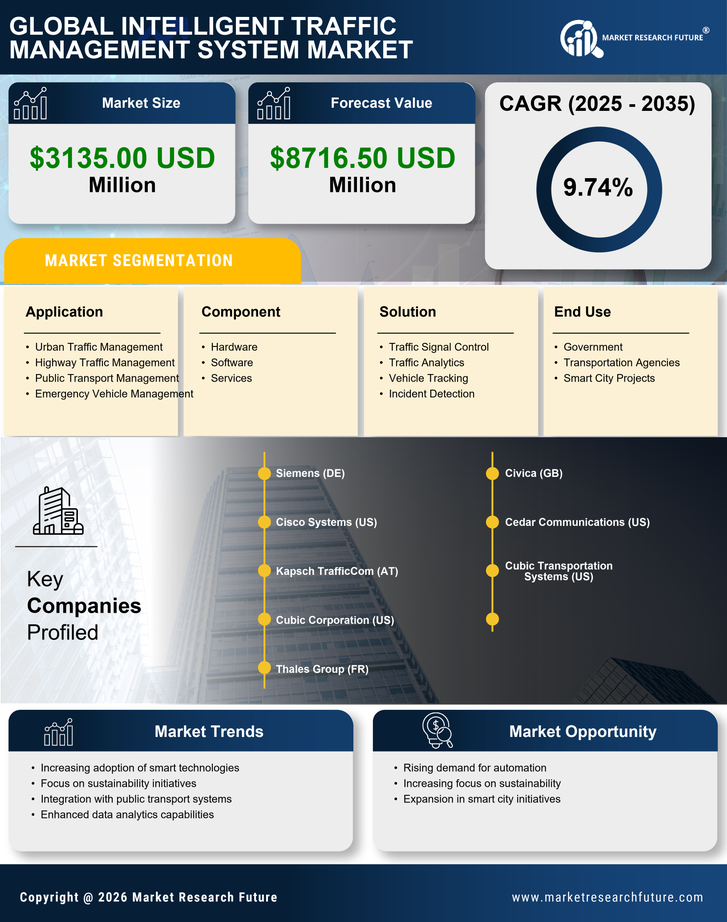
Europe Intelligent Traffic Management System Market Research Report By Component (Hardware, Software, Services), By Solution (Traffic Signal Control, Traffic Analytics, Vehicle Tracking, Incident Detection), By Application (Urban Traffic Management, Highway Traffic Management, Public Transport Management, Emergency Vehicle Management), By End Use (Government, Transportation Agencies, Smart City Projects) and By Regional (Germany, UK, France, Russia, Italy, Spain, Rest of Europe) - Forecast to 2035

Share:
Download PDF ×

We do not share your information with anyone. However, we may send you emails based on your report interest from time to time. You may contact us at any time to opt-out.

Europe Intelligent Traffic Management System Market Infographic
Purchase Options
  1. 1 SECTION I: EXECUTIVE SUMMARY AND KEY HIGHLIGHTS
  2.   1.1 EXECUTIVE SUMMARY
  3.     1.1.1 Market Overview
  4.     1.1.2 Key Findings
  5.     1.1.3 Market Segmentation
  6.     1.1.4 Competitive Landscape
  7.     1.1.5 Challenges and Opportunities
  8.     1.1.6 Future Outlook
  9. 2 SECTION II: SCOPING, METHODOLOGY AND MARKET STRUCTURE
  10.   2.1 MARKET INTRODUCTION
  11.     2.1.1 Definition
  12.     2.1.2 Scope of the study
  13.       2.1.2.1 Research Objective
  14.       2.1.2.2 Assumption
  15.       2.1.2.3 Limitations
  16.   2.2 RESEARCH METHODOLOGY
  17.     2.2.1 Overview
  18.     2.2.2 Data Mining
  19.     2.2.3 Secondary Research
  20.     2.2.4 Primary Research
  21.       2.2.4.1 Primary Interviews and Information Gathering Process
  22.       2.2.4.2 Breakdown of Primary Respondents
  23.     2.2.5 Forecasting Model
  24.     2.2.6 Market Size Estimation
  25.       2.2.6.1 Bottom-Up Approach
  26.       2.2.6.2 Top-Down Approach
  27.     2.2.7 Data Triangulation
  28.     2.2.8 Validation
  29. 3 SECTION III: QUALITATIVE ANALYSIS
  30.   3.1 MARKET DYNAMICS
  31.     3.1.1 Overview
  32.     3.1.2 Drivers
  33.     3.1.3 Restraints
  34.     3.1.4 Opportunities
  35.   3.2 MARKET FACTOR ANALYSIS
  36.     3.2.1 Value chain Analysis
  37.     3.2.2 Porter's Five Forces Analysis
  38.       3.2.2.1 Bargaining Power of Suppliers
  39.       3.2.2.2 Bargaining Power of Buyers
  40.       3.2.2.3 Threat of New Entrants
  41.       3.2.2.4 Threat of Substitutes
  42.       3.2.2.5 Intensity of Rivalry
  43.     3.2.3 COVID-19 Impact Analysis
  44.       3.2.3.1 Market Impact Analysis
  45.       3.2.3.2 Regional Impact
  46.       3.2.3.3 Opportunity and Threat Analysis
  47. 4 SECTION IV: QUANTITATIVE ANALYSIS
  48.   4.1 Automobile, BY Application (USD Billion)
  49.     4.1.1 Traffic Management
  50.     4.1.2 Traffic Monitoring
  51.     4.1.3 Traffic Control
  52.     4.1.4 Incident Management
  53.     4.1.5 Parking Management
  54.   4.2 Automobile, BY End Use (USD Billion)
  55.     4.2.1 Government
  56.     4.2.2 Transportation
  57.     4.2.3 Logistics
  58.     4.2.4 Public Safety
  59.     4.2.5 Smart Cities
  60.   4.3 Automobile, BY Technology (USD Billion)
  61.     4.3.1 Artificial Intelligence
  62.     4.3.2 Internet of Things
  63.     4.3.3 Cloud Computing
  64.     4.3.4 Big Data Analytics
  65.     4.3.5 Machine Learning
  66.   4.4 Automobile, BY Component (USD Billion)
  67.     4.4.1 Hardware
  68.     4.4.2 Software
  69.     4.4.3 Services
  70.     4.4.4 Communication Systems
  71.     4.4.5 Data Analytics Tools
  72. 5 SECTION V: COMPETITIVE ANALYSIS
  73.   5.1 Competitive Landscape
  74.     5.1.1 Overview
  75.     5.1.2 Competitive Analysis
  76.     5.1.3 Market share Analysis
  77.     5.1.4 Major Growth Strategy in the Automobile
  78.     5.1.5 Competitive Benchmarking
  79.     5.1.6 Leading Players in Terms of Number of Developments in the Automobile
  80.     5.1.7 Key developments and growth strategies
  81.       5.1.7.1 New Product Launch/Service Deployment
  82.       5.1.7.2 Merger & Acquisitions
  83.       5.1.7.3 Joint Ventures
  84.     5.1.8 Major Players Financial Matrix
  85.       5.1.8.1 Sales and Operating Income
  86.       5.1.8.2 Major Players R&D Expenditure. 2023
  87.   5.2 Company Profiles
  88.     5.2.1 Siemens (DE)
  89.       5.2.1.1 Financial Overview
  90.       5.2.1.2 Products Offered
  91.       5.2.1.3 Key Developments
  92.       5.2.1.4 SWOT Analysis
  93.       5.2.1.5 Key Strategies
  94.     5.2.2 Kapsch TrafficCom (AT)
  95.       5.2.2.1 Financial Overview
  96.       5.2.2.2 Products Offered
  97.       5.2.2.3 Key Developments
  98.       5.2.2.4 SWOT Analysis
  99.       5.2.2.5 Key Strategies
  100.     5.2.3 Thales Group (FR)
  101.       5.2.3.1 Financial Overview
  102.       5.2.3.2 Products Offered
  103.       5.2.3.3 Key Developments
  104.       5.2.3.4 SWOT Analysis
  105.       5.2.3.5 Key Strategies
  106.     5.2.4 Cubic Corporation (US)
  107.       5.2.4.1 Financial Overview
  108.       5.2.4.2 Products Offered
  109.       5.2.4.3 Key Developments
  110.       5.2.4.4 SWOT Analysis
  111.       5.2.4.5 Key Strategies
  112.     5.2.5 Civitas (IT)
  113.       5.2.5.1 Financial Overview
  114.       5.2.5.2 Products Offered
  115.       5.2.5.3 Key Developments
  116.       5.2.5.4 SWOT Analysis
  117.       5.2.5.5 Key Strategies
  118.     5.2.6 Cetra (FR)
  119.       5.2.6.1 Financial Overview
  120.       5.2.6.2 Products Offered
  121.       5.2.6.3 Key Developments
  122.       5.2.6.4 SWOT Analysis
  123.       5.2.6.5 Key Strategies
  124.     5.2.7 Cubic Transportation Systems (GB)
  125.       5.2.7.1 Financial Overview
  126.       5.2.7.2 Products Offered
  127.       5.2.7.3 Key Developments
  128.       5.2.7.4 SWOT Analysis
  129.       5.2.7.5 Key Strategies
  130.     5.2.8 Civitas Solutions (ES)
  131.       5.2.8.1 Financial Overview
  132.       5.2.8.2 Products Offered
  133.       5.2.8.3 Key Developments
  134.       5.2.8.4 SWOT Analysis
  135.       5.2.8.5 Key Strategies
  136.     5.2.9 Indra Sistemas (ES)
  137.       5.2.9.1 Financial Overview
  138.       5.2.9.2 Products Offered
  139.       5.2.9.3 Key Developments
  140.       5.2.9.4 SWOT Analysis
  141.       5.2.9.5 Key Strategies
  142.   5.3 Appendix
  143.     5.3.1 References
  144.     5.3.2 Related Reports
  145. 6 LIST OF FIGURES
  146.   6.1 MARKET SYNOPSIS
  147.   6.2 EUROPE MARKET ANALYSIS BY APPLICATION
  148.   6.3 EUROPE MARKET ANALYSIS BY END USE
  149.   6.4 EUROPE MARKET ANALYSIS BY TECHNOLOGY
  150.   6.5 EUROPE MARKET ANALYSIS BY COMPONENT
  151.   6.6 KEY BUYING CRITERIA OF AUTOMOBILE
  152.   6.7 RESEARCH PROCESS OF MRFR
  153.   6.8 DRO ANALYSIS OF AUTOMOBILE
  154.   6.9 DRIVERS IMPACT ANALYSIS: AUTOMOBILE
  155.   6.10 RESTRAINTS IMPACT ANALYSIS: AUTOMOBILE
  156.   6.11 SUPPLY / VALUE CHAIN: AUTOMOBILE
  157.   6.12 AUTOMOBILE, BY APPLICATION, 2024 (% SHARE)
  158.   6.13 AUTOMOBILE, BY APPLICATION, 2024 TO 2035 (USD Billion)
  159.   6.14 AUTOMOBILE, BY END USE, 2024 (% SHARE)
  160.   6.15 AUTOMOBILE, BY END USE, 2024 TO 2035 (USD Billion)
  161.   6.16 AUTOMOBILE, BY TECHNOLOGY, 2024 (% SHARE)
  162.   6.17 AUTOMOBILE, BY TECHNOLOGY, 2024 TO 2035 (USD Billion)
  163.   6.18 AUTOMOBILE, BY COMPONENT, 2024 (% SHARE)
  164.   6.19 AUTOMOBILE, BY COMPONENT, 2024 TO 2035 (USD Billion)
  165.   6.20 BENCHMARKING OF MAJOR COMPETITORS
  166. 7 LIST OF TABLES
  167.   7.1 LIST OF ASSUMPTIONS
  168.     7.1.1
  169.   7.2 Europe MARKET SIZE ESTIMATES; FORECAST
  170.     7.2.1 BY APPLICATION, 2026-2035 (USD Billion)
  171.     7.2.2 BY END USE, 2026-2035 (USD Billion)
  172.     7.2.3 BY TECHNOLOGY, 2026-2035 (USD Billion)
  173.     7.2.4 BY COMPONENT, 2026-2035 (USD Billion)
  174.   7.3 PRODUCT LAUNCH/PRODUCT DEVELOPMENT/APPROVAL
  175.     7.3.1
  176.   7.4 ACQUISITION/PARTNERSHIP
  177.     7.4.1

Europe Automobile Market Segmentation

Automobile By Application (USD Billion, 2022-2035)

  • Traffic Management
  • Traffic Monitoring
  • Traffic Control
  • Incident Management
  • Parking Management

Automobile By End Use (USD Billion, 2022-2035)

  • Government
  • Transportation
  • Logistics
  • Public Safety
  • Smart Cities

Automobile By Technology (USD Billion, 2022-2035)

  • Artificial Intelligence
  • Internet of Things
  • Cloud Computing
  • Big Data Analytics
  • Machine Learning

Automobile By Component (USD Billion, 2022-2035)

  • Hardware
  • Software
  • Services
  • Communication Systems
  • Data Analytics Tools

Compare Licence

×
Features License Type
Single User Multiuser License Enterprise User
Price $4,950 $5,950 $7,250
Maximum User Access Limit 1 User Upto 10 Users Unrestricted Access Throughout the Organization
Free Customization
Direct Access to Analyst
Deliverable Format
Platform Access
Discount on Next Purchase 10% 15% 15%
Printable Versions