Request Free Sample ×

Kindly complete the form below to receive a free sample of this Report

* Please use a valid business email

Leading companies partner with us for data-driven Insights

clients tt-cursor
Hero Background

Europe Industrial Networking Solutions Market

ID: MRFR/ICT/63428-HCR
200 Pages
Nirmit Biswas
Last Updated: February 06, 2026

Europe Industrial Networking Solutions Market Size, Share and Research Report: By Component (Technologies, Services), By Application (Remote monitoring, Asset tracking and management, Supply chain management, Real time streaming and video, Emergency and incident management, Predictive maintenance), By Deployment (Cloud, On premises), By Networking type (Wireless networking, Wireline networking) and By Regional (Germany, UK, France, Russia, Italy, Spain, Rest of Europe)- Industry Forecast to 2035

Share:
Download PDF ×

We do not share your information with anyone. However, we may send you emails based on your report interest from time to time. You may contact us at any time to opt-out.

Europe Industrial Networking Solutions Market Infographic
Purchase Options
  1. 1 SECTION I: EXECUTIVE SUMMARY AND KEY HIGHLIGHTS
  2.   1.1 EXECUTIVE SUMMARY
  3.     1.1.1 Market Overview
  4.     1.1.2 Key Findings
  5.     1.1.3 Market Segmentation
  6.     1.1.4 Competitive Landscape
  7.     1.1.5 Challenges and Opportunities
  8.     1.1.6 Future Outlook
  9. 2 SECTION II: SCOPING, METHODOLOGY AND MARKET STRUCTURE
  10.   2.1 MARKET INTRODUCTION
  11.     2.1.1 Definition
  12.     2.1.2 Scope of the study
  13.       2.1.2.1 Research Objective
  14.       2.1.2.2 Assumption
  15.       2.1.2.3 Limitations
  16.   2.2 RESEARCH METHODOLOGY
  17.     2.2.1 Overview
  18.     2.2.2 Data Mining
  19.     2.2.3 Secondary Research
  20.     2.2.4 Primary Research
  21.       2.2.4.1 Primary Interviews and Information Gathering Process
  22.       2.2.4.2 Breakdown of Primary Respondents
  23.     2.2.5 Forecasting Model
  24.     2.2.6 Market Size Estimation
  25.       2.2.6.1 Bottom-Up Approach
  26.       2.2.6.2 Top-Down Approach
  27.     2.2.7 Data Triangulation
  28.     2.2.8 Validation
  29. 3 SECTION III: QUALITATIVE ANALYSIS
  30.   3.1 MARKET DYNAMICS
  31.     3.1.1 Overview
  32.     3.1.2 Drivers
  33.     3.1.3 Restraints
  34.     3.1.4 Opportunities
  35.   3.2 MARKET FACTOR ANALYSIS
  36.     3.2.1 Value chain Analysis
  37.     3.2.2 Porter's Five Forces Analysis
  38.       3.2.2.1 Bargaining Power of Suppliers
  39.       3.2.2.2 Bargaining Power of Buyers
  40.       3.2.2.3 Threat of New Entrants
  41.       3.2.2.4 Threat of Substitutes
  42.       3.2.2.5 Intensity of Rivalry
  43.     3.2.3 COVID-19 Impact Analysis
  44.       3.2.3.1 Market Impact Analysis
  45.       3.2.3.2 Regional Impact
  46.       3.2.3.3 Opportunity and Threat Analysis
  47. 4 SECTION IV: QUANTITATIVE ANALYSIS
  48.   4.1 Information and Communications Technology, BY Application (USD Billion)
  49.     4.1.1 Manufacturing Automation
  50.     4.1.2 Process Automation
  51.     4.1.3 Building Automation
  52.     4.1.4 Transportation Systems
  53.   4.2 Information and Communications Technology, BY End Use (USD Billion)
  54.     4.2.1 Automotive
  55.     4.2.2 Aerospace
  56.     4.2.3 Energy and Utilities
  57.     4.2.4 Food and Beverage
  58.   4.3 Information and Communications Technology, BY Technology (USD Billion)
  59.     4.3.1 Ethernet
  60.     4.3.2 Wireless Networking
  61.     4.3.3 Fieldbus
  62.     4.3.4 Industrial Internet of Things
  63.   4.4 Information and Communications Technology, BY Network Type (USD Billion)
  64.     4.4.1 Local Area Network
  65.     4.4.2 Wide Area Network
  66.     4.4.3 Virtual Private Network
  67.   4.5 Information and Communications Technology, BY Deployment Mode (USD Billion)
  68.     4.5.1 On-Premises
  69.     4.5.2 Cloud-Based
  70.     4.5.3 Hybrid
  71. 5 SECTION V: COMPETITIVE ANALYSIS
  72.   5.1 Competitive Landscape
  73.     5.1.1 Overview
  74.     5.1.2 Competitive Analysis
  75.     5.1.3 Market share Analysis
  76.     5.1.4 Major Growth Strategy in the Information and Communications Technology
  77.     5.1.5 Competitive Benchmarking
  78.     5.1.6 Leading Players in Terms of Number of Developments in the Information and Communications Technology
  79.     5.1.7 Key developments and growth strategies
  80.       5.1.7.1 New Product Launch/Service Deployment
  81.       5.1.7.2 Merger & Acquisitions
  82.       5.1.7.3 Joint Ventures
  83.     5.1.8 Major Players Financial Matrix
  84.       5.1.8.1 Sales and Operating Income
  85.       5.1.8.2 Major Players R&D Expenditure. 2023
  86.   5.2 Company Profiles
  87.     5.2.1 Siemens (DE)
  88.       5.2.1.1 Financial Overview
  89.       5.2.1.2 Products Offered
  90.       5.2.1.3 Key Developments
  91.       5.2.1.4 SWOT Analysis
  92.       5.2.1.5 Key Strategies
  93.     5.2.2 Schneider Electric (FR)
  94.       5.2.2.1 Financial Overview
  95.       5.2.2.2 Products Offered
  96.       5.2.2.3 Key Developments
  97.       5.2.2.4 SWOT Analysis
  98.       5.2.2.5 Key Strategies
  99.     5.2.3 Rockwell Automation (US)
  100.       5.2.3.1 Financial Overview
  101.       5.2.3.2 Products Offered
  102.       5.2.3.3 Key Developments
  103.       5.2.3.4 SWOT Analysis
  104.       5.2.3.5 Key Strategies
  105.     5.2.4 Moxa (TW)
  106.       5.2.4.1 Financial Overview
  107.       5.2.4.2 Products Offered
  108.       5.2.4.3 Key Developments
  109.       5.2.4.4 SWOT Analysis
  110.       5.2.4.5 Key Strategies
  111.     5.2.5 Hirschmann (DE)
  112.       5.2.5.1 Financial Overview
  113.       5.2.5.2 Products Offered
  114.       5.2.5.3 Key Developments
  115.       5.2.5.4 SWOT Analysis
  116.       5.2.5.5 Key Strategies
  117.     5.2.6 Belden (US)
  118.       5.2.6.1 Financial Overview
  119.       5.2.6.2 Products Offered
  120.       5.2.6.3 Key Developments
  121.       5.2.6.4 SWOT Analysis
  122.       5.2.6.5 Key Strategies
  123.     5.2.7 Phoenix Contact (DE)
  124.       5.2.7.1 Financial Overview
  125.       5.2.7.2 Products Offered
  126.       5.2.7.3 Key Developments
  127.       5.2.7.4 SWOT Analysis
  128.       5.2.7.5 Key Strategies
  129.     5.2.8 Cisco (US)
  130.       5.2.8.1 Financial Overview
  131.       5.2.8.2 Products Offered
  132.       5.2.8.3 Key Developments
  133.       5.2.8.4 SWOT Analysis
  134.       5.2.8.5 Key Strategies
  135.     5.2.9 Advantech (TW)
  136.       5.2.9.1 Financial Overview
  137.       5.2.9.2 Products Offered
  138.       5.2.9.3 Key Developments
  139.       5.2.9.4 SWOT Analysis
  140.       5.2.9.5 Key Strategies
  141.   5.3 Appendix
  142.     5.3.1 References
  143.     5.3.2 Related Reports
  144. 6 LIST OF FIGURES
  145.   6.1 MARKET SYNOPSIS
  146.   6.2 EUROPE MARKET ANALYSIS BY APPLICATION
  147.   6.3 EUROPE MARKET ANALYSIS BY END USE
  148.   6.4 EUROPE MARKET ANALYSIS BY TECHNOLOGY
  149.   6.5 EUROPE MARKET ANALYSIS BY NETWORK TYPE
  150.   6.6 EUROPE MARKET ANALYSIS BY DEPLOYMENT MODE
  151.   6.7 KEY BUYING CRITERIA OF INFORMATION AND COMMUNICATIONS TECHNOLOGY
  152.   6.8 RESEARCH PROCESS OF MRFR
  153.   6.9 DRO ANALYSIS OF INFORMATION AND COMMUNICATIONS TECHNOLOGY
  154.   6.10 DRIVERS IMPACT ANALYSIS: INFORMATION AND COMMUNICATIONS TECHNOLOGY
  155.   6.11 RESTRAINTS IMPACT ANALYSIS: INFORMATION AND COMMUNICATIONS TECHNOLOGY
  156.   6.12 SUPPLY / VALUE CHAIN: INFORMATION AND COMMUNICATIONS TECHNOLOGY
  157.   6.13 INFORMATION AND COMMUNICATIONS TECHNOLOGY, BY APPLICATION, 2024 (% SHARE)
  158.   6.14 INFORMATION AND COMMUNICATIONS TECHNOLOGY, BY APPLICATION, 2024 TO 2035 (USD Billion)
  159.   6.15 INFORMATION AND COMMUNICATIONS TECHNOLOGY, BY END USE, 2024 (% SHARE)
  160.   6.16 INFORMATION AND COMMUNICATIONS TECHNOLOGY, BY END USE, 2024 TO 2035 (USD Billion)
  161.   6.17 INFORMATION AND COMMUNICATIONS TECHNOLOGY, BY TECHNOLOGY, 2024 (% SHARE)
  162.   6.18 INFORMATION AND COMMUNICATIONS TECHNOLOGY, BY TECHNOLOGY, 2024 TO 2035 (USD Billion)
  163.   6.19 INFORMATION AND COMMUNICATIONS TECHNOLOGY, BY NETWORK TYPE, 2024 (% SHARE)
  164.   6.20 INFORMATION AND COMMUNICATIONS TECHNOLOGY, BY NETWORK TYPE, 2024 TO 2035 (USD Billion)
  165.   6.21 INFORMATION AND COMMUNICATIONS TECHNOLOGY, BY DEPLOYMENT MODE, 2024 (% SHARE)
  166.   6.22 INFORMATION AND COMMUNICATIONS TECHNOLOGY, BY DEPLOYMENT MODE, 2024 TO 2035 (USD Billion)
  167.   6.23 BENCHMARKING OF MAJOR COMPETITORS
  168. 7 LIST OF TABLES
  169.   7.1 LIST OF ASSUMPTIONS
  170.     7.1.1
  171.   7.2 Europe MARKET SIZE ESTIMATES; FORECAST
  172.     7.2.1 BY APPLICATION, 2026-2035 (USD Billion)
  173.     7.2.2 BY END USE, 2026-2035 (USD Billion)
  174.     7.2.3 BY TECHNOLOGY, 2026-2035 (USD Billion)
  175.     7.2.4 BY NETWORK TYPE, 2026-2035 (USD Billion)
  176.     7.2.5 BY DEPLOYMENT MODE, 2026-2035 (USD Billion)
  177.   7.3 PRODUCT LAUNCH/PRODUCT DEVELOPMENT/APPROVAL
  178.     7.3.1
  179.   7.4 ACQUISITION/PARTNERSHIP
  180.     7.4.1

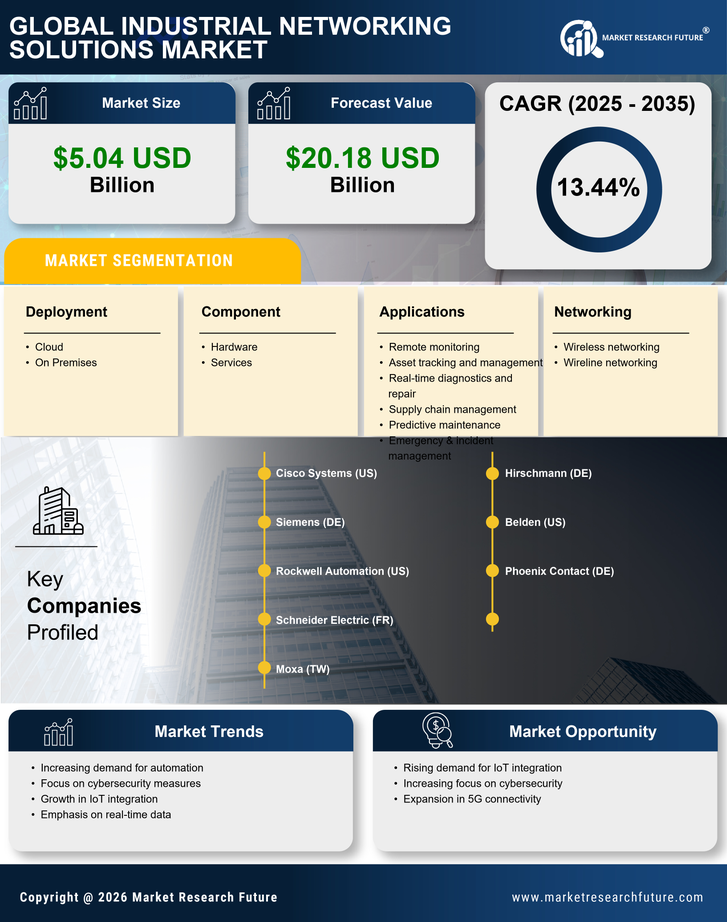
Europe Information and Communications Technology Market Segmentation

Information and Communications Technology By Application (USD Billion, 2022-2035)

  • Manufacturing Automation
  • Process Automation
  • Building Automation
  • Transportation Systems

Information and Communications Technology By End Use (USD Billion, 2022-2035)

  • Automotive
  • Aerospace
  • Energy and Utilities
  • Food and Beverage

Information and Communications Technology By Technology (USD Billion, 2022-2035)

  • Ethernet
  • Wireless Networking
  • Fieldbus
  • Industrial Internet of Things

Information and Communications Technology By Network Type (USD Billion, 2022-2035)

  • Local Area Network
  • Wide Area Network
  • Virtual Private Network

Information and Communications Technology By Deployment Mode (USD Billion, 2022-2035)

  • On-Premises
  • Cloud-Based
  • Hybrid

Compare Licence

×
Features License Type
Single User Multiuser License Enterprise User
Price $4,950 $5,950 $7,250
Maximum User Access Limit 1 User Upto 10 Users Unrestricted Access Throughout the Organization
Free Customization
Direct Access to Analyst
Deliverable Format
Platform Access
Discount on Next Purchase 10% 15% 15%
Printable Versions