Segmentation Quick Reference
| Dimension | Sub-Segments | Dominant Segment | Fastest Growing Segment |
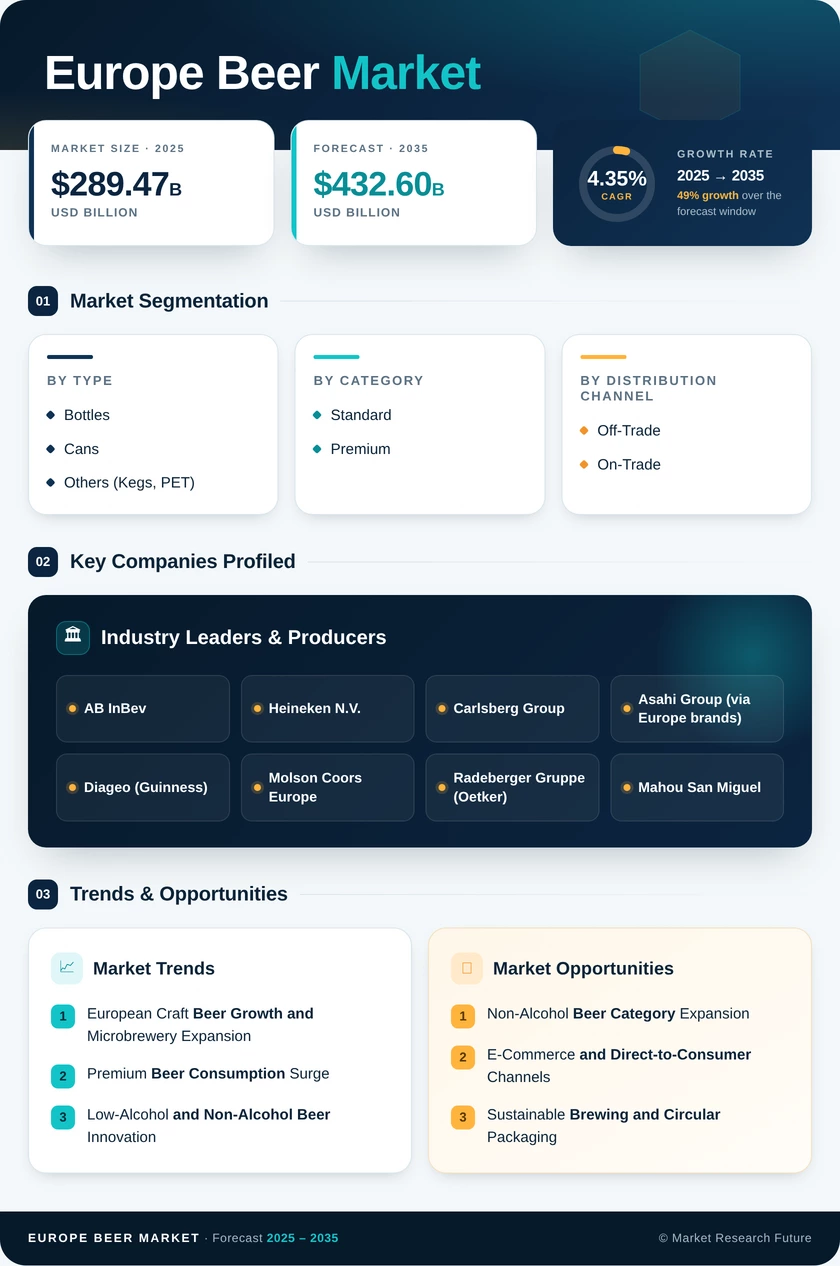
| Product Type | Lager, Ale, Non/Low-Alcohol Beer, Others | Lager | Ale |
| Category | Standard, Premium | Standard | Premium |
| Packaging Type | Bottles, Cans, Others | Bottles | Cans |
| Distribution Channel | Off-Trade, On-Trade | Off-Trade | On-Trade |
| Geography | Western Europe, Central Europe, Northern Europe, Southern Europe, Eastern Europe | Western Europe | Eastern Europe |
Market Segmentation Overview
By Product Type
| Sub-Segment | Key Trend |
| Lager | Premiumization of mainstream pilsner styles; German and Czech heritage positioning |
| Ale | UK craft ale pub trend driving IPA, pale ale, and Belgian-style growth. |
| Non/Low-Alcohol Beer | Health-conscious consumers and the EU Beating Cancer Plan are fueling category expansion. |
| Others (Stout, Wheat, Specialty) | Seasonal demand cycles; stout growth led by Guinness 0.0 and craft variants |
Lager's commanding share reflects generations of Central and Southern European drinking culture, though growth has plateaued in mature markets. Ale and non-alcohol segments are capturing incremental share through innovation and demographic shifts toward moderation.
By Category
| Sub-Segment | Key Trend |
| Standard | Price-driven volume play; dominant in Eastern and Southern Europe |
| Premium | Craft positioning, experiential packaging, and higher revenue per hectoliter |
Standard beer retains its volume leadership, but premium is the growth engine. European premium beer consumption is rising across all age groups, with consumers willing to pay more for provenance, flavor complexity, and sustainable production credentials.
By Packaging Type
| Sub-Segment | Key Trend |
| Bottles | Deposit-return systems in Germany and the Nordics sustain glass dominance |
| Cans | Craft adoption, portability, and EU recycling mandates are driving share gains. |
| Others (Kegs, PET) | On-trade draft systems and outdoor event channels |
Bottles benefit from Europe's mature recycling infrastructure, but cans are the standout growth story — lighter, more recyclable, and increasingly preferred by craft brewers seeking shelf differentiation.
By Distribution Channel
| Sub-Segment | Key Trend |
| Off-Trade | Supermarket private-label growth; e-commerce acceleration post-pandemic |
| On-Trade | Pub and restaurant recovery; experiential consumption and premium draft offerings |
Off-trade maintains its majority share through convenience and pricing advantages. On-trade recovery trajectory reflects consumers' desire for social drinking experiences, particularly within the UK craft ale pub trend ecosystem and Spain's tapas bar culture.