Request Free Sample ×

Kindly complete the form below to receive a free sample of this Report

* Please use a valid business email

Leading companies partner with us for data-driven Insights

clients tt-cursor
Hero Background

Europe Activated Carbon Market

ID: MRFR/CnM/43992-HCR
111 Pages
Chitranshi Jaiswal
Last Updated: April 06, 2026

Europe Activated Carbon Market Research Report: By Product Type (Powdered, Granular, Others), By Raw Material (Coal, Coconut, Wood, Peat, Others), By Application (Liquid-Phase, Gas-Phase) andBy End User (Water Treatment, FoodBeverage Processing, PharmaceuticalMedical, Automotive, Air Purification, Mining, Textiles, Electronics, Others)- Forecast to 2035

Share:
Download PDF ×

We do not share your information with anyone. However, we may send you emails based on your report interest from time to time. You may contact us at any time to opt-out.

Europe Activated Carbon Market Infographic
Purchase Options
  1. 1 SECTION I: EXECUTIVE SUMMARY AND KEY HIGHLIGHTS
  2.   1.1 EXECUTIVE SUMMARY
  3.     1.1.1 Market Overview
  4.     1.1.2 Key Findings
  5.     1.1.3 Market Segmentation
  6.     1.1.4 Competitive Landscape
  7.     1.1.5 Challenges and Opportunities
  8.     1.1.6 Future Outlook
  9. 2 SECTION II: SCOPING, METHODOLOGY AND MARKET STRUCTURE
  10.   2.1 MARKET INTRODUCTION
  11.     2.1.1 Definition
  12.     2.1.2 Scope of the study
  13.       2.1.2.1 Research Objective
  14.       2.1.2.2 Assumption
  15.       2.1.2.3 Limitations
  16.   2.2 RESEARCH METHODOLOGY
  17.     2.2.1 Overview
  18.     2.2.2 Data Mining
  19.     2.2.3 Secondary Research
  20.     2.2.4 Primary Research
  21.       2.2.4.1 Primary Interviews and Information Gathering Process
  22.       2.2.4.2 Breakdown of Primary Respondents
  23.     2.2.5 Forecasting Model
  24.     2.2.6 Market Size Estimation
  25.       2.2.6.1 Bottom-Up Approach
  26.       2.2.6.2 Top-Down Approach
  27.     2.2.7 Data Triangulation
  28.     2.2.8 Validation
  29. 3 SECTION III: QUALITATIVE ANALYSIS
  30.   3.1 MARKET DYNAMICS
  31.     3.1.1 Overview
  32.     3.1.2 Drivers
  33.     3.1.3 Restraints
  34.     3.1.4 Opportunities
  35.   3.2 MARKET FACTOR ANALYSIS
  36.     3.2.1 Value chain Analysis
  37.     3.2.2 Porter's Five Forces Analysis
  38.       3.2.2.1 Bargaining Power of Suppliers
  39.       3.2.2.2 Bargaining Power of Buyers
  40.       3.2.2.3 Threat of New Entrants
  41.       3.2.2.4 Threat of Substitutes
  42.       3.2.2.5 Intensity of Rivalry
  43.     3.2.3 COVID-19 Impact Analysis
  44.       3.2.3.1 Market Impact Analysis
  45.       3.2.3.2 Regional Impact
  46.       3.2.3.3 Opportunity and Threat Analysis
  47. 4 SECTION IV: QUANTITATIVE ANALYSIS
  48.   4.1 Chemicals and Materials, BY Application (USD Billion)
  49.     4.1.1 Air Treatment
  50.     4.1.2 Water Treatment
  51.     4.1.3 Industrial Processes
  52.     4.1.4 Food and Beverage
  53.     4.1.5 Pharmaceuticals
  54.   4.2 Chemicals and Materials, BY End Use Industry (USD Billion)
  55.     4.2.1 Environmental
  56.     4.2.2 Chemical
  57.     4.2.3 Mining
  58.     4.2.4 Food Processing
  59.     4.2.5 Pharmaceutical
  60.   4.3 Chemicals and Materials, BY Type (USD Billion)
  61.     4.3.1 Granular Activated Carbon
  62.     4.3.2 Powdered Activated Carbon
  63.     4.3.3 Extruded Activated Carbon
  64.     4.3.4 Impregnated Activated Carbon
  65.   4.4 Chemicals and Materials, BY Source Material (USD Billion)
  66.     4.4.1 Wood
  67.     4.4.2 Coal
  68.     4.4.3 Coconut Shell
  69.     4.4.4 Peat
  70.   4.5 Chemicals and Materials, BY Form (USD Billion)
  71.     4.5.1 Pellets
  72.     4.5.2 Granules
  73.     4.5.3 Powder
  74. 5 SECTION V: COMPETITIVE ANALYSIS
  75.   5.1 Competitive Landscape
  76.     5.1.1 Overview
  77.     5.1.2 Competitive Analysis
  78.     5.1.3 Market share Analysis
  79.     5.1.4 Major Growth Strategy in the Chemicals and Materials
  80.     5.1.5 Competitive Benchmarking
  81.     5.1.6 Leading Players in Terms of Number of Developments in the Chemicals and Materials
  82.     5.1.7 Key developments and growth strategies
  83.       5.1.7.1 New Product Launch/Service Deployment
  84.       5.1.7.2 Merger & Acquisitions
  85.       5.1.7.3 Joint Ventures
  86.     5.1.8 Major Players Financial Matrix
  87.       5.1.8.1 Sales and Operating Income
  88.       5.1.8.2 Major Players R&D Expenditure. 2023
  89.   5.2 Company Profiles
  90.     5.2.1 Cabot Carbon Limited (GB)
  91.       5.2.1.1 Financial Overview
  92.       5.2.1.2 Products Offered
  93.       5.2.1.3 Key Developments
  94.       5.2.1.4 SWOT Analysis
  95.       5.2.1.5 Key Strategies
  96.     5.2.2 Kuraray Co Ltd (JP)
  97.       5.2.2.1 Financial Overview
  98.       5.2.2.2 Products Offered
  99.       5.2.2.3 Key Developments
  100.       5.2.2.4 SWOT Analysis
  101.       5.2.2.5 Key Strategies
  102.     5.2.3 Calgon Carbon Corporation (US)
  103.       5.2.3.1 Financial Overview
  104.       5.2.3.2 Products Offered
  105.       5.2.3.3 Key Developments
  106.       5.2.3.4 SWOT Analysis
  107.       5.2.3.5 Key Strategies
  108.     5.2.4 Activated Carbon Technologies (US)
  109.       5.2.4.1 Financial Overview
  110.       5.2.4.2 Products Offered
  111.       5.2.4.3 Key Developments
  112.       5.2.4.4 SWOT Analysis
  113.       5.2.4.5 Key Strategies
  114.     5.2.5 Carbotech AC GmbH (DE)
  115.       5.2.5.1 Financial Overview
  116.       5.2.5.2 Products Offered
  117.       5.2.5.3 Key Developments
  118.       5.2.5.4 SWOT Analysis
  119.       5.2.5.5 Key Strategies
  120.     5.2.6 Evoqua Water Technologies LLC (US)
  121.       5.2.6.1 Financial Overview
  122.       5.2.6.2 Products Offered
  123.       5.2.6.3 Key Developments
  124.       5.2.6.4 SWOT Analysis
  125.       5.2.6.5 Key Strategies
  126.     5.2.7 Haycarb PLC (LK)
  127.       5.2.7.1 Financial Overview
  128.       5.2.7.2 Products Offered
  129.       5.2.7.3 Key Developments
  130.       5.2.7.4 SWOT Analysis
  131.       5.2.7.5 Key Strategies
  132.     5.2.8 Silcarbon Aktivkohle GmbH (DE)
  133.       5.2.8.1 Financial Overview
  134.       5.2.8.2 Products Offered
  135.       5.2.8.3 Key Developments
  136.       5.2.8.4 SWOT Analysis
  137.       5.2.8.5 Key Strategies
  138.     5.2.9 Carbon Activated Corporation (US)
  139.       5.2.9.1 Financial Overview
  140.       5.2.9.2 Products Offered
  141.       5.2.9.3 Key Developments
  142.       5.2.9.4 SWOT Analysis
  143.       5.2.9.5 Key Strategies
  144.   5.3 Appendix
  145.     5.3.1 References
  146.     5.3.2 Related Reports
  147. 6 LIST OF FIGURES
  148.   6.1 MARKET SYNOPSIS
  149.   6.2 EUROPE MARKET ANALYSIS BY APPLICATION
  150.   6.3 EUROPE MARKET ANALYSIS BY END USE INDUSTRY
  151.   6.4 EUROPE MARKET ANALYSIS BY TYPE
  152.   6.5 EUROPE MARKET ANALYSIS BY SOURCE MATERIAL
  153.   6.6 EUROPE MARKET ANALYSIS BY FORM
  154.   6.7 KEY BUYING CRITERIA OF CHEMICALS AND MATERIALS
  155.   6.8 RESEARCH PROCESS OF MRFR
  156.   6.9 DRO ANALYSIS OF CHEMICALS AND MATERIALS
  157.   6.10 DRIVERS IMPACT ANALYSIS: CHEMICALS AND MATERIALS
  158.   6.11 RESTRAINTS IMPACT ANALYSIS: CHEMICALS AND MATERIALS
  159.   6.12 SUPPLY / VALUE CHAIN: CHEMICALS AND MATERIALS
  160.   6.13 CHEMICALS AND MATERIALS, BY APPLICATION, 2024 (% SHARE)
  161.   6.14 CHEMICALS AND MATERIALS, BY APPLICATION, 2024 TO 2035 (USD Billion)
  162.   6.15 CHEMICALS AND MATERIALS, BY END USE INDUSTRY, 2024 (% SHARE)
  163.   6.16 CHEMICALS AND MATERIALS, BY END USE INDUSTRY, 2024 TO 2035 (USD Billion)
  164.   6.17 CHEMICALS AND MATERIALS, BY TYPE, 2024 (% SHARE)
  165.   6.18 CHEMICALS AND MATERIALS, BY TYPE, 2024 TO 2035 (USD Billion)
  166.   6.19 CHEMICALS AND MATERIALS, BY SOURCE MATERIAL, 2024 (% SHARE)
  167.   6.20 CHEMICALS AND MATERIALS, BY SOURCE MATERIAL, 2024 TO 2035 (USD Billion)
  168.   6.21 CHEMICALS AND MATERIALS, BY FORM, 2024 (% SHARE)
  169.   6.22 CHEMICALS AND MATERIALS, BY FORM, 2024 TO 2035 (USD Billion)
  170.   6.23 BENCHMARKING OF MAJOR COMPETITORS
  171. 7 LIST OF TABLES
  172.   7.1 LIST OF ASSUMPTIONS
  173.     7.1.1
  174.   7.2 Europe MARKET SIZE ESTIMATES; FORECAST
  175.     7.2.1 BY APPLICATION, 2026-2035 (USD Billion)
  176.     7.2.2 BY END USE INDUSTRY, 2026-2035 (USD Billion)
  177.     7.2.3 BY TYPE, 2026-2035 (USD Billion)
  178.     7.2.4 BY SOURCE MATERIAL, 2026-2035 (USD Billion)
  179.     7.2.5 BY FORM, 2026-2035 (USD Billion)
  180.   7.3 PRODUCT LAUNCH/PRODUCT DEVELOPMENT/APPROVAL
  181.     7.3.1
  182.   7.4 ACQUISITION/PARTNERSHIP
  183.     7.4.1

Europe Chemicals and Materials Market Segmentation

Chemicals and Materials By Application (USD Billion, 2022-2035)
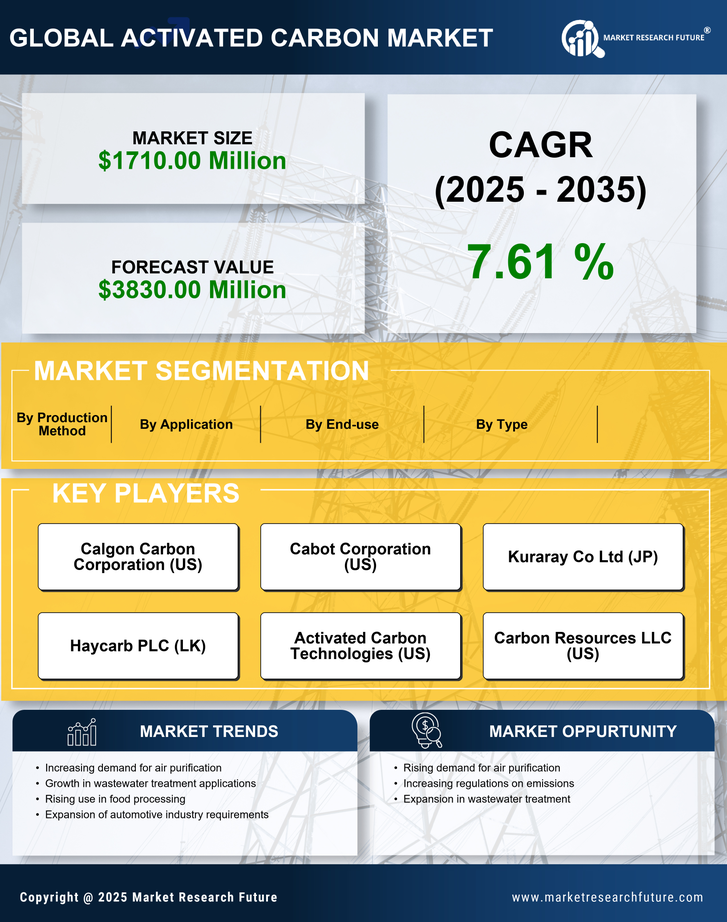
  • Air Treatment
  • Water Treatment
  • Industrial Processes
  • Food and Beverage
  • Pharmaceuticals

Chemicals and Materials By End Use Industry (USD Billion, 2022-2035)

  • Environmental
  • Chemical
  • Mining
  • Food Processing
  • Pharmaceutical

Chemicals and Materials By Type (USD Billion, 2022-2035)

  • Granular Activated Carbon
  • Powdered Activated Carbon
  • Extruded Activated Carbon
  • Impregnated Activated Carbon

Chemicals and Materials By Source Material (USD Billion, 2022-2035)

  • Wood
  • Coal
  • Coconut Shell
  • Peat

Chemicals and Materials By Form (USD Billion, 2022-2035)

  • Pellets
  • Granules
  • Powder

Compare Licence

×
Features License Type
Single User Multiuser License Enterprise User
Price $4,950 $5,950 $7,250
Maximum User Access Limit 1 User Upto 10 Users Unrestricted Access Throughout the Organization
Free Customization
Direct Access to Analyst
Deliverable Format
Platform Access
Discount on Next Purchase 10% 15% 15%
Printable Versions