Segmentation Quick Reference
| Dimension | Sub-Segments | Dominant Segment | Fastest Growing Segment |
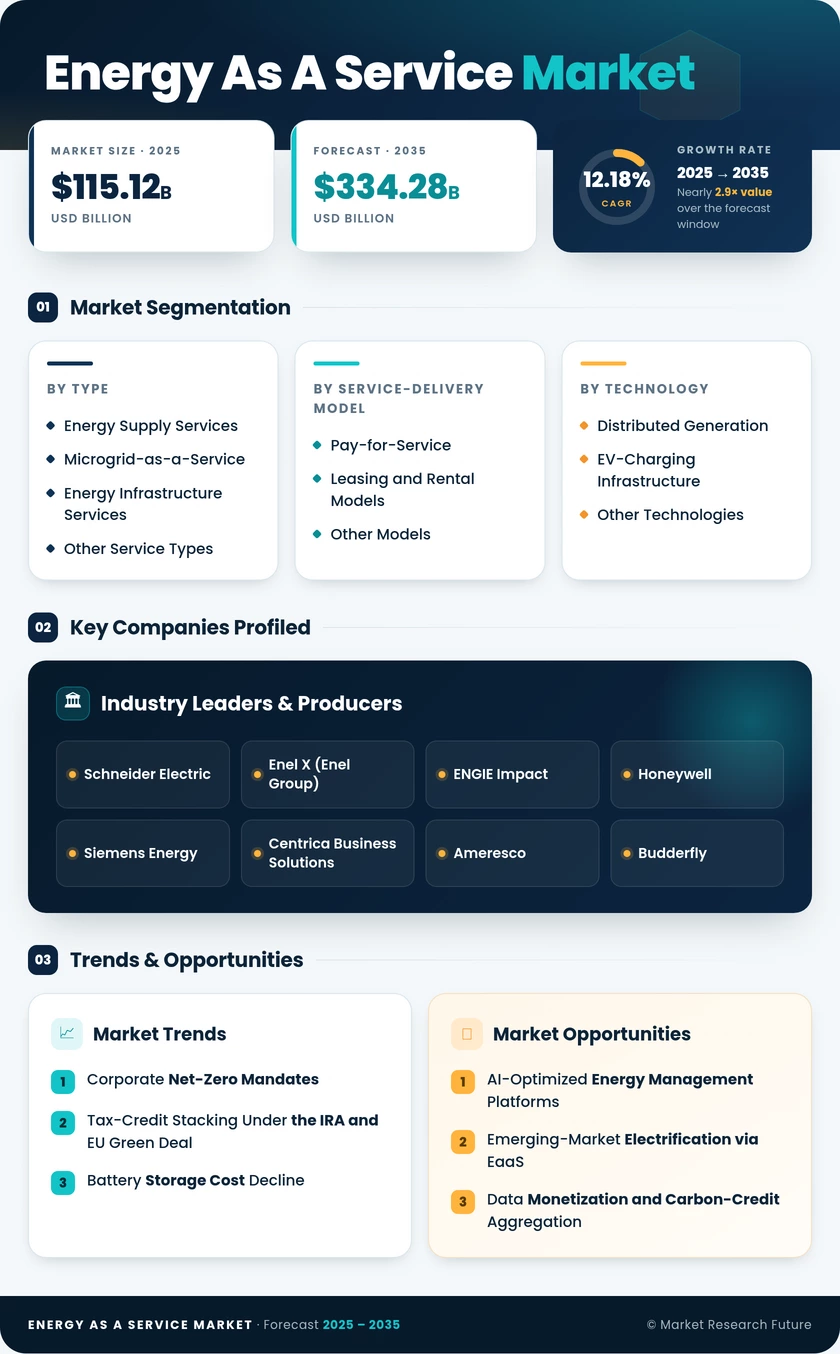
| Service Type | Energy Supply Services, Microgrid-as-a-Service, Energy Infrastructure Services, Other | Energy Supply Services | Microgrid-as-a-Service |
| Service-Delivery Model | Pay-for-Service, Leasing and Rental Models, Other | Pay-for-Service | Leasing and Rental Models |
| Energy as a Service Market | Distributed Generation, EV-Charging Infrastructure, Other | Distributed Generation | EV-Charging Infrastructure |
| End User | Commercial, Industrial | Commercial | Industrial |
| Geography | North America, Europe, Asia-Pacific, South America, Middle East & Africa | North America | Asia-Pacific |
- --
Market Segmentation Overview
By Service Type
| Sub-Segment | Key Trend |
| Energy Supply Services | Rising corporate PPA volumes; shift from unbundled RECs to contracted clean energy |
| Microgrid-as-a-Service | Resilience-first procurement among hospitals, data centers, and military facilities |
| Energy Infrastructure Services | Deep-retrofit financing for HVAC, building envelope, and LED lighting upgrades |
| Other Service Types | Energy auditing, consulting, and carbon-accounting advisory services |
Energy Supply Services remain the revenue backbone of the Energy as a Service Market, driven by multinational corporations replacing spot-market electricity exposure with long-term contracted renewable supply. Microgrid-as-a-Service is accelerating as climate-related grid disruptions compel facility operators to invest in islanding-capable systems.
By Service-Delivery Model
| Sub-Segment | Key Trend |
| Pay-for-Service | Outcome-linked pricing tied to energy savings or uptime guarantees |
| Leasing and Rental Models | Asset-light access to rooftop solar, batteries, and EV chargers |
| Other Models | Shared-savings, managed-energy, and performance-contracting hybrids |
Pay-for-Service contracts dominate because they transfer performance risk from the customer to the provider. Leasing and Rental models are expanding most rapidly, opening the Energy as a Service Market to tenants with limited capital-expenditure authority.
By Energy as a Service Market
| Sub-Segment | Key Trend |
| Distributed Generation | Rooftop solar PV and combined heat-and-power installations |
| EV-Charging Infrastructure | Depot-level fleet charging integrated with building energy management |
| Other Technologies | Battery storage, demand response, smart controls, and IoT platforms |
Distributed Generation forms the technology foundation of most EaaS contracts, while EV-Charging Infrastructure is the fastest-growing segment as commercial fleets electrify at scale.
By End User
| Sub-Segment | Key Trend |
| Commercial | Office, retail, healthcare, and hospitality energy procurement |
| Industrial | Process-heat electrification, carbon-border compliance, and heavy-load management |
Commercial facilities account for the majority of EaaS revenue due to immediate decarbonization pressure and multi-site portfolio optimization needs. Industrial adoption is accelerating as manufacturers seek alternatives to fossil-fired process energy.
By Geography
| Sub-Segment | Key Trend |
| North America | IRA incentives; state-level renewable mandates; corporate PPA leadership |
| Europe | EU Green Deal; EPBD renovation wave; offshore wind integration |
| Asia-Pacific | India PLI scheme; China carbon ETS; ASEAN grid interconnection |
| South America | Brazil distributed-solar boom; Chile green-hydrogen corridor |
| Middle East & Africa | Gulf solar PPAs; Sub-Saharan mini-grid electrification |
North America commands the largest share of the Energy as a Service Market, while Asia-Pacific is growing fastest. Europe maintains a strong second position anchored by regulatory mandates driving energy efficiency financing through EaaS models across the building stock.