Segmentation Quick Reference
| Dimension | Sub-Segments | Dominant Segment | Fastest Growing Segment |
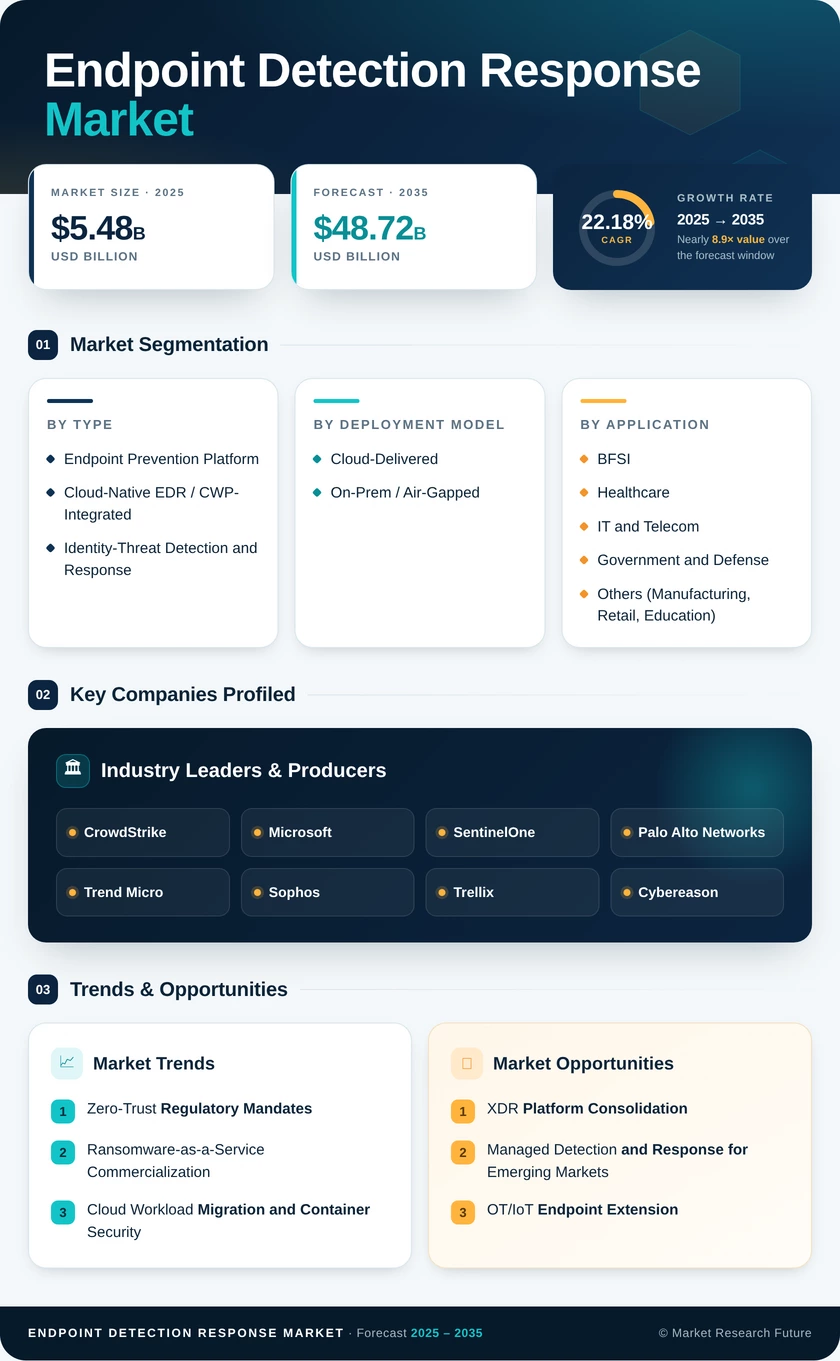
| Solution Type | Endpoint Prevention Platform; Cloud-Native EDR / CWP-Integrated; Identity-Threat Detection and Response | Endpoint Prevention Platform | Identity-Threat Detection and Response |
| Deployment Model | Cloud-Delivered; On-Prem / Air-Gapped | Cloud-Delivered | On-Prem / Air-Gapped |
| End-User Vertical | BFSI; Healthcare; IT and Telecom; Government and Defense; Others | BFSI | Healthcare |
| Enterprise Size | Large Enterprises; Small and Medium Enterprises | Large Enterprises | Small and Medium Enterprises |
| Geography | North America; Europe; Asia-Pacific; South America; Middle East & Africa | North America | Middle East & Africa |
Market Segmentation Overview
By Solution Type
| Sub-Segment | Key Trend |
| Endpoint Prevention Platform | Consolidation with next-gen AV and device control into unified lightweight agents |
| Cloud-Native EDR / CWP-Integrated | eBPF-based container sensors replacing sidecar architectures for Kubernetes-native visibility |
| Identity-Threat Detection and Response | Credential-abuse detection merging with traditional endpoint telemetry for lateral-movement prevention |
Endpoint prevention platforms remain the entry point for most organizations upgrading from legacy antivirus, while cloud-native EDR is expanding rapidly as enterprises migrate workloads to public cloud environments. Identity-threat detection and response is the newest category, reflecting the growing dominance of credential-based attack vectors over traditional malware delivery.
By Deployment Model
| Sub-Segment | Key Trend |
| Cloud-Delivered | SaaS-based management consoles with auto-updating agent architectures reducing deployment friction |
| On-Prem / Air-Gapped | Purpose-built appliances for defense, intelligence, and critical infrastructure environments requiring sovereign data processing |
Cloud-delivered agents dominate new deployments, but air-gapped configurations are seeing renewed interest from defense and critical-infrastructure operators who require complete data sovereignty and cannot depend on external connectivity for threat detection.
By End-User Vertical
| Sub-Segment | Key Trend |
| BFSI | Regulatory-driven refresh cycles and transaction-monitoring integration with EDR telemetry |
| Healthcare | Connected medical device security and HIPAA breach-notification compliance |
| IT and Telecom | 5G edge infrastructure protection and managed service provider bundling |
| Government and Defense | Zero-trust architecture mandates and classified-environment EDR deployments |
| Others (Manufacturing, Retail, Education) | OT/IoT convergence driving EDR extension to non-traditional endpoint classes |
BFSI and healthcare together represent over 40% of vertical spending, while manufacturing and retail are emerging as high-growth segments as operational technology environments increasingly connect to enterprise IT networks.
By Enterprise Size
| Sub-Segment | Key Trend |
| Large Enterprises | Platform consolidation reducing tool sprawl and improving cross-domain detection correlation |
| Small and Medium Enterprises | MDR-bundled EDR-as-a-service lowering the cost barrier for organizations with limited security staffing |
Large enterprises continue to account for the majority of EDR spending, but SME adoption is accelerating faster in percentage terms as managed detection and response providers make enterprise-grade protection accessible at per-endpoint-per-month pricing.