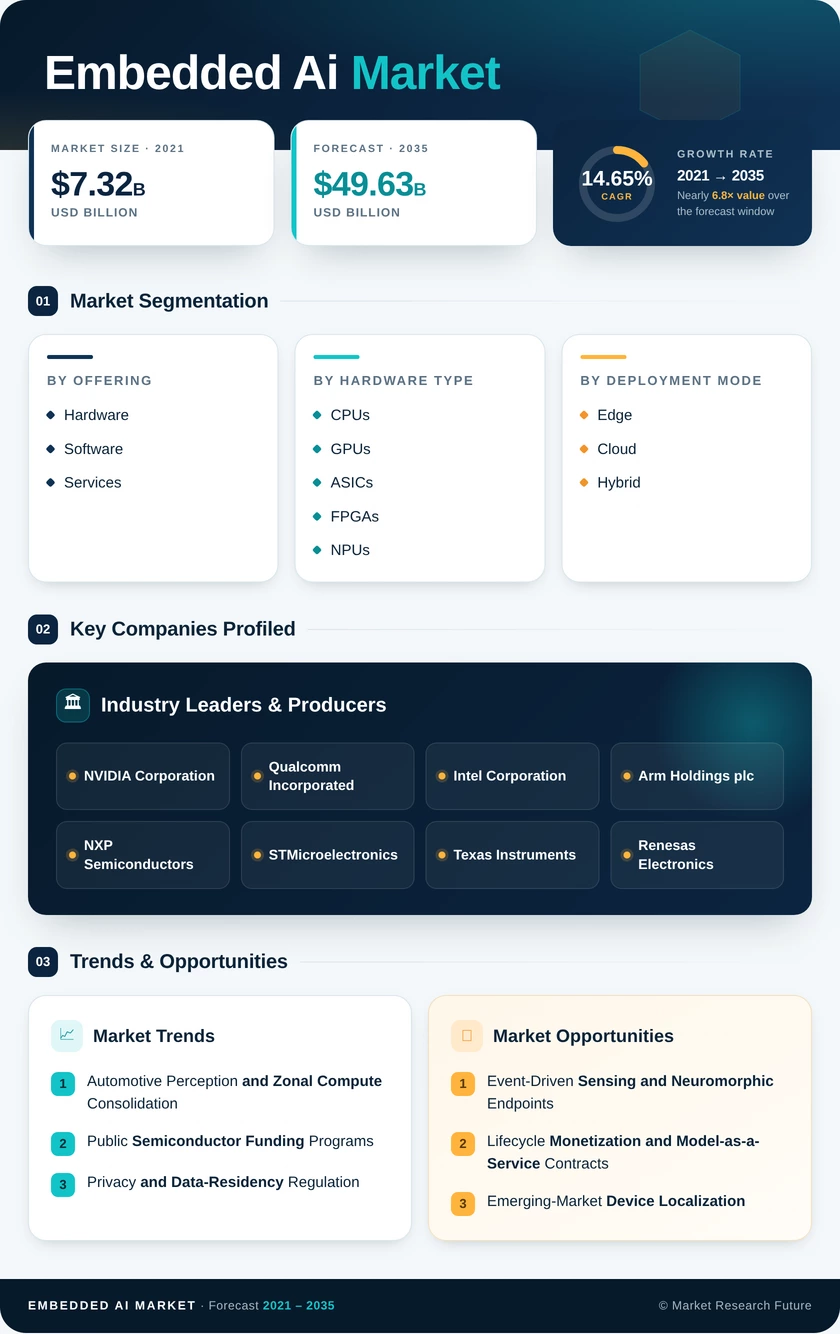
Embedded AI Market (2026 – 2035)

ID: MRFR/ICT/10733-CR 200 Pages Kiran Jinkalwad Last Updated: September 17, 2026
Embedded AI Market Size, Share and Research Report By Deployment Mode (Edge, Cloud, Hybrid), By Data Type (Sensor Data, Image and Video Data, Numeric Data, Text and Audio Data), By End-User Vertical (BFSI, IT and Telecommunication, Automotive, Retail and E-Commerce, Healthcare, Manufacturing and Industrial, Consumer Electronics, Aerospace and Defense) and By Regional (North America, Europe, Asia-Pacific, South America, Middle East & Africa) - Industry Forecast to 2035.
Embedded AI Market
Market Size
Forecast Period2026-2035
CAGR (2026-2035)14.65%
2025 Market SizeUSD 12.65 Billion
Key Players
NVIDIA Corporation
Qualcomm Incorporated
Intel Corporation
Arm Holdings plc
NXP Semiconductors
STMicroelectronics
Opportunities
  • Event-Driven Sensing and Neuromorphic Endpoints
  • Lifecycle Monetization and Model-as-a-Service Contracts
  • Emerging-Market Device Localization
  1. 1 Market Summary | |
    1. 1.1 Study Assumptions & Market Definition | |
    2. 1.2 Scope of the Study | |
    3. 1.3 Research Methodology | |
  2. 2 Key Report Takeaways | |
    1. 2.1 By Offering | |
    2. 2.2 By Hardware Type | |
    3. 2.3 By Deployment Mode | |
    4. 2.4 By Data Type | |
    5. 2.5 By End-User Vertical | |
    6. 2.6 By Region | |
  3. 3 Market Size and Forecast (2021–2035) | |
    1. 3.1 Historical Market Size (2021–2024) | |
    2. 3.2 Base Year Assessment (2025) | |
    3. 3.3 Forecast Market Size (2026–2035) | |
    4. 3.4 Year-over-Year Growth Analysis | |
  4. 4 Driver Impact Analysis | |
    1. 4.1 Automotive Perception and Zonal Compute Consolidation | |
    2. 4.2 Public Semiconductor Funding Programs | |
    3. 4.3 Privacy and Data-Residency Regulation | |
    4. 4.4 Energy-Per-Inference Improvement in Accelerator Silicon | |
    5. 4.5 Industrial Predictive Maintenance Retrofit | |
    6. 4.6 Consumer Device NPU Standardization | |
    7. 4.7 Open-Source Runtime and Model Compression Toolchains | |
  5. 5 Restraints Impact Analysis | |
    1. 5.1 Memory Bandwidth and Thermal Ceilings | |
    2. 5.2 Fragmented Toolchains and Model Portability Gaps | |
    3. 5.3 Shortage of Embedded Inference Engineering Talent | |
    4. 5.4 Security Certification and Adversarial Attack Surface | |
    5. 5.5 Advanced-Node Cost and Packaging Capacity Constraints | |
  6. 6 Opportunities | |
    1. 6.1 Event-Driven Sensing and Neuromorphic Endpoints | |
    2. 6.2 Lifecycle Monetization and Model-as-a-Service Contracts | |
    3. 6.3 Emerging-Market Device Localization | |
    4. 6.4 Regulated Healthcare Inference at the Bedside | |
    5. 6.5 Telecom Radio-Access Inference | |
  7. 7 Regional Market Share and Country-Level Analysis | |
    1. 7.1 North America | | |
      1. 7.1.1 US | | |
      2. 7.1.2 Canada | | |
      3. 7.1.3 Mexico | |
    2. 7.2 Europe | | |
      1. 7.2.1 Germany | | |
      2. 7.2.2 UK | | |
      3. 7.2.3 France | | |
      4. 7.2.4 Italy | | |
      5. 7.2.5 Spain | | |
      6. 7.2.6 Nordic Countries | | |
      7. 7.2.7 Russia | | |
      8. 7.2.8 Rest of Europe | |
    3. 7.3 Asia-Pacific | | |
      1. 7.3.1 China | | |
      2. 7.3.2 India | | |
      3. 7.3.3 Japan | | |
      4. 7.3.4 South Korea | | |
      5. 7.3.5 ASEAN | | |
      6. 7.3.6 Rest of Asia-Pacific | |
    4. 7.4 South America | | |
      1. 7.4.1 Brazil | | |
      2. 7.4.2 Argentina | | |
      3. 7.4.3 Rest of South America | |
    5. 7.5 Middle East & Africa | | |
      1. 7.5.1 Saudi Arabia | | |
      2. 7.5.2 UAE | | |
      3. 7.5.3 South Africa | | |
      4. 7.5.4 Egypt | | |
      5. 7.5.5 Rest of MEA | |
  8. 8 Future Outlook (2026–2035) | |
    1. 8.1 Generative Models Descend to the Endpoint | |
    2. 8.2 Platform Economics Replace Component Sales | |
    3. 8.3 Software-Defined Vehicles Sustain the Volume Engine | |
    4. 8.4 Energy Accounting Becomes a Purchase Criterion | |
  9. 9 Segmentation Analysis | |
    1. 9.1 By Offering | | |
      1. 9.1.1 Hardware | | |
      2. 9.1.2 Software and Services | |
    2. 9.2 By Hardware Type | | |
      1. 9.2.1 CPUs | | |
      2. 9.2.2 GPUs | | |
      3. 9.2.3 ASICs | | |
      4. 9.2.4 FPGAs | | |
      5. 9.2.5 NPUs and TPUs | | |
      6. 9.2.6 Neuromorphic Chips | | |
      7. 9.2.7 Vision Processing Units | |
    3. 9.3 By Deployment Mode | | |
      1. 9.3.1 Edge | | |
      2. 9.3.2 Cloud | | |
      3. 9.3.3 Hybrid | |
    4. 9.4 By Data Type | | |
      1. 9.4.1 Sensor Data | | |
      2. 9.4.2 Image and Video Data | | |
      3. 9.4.3 Numeric Data | | |
      4. 9.4.4 Text and Audio Data | |
    5. 9.5 By End-User Vertical | | |
      1. 9.5.1 BFSI | | |
      2. 9.5.2 IT and Telecommunication | | |
      3. 9.5.3 Automotive | | |
      4. 9.5.4 Retail and E-Commerce | | |
      5. 9.5.5 Healthcare | | |
      6. 9.5.6 Manufacturing and Industrial | | |
      7. 9.5.7 Consumer Electronics | | |
      8. 9.5.8 Aerospace and Defense | |
  10. 10 Competitive Landscape | |
    1. 10.1 Market Concentration Analysis (2025) | |
    2. 10.2 Competitive Benchmarking Matrix | |
    3. 10.3 Company Profiles | |
  11. 11 Recent News & Developments | |
  12. 12 Report Scope and Methodology | |
  13. 13 Detailed Sources and Citations | |
  14. 14 Frequently Asked Questions | | LIST OF TABLES | |
  15. TABLE 1 Global Embedded AI Market Size & Forecast, by Revenue (USD Billion), 2021–2035 | |
  16. TABLE 2 Global Embedded AI Market — Year-over-Year Growth Analysis, 2021–2035 | |
  17. TABLE 3 Driver Impact Analysis — Global Embedded AI Market, 2026–2035 | |
  18. TABLE 4 Restraint Impact Analysis — Global Embedded AI Market, 2026–2035 | |
  19. TABLE 5 Global Embedded AI Market Size, by Region, 2021–2035 (USD Billion) | |
  20. TABLE 6 North America Embedded AI Market Size, by Country, 2021–2035 (USD Billion) | |
  21. TABLE 7 Europe Embedded AI Market Size, by Country, 2021–2035 (USD Billion) | |
  22. TABLE 8 Asia-Pacific Embedded AI Market Size, by Country, 2021–2035 (USD Billion) | |
  23. TABLE 9 South America Embedded AI Market Size, by Country, 2021–2035 (USD Billion) | |
  24. TABLE 10 Middle East & Africa Embedded AI Market Size, by Country, 2021–2035 (USD Billion) | |
  25. TABLE 11 Global Embedded AI Market Size, by Offering, 2021–2035 (USD Billion) | |
  26. TABLE 12 Global Embedded AI Market Size, by Hardware Type, 2021–2035 (USD Billion) | |
  27. TABLE 13 Global Embedded AI Market Size, by Deployment Mode, 2021–2035 (USD Billion) | |
  28. TABLE 14 Global Embedded AI Market Size, by Data Type, 2021–2035 (USD Billion) | |
  29. TABLE 15 Global Embedded AI Market Size, by End-User Vertical, 2021–2035 (USD Billion) | |
  30. TABLE 16 Competitive Benchmarking Matrix — Global Embedded AI Market, 2025 | |
  31. TABLE 17 Company Profiles — Key Players, Global Embedded AI Market | |
  32. TABLE 18 Recent Developments & Strategic Announcements, 2024–2025 | |
  33. TABLE 19 Report Scope & Methodology Summary | |
  34. TABLE 20 Detailed Sources and Citations Index | | LIST OF FIGURES | |
  35. FIGURE 1 Global Embedded AI Market — Market Dynamics Overview (Drivers, Restraints, Opportunities) | |
  36. FIGURE 2 Industry Value Chain Analysis — Embedded AI Market | |
  37. FIGURE 3 Porter's Five Forces Analysis — Embedded AI Market | |
  38. FIGURE 4 Global Embedded AI Market Size Trend, 2021–2035 (USD Billion) | |
  39. FIGURE 5 Year-over-Year Growth Curve, 2022–2035 (%) | |
  40. FIGURE 6 Market Share by Offering, 2025 (%) | |
  41. FIGURE 7 Market Share by Hardware Type, 2025 (%) | |
  42. FIGURE 8 Market Share by Deployment Mode, 2025 (%) | |
  43. FIGURE 9 Market Share by Data Type, 2025 (%) | |
  44. FIGURE 10 Market Share by End-User Vertical, 2025 (%) | |
  45. FIGURE 11 Regional Revenue Share, 2025 (%) | |
  46. FIGURE 12 Regional CAGR Comparison, 2026–2035 (%) | |
  47. FIGURE 13 Competitive Landscape — Estimated Revenue Share Bands, 2025 | |
  48. FIGURE 14 Strategic Positioning Map — Platform Depth vs. Vertical Specialization

Segmentation Quick Reference

DimensionSub-SegmentsDominant SegmentFastest Growing Segment
By OfferingHardware; Software and ServicesHardware (57.0% share)Software and Services (17.6% CAGR)
By Hardware TypeCPUs; GPUs; ASICs; FPGAs; NPUs and TPUs; Neuromorphic Chips; Vision Processing UnitsCPUs (31.5% share)Neuromorphic Chips (17.1% CAGR)
By Deployment ModeEdge; Cloud; HybridEdge (54.5% share)Hybrid (17.5% CAGR)
By Data TypeSensor Data; Image and Video Data; Numeric Data; Text and Audio DataImage and Video Data (43.0% share)Text and Audio Data (17.3% CAGR)
By End-User VerticalBFSI; IT and Telecommunication; Automotive; Retail and E-Commerce; Healthcare; Manufacturing and Industrial; Consumer Electronics; Aerospace and DefenseAutomotive (21.8% share)IT and Telecommunication (16.4% CAGR)
By RegionNorth America; Europe; Asia-Pacific; South America; Middle East & AfricaNorth America (36.4% share)Asia-Pacific (17.2% CAGR)


Market Segmentation Overview

By Offering

Sub-SegmentKey Trend
HardwareAccelerator content per device rising as zonal and heterogeneous architectures replace fixed-function controllers
Software and ServicesCompiler, quantization, and fleet-management licensing shifting revenue toward recurring contracts


Hardware leads on 57.0% share because no deployment ships without qualified silicon, and automotive and industrial buyers requalify reluctantly. Software and Services outpaces it at 17.6% CAGR since the cost of porting and maintaining models across a twelve-year service life now exceeds the accelerator itself for regulated products. Suppliers increasingly price the two together, which is why toolchain depth — not die area — determines design-win retention.

By Hardware Type

Sub-SegmentKey Trend
CPUsBackward compatibility keeps legacy firmware running without requalification spend
GPUsConvolution-heavy perception workloads sustain demand in automotive and inspection
ASICsPer-unit cost dominance in high-volume appliance and speaker endpoints
FPGAsField-upgradable logic favored where industrial standards remain in flux
NPUs and TPUsStandard inclusion in mainstream smartphone and PC silicon
Neuromorphic ChipsEvent-driven computation enabling microwatt always-on sensing
Vision Processing UnitsParallel detection and HDR pipelines offloading the main processor


CPUs hold 31.5% of hardware revenue on installed-base inertia, since requalifying firmware against a new instruction set costs more than the efficiency gain returns for most industrial programs. Neuromorphic Chips grow fastest at 17.1% CAGR because spike encoding cuts memory movement, the dominant energy cost in frame-based designs, making sealed battery-powered sensing commercially feasible. FPGAs retain a distinct industrial buyer who values field reconfiguration against shifting standards, while ASICs win wherever unit volumes amortize mask costs.

By Deployment Mode

Sub-SegmentKey Trend
EdgeLatency-critical and offline-capable inference for robotics, vehicles, and wearables
CloudBursty retraining workloads and coordinated global model rollouts
HybridLocal inference paired with central retraining and fleet-level analytics


Edge commands 54.5% of revenue because drones, driver-assistance systems, and factory robots must continue operating through network loss, making local execution a functional requirement rather than an optimization. Hybrid grows fastest at 17.5% CAGR as operators discover they need both — deterministic local decisions plus centralized model improvement across a fleet. Cloud-only deployment persists for global rollouts but loses ground as egress pricing and residency rules make repeated data transit expensive.

By Data Type

Sub-SegmentKey Trend
Sensor DataVibration, thermal, and inertial streams driving industrial retrofit demand
Image and Video DataHigh-fidelity scene understanding across surveillance, perception, and inspection
Numeric DataProcess control and anomaly detection where interpretability is required
Text and Audio DataCompressed speech and small language models reaching microcontroller budgets


Image and Video Data leads at 43.0% share because perception pipelines consuming 30–120 frames per second set throughput floors that only dedicated accelerators meet, and surveillance plus automotive together represent the largest deployed camera base. Text and Audio Data grows fastest at 17.3% CAGR as quantized speech models fit within single-digit-megabyte memory, turning voice control into a commodity feature rather than a premium differentiator. Sensor Data underwrites the industrial retrofit case on far smaller compute budgets.

By End-User Vertical

Sub-SegmentKey Trend
BFSIOn-premise fraud scoring and branch behavior analytics under data-residency rules
IT and TelecommunicationInference relocated into radio-access and aggregation sites
AutomotiveADAS, driver monitoring, and consolidation into zonal controllers
Retail and E-CommerceLoss prevention and shelf analytics with local-only frame processing
HealthcarePortable diagnostics and continuous monitoring under updated clearance pathways
Manufacturing and IndustrialInspection and predictive maintenance on existing equipment
Consumer ElectronicsOn-device assistants and computational imaging
Aerospace and DefenseAutonomous ISR and perception under contested-connectivity conditions


Automotive holds 21.8% share because safety scoring protocols effectively mandate camera-based driver monitoring across volume trims, embedding inference in every line rather than flagship models alone. IT and Telecommunication grows fastest at 16.4% CAGR as carriers build the middle compute tier that hybrid architectures depend on. Manufacturing and Industrial tracks closely behind on retrofit payback economics, while Healthcare expands more slowly but with replacement cycles measured in a decade rather than a product season.




Download PDF ×

We do not share your information with anyone. However, we may send you emails based on your report interest from time to time. You may contact us at any time to opt-out.