×
  • Cat-intel
  • MedIntelliX
  • Resources
  • About Us
  • Hero Background
    English
    Chinese
    French
    Japanese
    Korean
    German
    Spanish

    Electronic Weighing Scale Market Analysis

    ID: MRFR/SEM/6135-HCR
    100 Pages
    Ankit Gupta
    October 2025

    Electronic Weighing Scale Market Research Report Information By Type (Table Top Scale, Platform Scale, Precision Scale, Pocket Scale), By End-User (Industrial, Veterinary, Scientific/Laboratory, Jewelry, Food & Beverages, Health & Fitness, Industrial, Education) And By Region (North America, Europe, Asia-Pacific, And Rest Of The World) –Market Forecast Till 2035

    Share:
    Download PDF ×

    We do not share your information with anyone. However, we may send you emails based on your report interest from time to time. You may contact us at any time to opt-out.

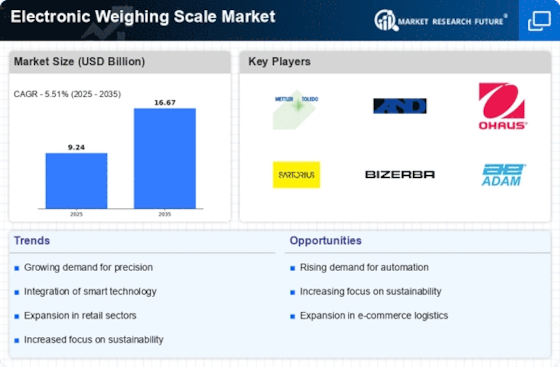
    Electronic Weighing Scale Market Infographic
    Purchase Options

    Market Analysis

    In-depth Analysis of Electronic Weighing Scale Market Industry Landscape

    The global electronic weighing scale market is set to reach US$ 14.2 BN by 2032, growing at a 6.30% CAGR between years 2023-2032. The rapid technological evolution in electronic weighing scales is a key market driver. Besides, the uptake of advanced features such as digital displays, precision sensors, and connectivity options by manufacturers to meet the growing demands of diverse industries boosts the market size. The market for digital weighing scales is going through big changes because of a mix of new technologies, rules from the government and people's changing likes. Lately, electronic weighing scales have become very popular. They are replacing old mechanical ones in businesses and homes too. This change is mostly because of the exactness, speed and ease given by electronic weighing machines. These tech improvements not only make weight measurements more precise but also help to improve user ease. These fancy electronic weighing scales are being used more and more by businesses like health care, food stores, delivery services and shops to make their work better. Rules and guidelines are very important in deciding how the market for electronic weighing scales works. Governments and rule groups around the world are putting strong rules in place to make sure measuring tools work right. Following these rules has become very important for makers. It changes how they make things and controls their quality. Sticking to rules for electronic weighing machines makes sure they are reliable. It also helps make different industries, that need exact weight measures safe and sound. Also, the way things work in the market is greatly affected by people wanting easy-to-carry and simple weighing tools. As companies grow all over the world and we need to move more, there's an increasing use of small electronic scales that can be taken anywhere. These scales are used in many places like farmers markets and fast healthcare services. They show how today's weighing tools can be changed to fit different situations. As more people use portable weighing scales, manufacturers are making new and strong but light electronic ones. They do this to meet the changing needs of customers in their market. The electronic weighing scale market has lots of big and new companies. Big companies usually work hard on making new products by doing research and development often. At the same time, new players use technology improvements to introduce solutions that can take over small markets. This game makes makers always changing what they sell. They want to beat others in tech, quality and things that save money.

    Author
    Ankit Gupta
    Senior Research Analyst

    Ankit Gupta is an analyst in market research industry in ICT and SEMI industry. With post-graduation in "Telecom and Marketing Management" and graduation in "Electronics and Telecommunication" vertical he is well versed with recent development in ICT industry as a whole. Having worked on more than 150+ reports including consultation for fortune 500 companies such as Microsoft and Rio Tinto in identifying solutions with respect to business problems his opinions are inclined towards mixture of technical and managerial aspects.

    Leave a Comment

    FAQs

    How much is the electronic weighing scale market?

    The Electronic Weighing Scale Market size was valued at USD 9.24 billion in 2024.

    What is the growth rate of the electronic weighing scale market?

    The global market is projected to grow at a CAGR of 5.51% during the forecast period, 2025 to 2035.

    Which region held the largest market share in the electronic weighing scale market?

    North America had the largest share in the global market

    Who are the key players in the electronic weighing scale market?

    The key players in the market are Contech Instruments Ltd (India). Shinko Denshi Co., Ltd (Japan), Cardinal Scale Manufacturing Company (US) Doran Scales, Inc. (US), and Avery Weigh Tronix LLC (US).

    Which end-user led the electronic weighing scale market?

    The industrial category dominated the market in 2022.

    Market Summary

    As per Market Research Future Analysis, the Global Electronic Weighing Scale Market was valued at USD 9.24 Billion in 2024 and is projected to grow from USD 9.24 Billion in 2024 to USD 16.67 Billion by 2035, with a CAGR of 5.51% during the forecast period. Key drivers include increasing industrial automation and the adoption of electronic scales in retail and jewelry sectors. The market is segmented by type, with table top scales holding over 25% market share in 2022, and by end-user, where the industrial segment accounts for more than 30%. North America leads the market, driven by a strong pharmaceutical sector and retail growth, while Asia-Pacific is expected to exhibit the fastest growth rate.

    Key Market Trends & Highlights

    The electronic weighing scale market is witnessing significant growth driven by automation and digitalization.

    • Market Size in 2024: USD 9.24 Billion Projected Market Size by 2035: USD 16.67 Billion CAGR from 2025 to 2035: 5.51% Table top scales accounted for over 25% of the market in 2022

    Market Size & Forecast

    2024 Market Size USD 9.24 Billion
    2035 Market Size USD 16.67 Billion
    CAGR (2024-2035) 5.51%
    Largest Regional Market Share in 2024 North America

    Major Players

    <p>Key companies include Mettler Toledo, Contech Instruments Ltd, Shinko Denshi Co., Ltd, Cardinal Scale Manufacturing Company, and Doran Scales, Inc.</p>

    Market Trends

    Rising demand for automated and digital weighing scales will drive market growth.

    The market CAGR for electronic weighing scales is projected to rise due to the rising demand for automated and digital scales. There is a huge demand for replacing outdated weighing machines with cutting-edge, innovative goods because conventional weighing machines cannot measure with such accuracy up to decimals. With the development of digital weighing devices, even the weights can be precise to a few decimal places, and the automation process is simplified. Regardless of the size of the activity, automated weighing machines can be employed in small- or large-scale companies.

    By boosting production, decreasing product loss, precisely measuring ingredients, and optimising product amounts, the adoption of such automated systems results in significant profitability. All these advantages attract manufacturers to switch to automated weighing systems.

    Moreover, electronic weighing devices let retail stores in the market determine a product's weight. The electronic weighing system is a crucial piece of equipment in retail stores thanks to the basic load cell, suitable signal conditioners, and output recorders/indicators. Electronic weighing machines are in demand in retail establishments because to their high reliability, precision, durability, portability, and ease of calibration qualities.Therefore, throughout the upcoming years, the expansion of the electronic weighing machines market will be driven by the presence of big retail establishments in both developed and developing nations.

    For instance, the 2020 Annual Retail Trade Survey from the US Census Bureau shows that US retail sales climbed 3.1% from $5,402.3 billion in 2019 to $5,570.4 billion in 2020. As a result, the market for electronic weighing machines is expanding due to the sharp increase in retail sales.

    Electronic Weighing Scale Market Market Drivers

    Increased Regulatory Compliance

    The Global Electronic Weighing Scale Market Industry is driven by heightened regulatory compliance across various sectors. Governments worldwide enforce strict regulations regarding weight measurement accuracy, particularly in industries such as food and pharmaceuticals. Compliance with these regulations necessitates the adoption of electronic weighing scales, which offer superior accuracy and reliability. For example, the food industry must adhere to weight standards to ensure fair trade practices. As regulatory frameworks become more stringent, the demand for electronic weighing scales is likely to rise, further propelling market growth.

    Emerging Markets and Urbanization

    Emerging markets and urbanization contribute to the growth of the Global Electronic Weighing Scale Market Industry. As urban populations expand, there is a rising demand for efficient weighing solutions in various sectors, including retail and agriculture. Countries in Asia-Pacific and Latin America are witnessing rapid urbanization, leading to increased investments in infrastructure and commercial activities. This trend creates opportunities for electronic weighing scales, as businesses seek to enhance operational efficiency and accuracy. The market's growth in these regions is indicative of the broader global trend towards modernization and technological adoption.

    Growth of E-Commerce and Online Retail

    The rise of e-commerce and online retail significantly impacts the Global Electronic Weighing Scale Market Industry. As online shopping continues to expand, businesses require efficient weighing solutions for shipping and logistics. Electronic weighing scales facilitate accurate weight measurements, which are essential for calculating shipping costs and ensuring compliance with postal regulations. This trend is particularly relevant as the market is projected to grow to 16.7 USD Billion by 2035, driven by the increasing volume of online transactions and the need for precise weight measurements in logistics.

    Rising Demand for Precision Measurement

    The Global Electronic Weighing Scale Market Industry experiences a notable increase in demand for precision measurement across various sectors, including healthcare, retail, and manufacturing. As industries strive for accuracy in weight measurement, electronic scales provide enhanced reliability compared to traditional mechanical scales. This trend is particularly evident in the healthcare sector, where accurate weight measurements are critical for patient care. The market is projected to reach 9.24 USD Billion in 2024, reflecting a growing recognition of the importance of precision in weight measurement.

    Technological Advancements in Weighing Solutions

    Technological advancements significantly influence the Global Electronic Weighing Scale Market Industry, with innovations such as digital displays, connectivity features, and integration with software systems. These advancements enhance user experience and operational efficiency, making electronic scales more appealing to businesses. For instance, scales equipped with Bluetooth connectivity allow for seamless data transfer to inventory management systems, streamlining operations in retail and logistics. As technology continues to evolve, the market is expected to grow, with a projected CAGR of 5.52% from 2025 to 2035, indicating a robust future for electronic weighing solutions.

    Market Segment Insights

    Electronic Weighing Scale Type Insights

    <p>The Electronic Weighing Scale Market segmentation, based on type includes table top scale, platform scale, precision scale, pocket scale. In 2022, the table top scale segment held the largest market share and is predicted to account for more than 25% of the market. Electronic weighing scales for tables are portable, simple to use, affordable, durable, and small. The majority of the uses for these scales are in laboratories, pharmacies, cafes, restaurants, and retail settings.</p>

    <p>Figure1: Electronic Weighing Scale Market, by Type, 2022 &amp; 2032 (USD Billion)</p>

    <p>Source: Secondary Research, Primary Research, MRFR Database and Analyst Review</p>

    Electronic Weighing Scale End-User Insights

    <p>The Electronic Weighing Scale Market segmentation, based on end-use, includes industrial, veterinary, scientific/laboratory, jewelry, food &amp; beverages, health &amp; fitness, <a href="https://www.marketresearchfuture.com/reports/led-industrial-lighting-market-23883">industrial </a>and education. The industrial category is anticipated to account for more than 30% of the market. The usage of weighing scales is common in the export and import of various materials as well as the measurement of substances like caustic liquids and gases. During the production process, extreme accuracy is required. The usage of electronic weighing scales has become standard in the industrial setting.</p>

    <p>The three most common types of industrial electronic scales are platform scales, pallet truck scales, and tough industrial crane scales. Due to their long-term applicability and durability, electronic weighing scales are now widely used in the industrial sector, which has influenced the industry's ability to produce them.</p>

    Get more detailed insights about Electronic Weighing Scale Market Research Report – Global Forecast till 2035

    Regional Insights

    By region, the study provides the market insights into North America, Europe, Asia-Pacific and Rest of the World. The North American electronic weighing scale market area will dominate this market, owing to its big pharmaceutical sector, robust retail channel, and rising home demand for health monitoring. This previously mentioned element is a primary driver for the region's market.

    Further, the major countries studied in the market report are The US, Canada, German, France, the UK, Italy, Spain, China, Japan, India, Australia, South Korea, and Brazil.

    Figure2: Electronic Weighing Scale Market SHARE BY REGION 2022 (USD Billion)

    Electronic Weighing Scale Market SHARE BY REGION 2022

    Source: Secondary Research, Primary Research, MRFR Database and Analyst Review

    Europe electronic weighing scale market accounts for the second-largest market share due to the Rapid growth of large department and convenience businesses. Further, the German electronic weighing scale market held the largest market share, and the UK electronic weighing scale market was the fastest-growing market in the European region

    The Asia-Pacific Electronic Weighing Scale Market is expected to grow at the fastest CAGR from 2023 to 2032. This is due to the rising demand for electronic weighing devices in this region. Moreover, China’s electronic weighing scale market held the largest market share, and the Indian electronic weighing scale market was the fastest-growing market in the Asia-Pacific region.

    Key Players and Competitive Insights

    Leading market players are investing heavily in R&D to expand their product lines, which will help the electronic weighing scale market, grow even more. Market participants are also undertaking a variety of strategic activities to expand their global footprint, with important market developments including new product launches, contractual agreements, mergers and acquisitions, higher investments, and collaboration with other organizations. To expand and survive in a more competitive and rising market climate, electronic weighing scale industry must offer cost-effective items.

    Manufacturing locally to minimize operational costs is one of the key business tactics used by manufacturers in the global electronic weighing scale industry to benefit clients and increase the market sector. In recent years, the electronic weighing scale industry has offered some of the most significant advantages to medicine. Major players in the electronic weighing scale market, including Contech Instruments Ltd (India). Shinko Denshi Co., Ltd (Japan), Cardinal Scale Manufacturing Company (US) Doran Scales, Inc. (US), and Avery Weigh Tronix LLC (US) and others, are attempting to increase market demand by investing in R&D operations.

    Mettler Toledo is a worldwide scales and analytical instrument maker. It is the world's leading manufacturer of weighing devices for use in laboratories, industrial settings, and food commerce. Additionally, the company offers a variety of analytical equipment, process analytics devices, and end-of-line inspection systems. The corporation operates globally, with 70% of nett sales coming from Europe and the Americas in equal amounts. The remaining 30% is dedicated to Asian business. Mettler Toledo was founded in the United States and has its headquarters in Switzerland.

    In November 2021, Mettler-Toledo, a scale and analytical instrument manufacturer based in the United States, has introduced the BPA121 Portable Scale, an electronic weighing machine. It is a portable scale designed specifically for the food processing industries and is ideal for excessively damp settings. This product is meant to withstand moist and harsh conditions, and it provides excellent resistance to water penetration and humidity.

    Fairbanks, Morse, and Company was a late-nineteenth-century American manufacturing firm. Originally a manufacturer of weighing scales, it gradually expanded into pumps, engines, windmills, coffee grinders, radios, farm tractors, feed mills, locomotives, and industrial supplies before being purchased by Penn Texas in 1958. In 1823, inventor Thaddeus Fairbanks established an ironworks in St. Johnsbury, Vermont, to manufacture two of his patented inventions: a cast iron plough and a heating stove. He founded a hemp dressing business in 1829, for which he developed the machinery. In september 2019, Fairbanks scales introduced a new roller conveyor scale in October.

    This gadget can record the weights of products as they move down a conveyor scale. Fairbanks scales developed a new series called WF forklift scale in December with a distinctive design to meet the needs of the mobile weighing sector. This scale can transform forklifts into precision scales in minutes.

    Key Companies in the Electronic Weighing Scale Market market include

    Industry Developments

    September 2023: the Indian government launched a program to crack down on black market fraud in ration shops through e-POS weighing machines. It was intended to check weight tampering and alternatives to measuring. This initiative intends to eradicate the underground trade system.

    Italians espresso machine maker Victoria Arduino introduced VIS (Virtual Intelligent Scale) for use in its commercial espresso machines like Eagle One commercial espresso machines in July 2023. The firm has developed the VIS model to assist Eagle One Owners to have a relatively faster workflow than its previous version.

    Eufy, an Anker sub-brand, entered India with its Smart Weighing Scale C1 in December 2020. The unit is designed with smartphone connectivity, among other smart functions that help users monitor their health, record physical activity and achieve fitness goals. By syncing it to your EufyHome app on your phone, this scale will give you twelve different parameters such as Muscle Mass, Visceral Fat, Lean Body Mass etc.

    In June 2020, For applications requiring precision weighing, Mettler-Toledo has unveiled a new line of washdown-resistant checkweighers. This new series includes features including eliminating the risk of bacterial contamination, slanted surfaces to prevent debris and liquid buildup, and easily removable conveyor belts for effective cleaning.


    Future Outlook

    Electronic Weighing Scale Market Future Outlook

    <p>The Electronic Weighing Scale Market is projected to grow at a 5.51% CAGR from 2025 to 2035, driven by technological advancements, increasing automation, and rising demand in various industries.</p>

    New opportunities lie in:

    • <p>Develop smart weighing solutions integrating IoT for real-time data analytics. Expand into emerging markets with tailored products for local industries. Invest in eco-friendly materials to enhance sustainability and attract environmentally conscious consumers.</p>

    <p>By 2035, the Electronic Weighing Scale Market is expected to achieve substantial growth, reflecting evolving consumer needs and technological innovations.</p>

    Market Segmentation

    Electronic Weighing Scale Regional Outlook

    • {""=>["US"
    • "Canada"]}
    • {""=>["Germany"
    • "France"
    • "UK"
    • "Italy"
    • "Spain"
    • "Rest of Europe"]}
    • {"Asia-Pacific"=>["China"
    • "Japan"
    • "India"
    • "Australia"
    • "South Korea"
    • "Rest of Asia-Pacific"]}
    • {"Rest of the World"=>["Middle East"
    • "Africa"
    • "Latin America"]}

    Electronic Weighing Scale Market By Type Outlook

    • Table Top Scale
    • Platform Scale
    • Precision Scale
    • Pocket Scale

    Electronic Weighing Scale Market By End-User Vertical Outlook

    • Industrial
    • Veterinary
    • Scientific/Laboratory
    • Jewelry
    • Food & Beverages
    • Health & Fitness
    • Education

    Report Scope

    Report Attribute/Metric Details
    Market Size 2024 USD 9.24 Billion
    Market Size 2035 16.67 (Value (USD Billion))
    Compound Annual Growth Rate (CAGR) 5.51% (2025 - 2035)
    Base Year 2024
    Market Forecast Period 2025 - 2035
    Historical Data 2018- 2022
    Market Forecast Units Value (USD Billion)
    Report Coverage Revenue Forecast, Market Competitive Landscape, Growth Factors, and Trends
    Segments Covered Type, End-Usee, and Region
    Geographies Covered North America, Europe, Asia Pacific, and the Rest of the World
    Countries Covered The US, Canada, German, France, the UK, Italy, Spain, China, Japan, India, Australia, South Korea, and Brazil
    Key Companies Profiled  Tanita Corporation (Japan), A&D Company, Limited (US), Fairbanks Scales (US), Adam Equipment (UK). Essae-Teraoka Pvt. Ltd. (India), KERN & SOHN GmbH (Germany), Mettler Torado (US), Contech Instruments Ltd (India). Shinko Denshi Co., Ltd (Japan), Cardinal Scale Manufacturing Company (US) Doran Scales, Inc. (US), and Avery Weigh Tronix LLC (US).
    Key Market Opportunities The availability of adequate technical competence and a high concentration of market actors.
    Key Market Dynamics Rapid implementation of electronic weighing scales in retail and jewellery stores.
    Market Size 2025 9.75 (Value (USD Billion))

    FAQs

    How much is the electronic weighing scale market?

    The Electronic Weighing Scale Market size was valued at USD 9.24 billion in 2024.

    What is the growth rate of the electronic weighing scale market?

    The global market is projected to grow at a CAGR of 5.51% during the forecast period, 2025 to 2035.

    Which region held the largest market share in the electronic weighing scale market?

    North America had the largest share in the global market

    Who are the key players in the electronic weighing scale market?

    The key players in the market are Contech Instruments Ltd (India). Shinko Denshi Co., Ltd (Japan), Cardinal Scale Manufacturing Company (US) Doran Scales, Inc. (US), and Avery Weigh Tronix LLC (US).

    Which end-user led the electronic weighing scale market?

    The industrial category dominated the market in 2022.

    1. SECTION I: EXECUTIVE SUMMARY AND KEY HIGHLIGHTS
      1. | 1.1 EXECUTIVE SUMMARY
      2. | | 1.1.1 Market Overview
      3. | | 1.1.2 Key Findings
      4. | | 1.1.3 Market Segmentation
      5. | | 1.1.4 Competitive Landscape
      6. | | 1.1.5 Challenges and Opportunities
      7. | | 1.1.6 Future Outlook
    2. SECTION II: SCOPING, METHODOLOGY AND MARKET STRUCTURE
      1. | 2.1 MARKET INTRODUCTION
      2. | | 2.1.1 Definition
      3. | | 2.1.2 Scope of the study
      4. | | | 2.1.2.1 Research Objective
      5. | | | 2.1.2.2 Assumption
      6. | | | 2.1.2.3 Limitations
      7. | 2.2 RESEARCH METHODOLOGY
      8. | | 2.2.1 Overview
      9. | | 2.2.2 Data Mining
      10. | | 2.2.3 Secondary Research
      11. | | 2.2.4 Primary Research
      12. | | | 2.2.4.1 Primary Interviews and Information Gathering Process
      13. | | | 2.2.4.2 Breakdown of Primary Respondents
      14. | | 2.2.5 Forecasting Model
      15. | | 2.2.6 Market Size Estimation
      16. | | | 2.2.6.1 Bottom-Up Approach
      17. | | | 2.2.6.2 Top-Down Approach
      18. | | 2.2.7 Data Triangulation
      19. | | 2.2.8 Validation
    3. SECTION III: QUALITATIVE ANALYSIS
      1. | 3.1 MARKET DYNAMICS
      2. | | 3.1.1 Overview
      3. | | 3.1.2 Drivers
      4. | | 3.1.3 Restraints
      5. | | 3.1.4 Opportunities
      6. | 3.2 MARKET FACTOR ANALYSIS
      7. | | 3.2.1 Value chain Analysis
      8. | | 3.2.2 Porter's Five Forces Analysis
      9. | | | 3.2.2.1 Bargaining Power of Suppliers
      10. | | | 3.2.2.2 Bargaining Power of Buyers
      11. | | | 3.2.2.3 Threat of New Entrants
      12. | | | 3.2.2.4 Threat of Substitutes
      13. | | | 3.2.2.5 Intensity of Rivalry
      14. | | 3.2.3 COVID-19 Impact Analysis
      15. | | | 3.2.3.1 Market Impact Analysis
      16. | | | 3.2.3.2 Regional Impact
      17. | | | 3.2.3.3 Opportunity and Threat Analysis
    4. SECTION IV: QUANTITATIVE ANALYSIS
      1. | 4.1 Semiconductor & Electronics, BY Type (USD Billion)
      2. | | 4.1.1 Table Top Scale
      3. | | 4.1.2 Platform Scale
      4. | | 4.1.3 Precision Scale
      5. | | 4.1.4 Pocket Scale
      6. | 4.2 Semiconductor & Electronics, BY End-User (USD Billion)
      7. | | 4.2.1 Industrial
      8. | | 4.2.2 Veterinary
      9. | | 4.2.3 Scientific/Laboratory
      10. | | 4.2.4 Jewelry
      11. | | 4.2.5 Food & Beverages
      12. | | 4.2.6 Health & Fitness
      13. | | 4.2.7 Education
      14. | 4.3 Semiconductor & Electronics, BY Region (USD Billion)
      15. | | 4.3.1 North America
      16. | | | 4.3.1.1 US
      17. | | | 4.3.1.2 Canada
      18. | | 4.3.2 Europe
      19. | | | 4.3.2.1 Germany
      20. | | | 4.3.2.2 UK
      21. | | | 4.3.2.3 France
      22. | | | 4.3.2.4 Russia
      23. | | | 4.3.2.5 Italy
      24. | | | 4.3.2.6 Spain
      25. | | | 4.3.2.7 Rest of Europe
      26. | | 4.3.3 APAC
      27. | | | 4.3.3.1 China
      28. | | | 4.3.3.2 India
      29. | | | 4.3.3.3 Japan
      30. | | | 4.3.3.4 South Korea
      31. | | | 4.3.3.5 Malaysia
      32. | | | 4.3.3.6 Thailand
      33. | | | 4.3.3.7 Indonesia
      34. | | | 4.3.3.8 Rest of APAC
      35. | | 4.3.4 South America
      36. | | | 4.3.4.1 Brazil
      37. | | | 4.3.4.2 Mexico
      38. | | | 4.3.4.3 Argentina
      39. | | | 4.3.4.4 Rest of South America
      40. | | 4.3.5 MEA
      41. | | | 4.3.5.1 GCC Countries
      42. | | | 4.3.5.2 South Africa
      43. | | | 4.3.5.3 Rest of MEA
    5. SECTION V: COMPETITIVE ANALYSIS
      1. | 5.1 Competitive Landscape
      2. | | 5.1.1 Overview
      3. | | 5.1.2 Competitive Analysis
      4. | | 5.1.3 Market share Analysis
      5. | | 5.1.4 Major Growth Strategy in the Semiconductor & Electronics
      6. | | 5.1.5 Competitive Benchmarking
      7. | | 5.1.6 Leading Players in Terms of Number of Developments in the Semiconductor & Electronics
      8. | | 5.1.7 Key developments and growth strategies
      9. | | | 5.1.7.1 New Product Launch/Service Deployment
      10. | | | 5.1.7.2 Merger & Acquisitions
      11. | | | 5.1.7.3 Joint Ventures
      12. | | 5.1.8 Major Players Financial Matrix
      13. | | | 5.1.8.1 Sales and Operating Income
      14. | | | 5.1.8.2 Major Players R&D Expenditure. 2023
      15. | 5.2 Company Profiles
      16. | | 5.2.1 Mettler Toledo (CH)
      17. | | | 5.2.1.1 Financial Overview
      18. | | | 5.2.1.2 Products Offered
      19. | | | 5.2.1.3 Key Developments
      20. | | | 5.2.1.4 SWOT Analysis
      21. | | | 5.2.1.5 Key Strategies
      22. | | 5.2.2 A&D Company (JP)
      23. | | | 5.2.2.1 Financial Overview
      24. | | | 5.2.2.2 Products Offered
      25. | | | 5.2.2.3 Key Developments
      26. | | | 5.2.2.4 SWOT Analysis
      27. | | | 5.2.2.5 Key Strategies
      28. | | 5.2.3 Ohaus Corporation (US)
      29. | | | 5.2.3.1 Financial Overview
      30. | | | 5.2.3.2 Products Offered
      31. | | | 5.2.3.3 Key Developments
      32. | | | 5.2.3.4 SWOT Analysis
      33. | | | 5.2.3.5 Key Strategies
      34. | | 5.2.4 Sartorius AG (DE)
      35. | | | 5.2.4.1 Financial Overview
      36. | | | 5.2.4.2 Products Offered
      37. | | | 5.2.4.3 Key Developments
      38. | | | 5.2.4.4 SWOT Analysis
      39. | | | 5.2.4.5 Key Strategies
      40. | | 5.2.5 Bizerba GmbH (DE)
      41. | | | 5.2.5.1 Financial Overview
      42. | | | 5.2.5.2 Products Offered
      43. | | | 5.2.5.3 Key Developments
      44. | | | 5.2.5.4 SWOT Analysis
      45. | | | 5.2.5.5 Key Strategies
      46. | | 5.2.6 Adam Equipment (GB)
      47. | | | 5.2.6.1 Financial Overview
      48. | | | 5.2.6.2 Products Offered
      49. | | | 5.2.6.3 Key Developments
      50. | | | 5.2.6.4 SWOT Analysis
      51. | | | 5.2.6.5 Key Strategies
      52. | | 5.2.7 CAS Corporation (KR)
      53. | | | 5.2.7.1 Financial Overview
      54. | | | 5.2.7.2 Products Offered
      55. | | | 5.2.7.3 Key Developments
      56. | | | 5.2.7.4 SWOT Analysis
      57. | | | 5.2.7.5 Key Strategies
      58. | | 5.2.8 Rice Lake Weighing Systems (US)
      59. | | | 5.2.8.1 Financial Overview
      60. | | | 5.2.8.2 Products Offered
      61. | | | 5.2.8.3 Key Developments
      62. | | | 5.2.8.4 SWOT Analysis
      63. | | | 5.2.8.5 Key Strategies
      64. | | 5.2.9 Kern & Sohn GmbH (DE)
      65. | | | 5.2.9.1 Financial Overview
      66. | | | 5.2.9.2 Products Offered
      67. | | | 5.2.9.3 Key Developments
      68. | | | 5.2.9.4 SWOT Analysis
      69. | | | 5.2.9.5 Key Strategies
      70. | 5.3 Appendix
      71. | | 5.3.1 References
      72. | | 5.3.2 Related Reports
    6. LIST OF FIGURES
      1. | 6.1 MARKET SYNOPSIS
      2. | 6.2 NORTH AMERICA MARKET ANALYSIS
      3. | 6.3 US MARKET ANALYSIS BY TYPE
      4. | 6.4 US MARKET ANALYSIS BY END-USER
      5. | 6.5 CANADA MARKET ANALYSIS BY TYPE
      6. | 6.6 CANADA MARKET ANALYSIS BY END-USER
      7. | 6.7 EUROPE MARKET ANALYSIS
      8. | 6.8 GERMANY MARKET ANALYSIS BY TYPE
      9. | 6.9 GERMANY MARKET ANALYSIS BY END-USER
      10. | 6.10 UK MARKET ANALYSIS BY TYPE
      11. | 6.11 UK MARKET ANALYSIS BY END-USER
      12. | 6.12 FRANCE MARKET ANALYSIS BY TYPE
      13. | 6.13 FRANCE MARKET ANALYSIS BY END-USER
      14. | 6.14 RUSSIA MARKET ANALYSIS BY TYPE
      15. | 6.15 RUSSIA MARKET ANALYSIS BY END-USER
      16. | 6.16 ITALY MARKET ANALYSIS BY TYPE
      17. | 6.17 ITALY MARKET ANALYSIS BY END-USER
      18. | 6.18 SPAIN MARKET ANALYSIS BY TYPE
      19. | 6.19 SPAIN MARKET ANALYSIS BY END-USER
      20. | 6.20 REST OF EUROPE MARKET ANALYSIS BY TYPE
      21. | 6.21 REST OF EUROPE MARKET ANALYSIS BY END-USER
      22. | 6.22 APAC MARKET ANALYSIS
      23. | 6.23 CHINA MARKET ANALYSIS BY TYPE
      24. | 6.24 CHINA MARKET ANALYSIS BY END-USER
      25. | 6.25 INDIA MARKET ANALYSIS BY TYPE
      26. | 6.26 INDIA MARKET ANALYSIS BY END-USER
      27. | 6.27 JAPAN MARKET ANALYSIS BY TYPE
      28. | 6.28 JAPAN MARKET ANALYSIS BY END-USER
      29. | 6.29 SOUTH KOREA MARKET ANALYSIS BY TYPE
      30. | 6.30 SOUTH KOREA MARKET ANALYSIS BY END-USER
      31. | 6.31 MALAYSIA MARKET ANALYSIS BY TYPE
      32. | 6.32 MALAYSIA MARKET ANALYSIS BY END-USER
      33. | 6.33 THAILAND MARKET ANALYSIS BY TYPE
      34. | 6.34 THAILAND MARKET ANALYSIS BY END-USER
      35. | 6.35 INDONESIA MARKET ANALYSIS BY TYPE
      36. | 6.36 INDONESIA MARKET ANALYSIS BY END-USER
      37. | 6.37 REST OF APAC MARKET ANALYSIS BY TYPE
      38. | 6.38 REST OF APAC MARKET ANALYSIS BY END-USER
      39. | 6.39 SOUTH AMERICA MARKET ANALYSIS
      40. | 6.40 BRAZIL MARKET ANALYSIS BY TYPE
      41. | 6.41 BRAZIL MARKET ANALYSIS BY END-USER
      42. | 6.42 MEXICO MARKET ANALYSIS BY TYPE
      43. | 6.43 MEXICO MARKET ANALYSIS BY END-USER
      44. | 6.44 ARGENTINA MARKET ANALYSIS BY TYPE
      45. | 6.45 ARGENTINA MARKET ANALYSIS BY END-USER
      46. | 6.46 REST OF SOUTH AMERICA MARKET ANALYSIS BY TYPE
      47. | 6.47 REST OF SOUTH AMERICA MARKET ANALYSIS BY END-USER
      48. | 6.48 MEA MARKET ANALYSIS
      49. | 6.49 GCC COUNTRIES MARKET ANALYSIS BY TYPE
      50. | 6.50 GCC COUNTRIES MARKET ANALYSIS BY END-USER
      51. | 6.51 SOUTH AFRICA MARKET ANALYSIS BY TYPE
      52. | 6.52 SOUTH AFRICA MARKET ANALYSIS BY END-USER
      53. | 6.53 REST OF MEA MARKET ANALYSIS BY TYPE
      54. | 6.54 REST OF MEA MARKET ANALYSIS BY END-USER
      55. | 6.55 KEY BUYING CRITERIA OF SEMICONDUCTOR & ELECTRONICS
      56. | 6.56 RESEARCH PROCESS OF MRFR
      57. | 6.57 DRO ANALYSIS OF SEMICONDUCTOR & ELECTRONICS
      58. | 6.58 DRIVERS IMPACT ANALYSIS: SEMICONDUCTOR & ELECTRONICS
      59. | 6.59 RESTRAINTS IMPACT ANALYSIS: SEMICONDUCTOR & ELECTRONICS
      60. | 6.60 SUPPLY / VALUE CHAIN: SEMICONDUCTOR & ELECTRONICS
      61. | 6.61 SEMICONDUCTOR & ELECTRONICS, BY TYPE, 2024 (% SHARE)
      62. | 6.62 SEMICONDUCTOR & ELECTRONICS, BY TYPE, 2024 TO 2035 (USD Billion)
      63. | 6.63 SEMICONDUCTOR & ELECTRONICS, BY END-USER, 2024 (% SHARE)
      64. | 6.64 SEMICONDUCTOR & ELECTRONICS, BY END-USER, 2024 TO 2035 (USD Billion)
      65. | 6.65 BENCHMARKING OF MAJOR COMPETITORS
    7. LIST OF TABLES
      1. | 7.1 LIST OF ASSUMPTIONS
      2. | | 7.1.1
      3. | 7.2 North America MARKET SIZE ESTIMATES; FORECAST
      4. | | 7.2.1 BY TYPE, 2025-2035 (USD Billion)
      5. | | 7.2.2 BY END-USER, 2025-2035 (USD Billion)
      6. | 7.3 US MARKET SIZE ESTIMATES; FORECAST
      7. | | 7.3.1 BY TYPE, 2025-2035 (USD Billion)
      8. | | 7.3.2 BY END-USER, 2025-2035 (USD Billion)
      9. | 7.4 Canada MARKET SIZE ESTIMATES; FORECAST
      10. | | 7.4.1 BY TYPE, 2025-2035 (USD Billion)
      11. | | 7.4.2 BY END-USER, 2025-2035 (USD Billion)
      12. | 7.5 Europe MARKET SIZE ESTIMATES; FORECAST
      13. | | 7.5.1 BY TYPE, 2025-2035 (USD Billion)
      14. | | 7.5.2 BY END-USER, 2025-2035 (USD Billion)
      15. | 7.6 Germany MARKET SIZE ESTIMATES; FORECAST
      16. | | 7.6.1 BY TYPE, 2025-2035 (USD Billion)
      17. | | 7.6.2 BY END-USER, 2025-2035 (USD Billion)
      18. | 7.7 UK MARKET SIZE ESTIMATES; FORECAST
      19. | | 7.7.1 BY TYPE, 2025-2035 (USD Billion)
      20. | | 7.7.2 BY END-USER, 2025-2035 (USD Billion)
      21. | 7.8 France MARKET SIZE ESTIMATES; FORECAST
      22. | | 7.8.1 BY TYPE, 2025-2035 (USD Billion)
      23. | | 7.8.2 BY END-USER, 2025-2035 (USD Billion)
      24. | 7.9 Russia MARKET SIZE ESTIMATES; FORECAST
      25. | | 7.9.1 BY TYPE, 2025-2035 (USD Billion)
      26. | | 7.9.2 BY END-USER, 2025-2035 (USD Billion)
      27. | 7.10 Italy MARKET SIZE ESTIMATES; FORECAST
      28. | | 7.10.1 BY TYPE, 2025-2035 (USD Billion)
      29. | | 7.10.2 BY END-USER, 2025-2035 (USD Billion)
      30. | 7.11 Spain MARKET SIZE ESTIMATES; FORECAST
      31. | | 7.11.1 BY TYPE, 2025-2035 (USD Billion)
      32. | | 7.11.2 BY END-USER, 2025-2035 (USD Billion)
      33. | 7.12 Rest of Europe MARKET SIZE ESTIMATES; FORECAST
      34. | | 7.12.1 BY TYPE, 2025-2035 (USD Billion)
      35. | | 7.12.2 BY END-USER, 2025-2035 (USD Billion)
      36. | 7.13 APAC MARKET SIZE ESTIMATES; FORECAST
      37. | | 7.13.1 BY TYPE, 2025-2035 (USD Billion)
      38. | | 7.13.2 BY END-USER, 2025-2035 (USD Billion)
      39. | 7.14 China MARKET SIZE ESTIMATES; FORECAST
      40. | | 7.14.1 BY TYPE, 2025-2035 (USD Billion)
      41. | | 7.14.2 BY END-USER, 2025-2035 (USD Billion)
      42. | 7.15 India MARKET SIZE ESTIMATES; FORECAST
      43. | | 7.15.1 BY TYPE, 2025-2035 (USD Billion)
      44. | | 7.15.2 BY END-USER, 2025-2035 (USD Billion)
      45. | 7.16 Japan MARKET SIZE ESTIMATES; FORECAST
      46. | | 7.16.1 BY TYPE, 2025-2035 (USD Billion)
      47. | | 7.16.2 BY END-USER, 2025-2035 (USD Billion)
      48. | 7.17 South Korea MARKET SIZE ESTIMATES; FORECAST
      49. | | 7.17.1 BY TYPE, 2025-2035 (USD Billion)
      50. | | 7.17.2 BY END-USER, 2025-2035 (USD Billion)
      51. | 7.18 Malaysia MARKET SIZE ESTIMATES; FORECAST
      52. | | 7.18.1 BY TYPE, 2025-2035 (USD Billion)
      53. | | 7.18.2 BY END-USER, 2025-2035 (USD Billion)
      54. | 7.19 Thailand MARKET SIZE ESTIMATES; FORECAST
      55. | | 7.19.1 BY TYPE, 2025-2035 (USD Billion)
      56. | | 7.19.2 BY END-USER, 2025-2035 (USD Billion)
      57. | 7.20 Indonesia MARKET SIZE ESTIMATES; FORECAST
      58. | | 7.20.1 BY TYPE, 2025-2035 (USD Billion)
      59. | | 7.20.2 BY END-USER, 2025-2035 (USD Billion)
      60. | 7.21 Rest of APAC MARKET SIZE ESTIMATES; FORECAST
      61. | | 7.21.1 BY TYPE, 2025-2035 (USD Billion)
      62. | | 7.21.2 BY END-USER, 2025-2035 (USD Billion)
      63. | 7.22 South America MARKET SIZE ESTIMATES; FORECAST
      64. | | 7.22.1 BY TYPE, 2025-2035 (USD Billion)
      65. | | 7.22.2 BY END-USER, 2025-2035 (USD Billion)
      66. | 7.23 Brazil MARKET SIZE ESTIMATES; FORECAST
      67. | | 7.23.1 BY TYPE, 2025-2035 (USD Billion)
      68. | | 7.23.2 BY END-USER, 2025-2035 (USD Billion)
      69. | 7.24 Mexico MARKET SIZE ESTIMATES; FORECAST
      70. | | 7.24.1 BY TYPE, 2025-2035 (USD Billion)
      71. | | 7.24.2 BY END-USER, 2025-2035 (USD Billion)
      72. | 7.25 Argentina MARKET SIZE ESTIMATES; FORECAST
      73. | | 7.25.1 BY TYPE, 2025-2035 (USD Billion)
      74. | | 7.25.2 BY END-USER, 2025-2035 (USD Billion)
      75. | 7.26 Rest of South America MARKET SIZE ESTIMATES; FORECAST
      76. | | 7.26.1 BY TYPE, 2025-2035 (USD Billion)
      77. | | 7.26.2 BY END-USER, 2025-2035 (USD Billion)
      78. | 7.27 MEA MARKET SIZE ESTIMATES; FORECAST
      79. | | 7.27.1 BY TYPE, 2025-2035 (USD Billion)
      80. | | 7.27.2 BY END-USER, 2025-2035 (USD Billion)
      81. | 7.28 GCC Countries MARKET SIZE ESTIMATES; FORECAST
      82. | | 7.28.1 BY TYPE, 2025-2035 (USD Billion)
      83. | | 7.28.2 BY END-USER, 2025-2035 (USD Billion)
      84. | 7.29 South Africa MARKET SIZE ESTIMATES; FORECAST
      85. | | 7.29.1 BY TYPE, 2025-2035 (USD Billion)
      86. | | 7.29.2 BY END-USER, 2025-2035 (USD Billion)
      87. | 7.30 Rest of MEA MARKET SIZE ESTIMATES; FORECAST
      88. | | 7.30.1 BY TYPE, 2025-2035 (USD Billion)
      89. | | 7.30.2 BY END-USER, 2025-2035 (USD Billion)
      90. | 7.31 PRODUCT LAUNCH/PRODUCT DEVELOPMENT/APPROVAL
      91. | | 7.31.1
      92. | 7.32 ACQUISITION/PARTNERSHIP
      93. | | 7.32.1

    Electronic Weighing Scale Market Segmentation

    Electronic Weighing Scale Market By Type Outlook (USD Billion, 2018-2032)

    Table Top Scale

    Platform Scale

    Precision Scale

    Pocket Scale

    Electronic Weighing Scale Market By End-User Vertical Outlook (USD Billion, 2018-2032)

    Industrial

    Veterinary

    Scientific/Laboratory

    Jewelry

    Food & Beverages

    Health & Fitness

    Industrial

    Education

    Electronic Weighing Scale Market Regional Outlook (USD Billion, 2018-2032)

    North America Outlook (USD Billion, 2018-2032)

    North America Electronic Weighing Scale Market by By Type

    Table Top Scale

    Platform Scale

    Precision Scale

    Pocket Scale

    North America Electronic Weighing Scale Market by By End-User Vertical

    Industrial

    Veterinary

    Scientific/Laboratory

    Jewelry

    Food & Beverages

    Health & Fitness

    Industrial

    Education

    US Outlook (USD Billion, 2018-2032)

    US Electronic Weighing Scale Market by By Type

    Table Top Scale

    Platform Scale

    Precision Scale

    Pocket Scale

    US Electronic Weighing Scale Market by By End-User Vertical

    Industrial

    Veterinary

    Scientific/Laboratory

    Jewelry

    Food & Beverages

    Health & Fitness

    Industrial

    Education

    CANADA Outlook (USD Billion, 2018-2032)

    CANADA Electronic Weighing Scale Market by By Type

    Table Top Scale

    Platform Scale

    Precision Scale

    Pocket Scale

    CANADA Electronic Weighing Scale Market by By End-User Vertical

    Industrial

    Veterinary

    Scientific/Laboratory

    Jewelry

    Food & Beverages

    Health & Fitness

    Industrial

    Education

    Europe Outlook (USD Billion, 2018-2032)

    Europe Electronic Weighing Scale Market by By Type

    Table Top Scale

    Platform Scale

    Precision Scale

    Pocket Scale

    Europe Electronic Weighing Scale Market by By End-User Vertical

    Industrial

    Veterinary

    Scientific/Laboratory

    Jewelry

    Food & Beverages

    Health & Fitness

    Industrial

    Education

    Germany Outlook (USD Billion, 2018-2032)

    Germany Electronic Weighing Scale Market by By Type

    Table Top Scale

    Platform Scale

    Precision Scale

    Pocket Scale

    Germany Electronic Weighing Scale Market by By End-User Vertical

    Industrial

    Veterinary

    Scientific/Laboratory

    Jewelry

    Food & Beverages

    Health & Fitness

    Industrial

    Education

    France Outlook (USD Billion, 2018-2032)

    France Electronic Weighing Scale Market by By Type

    Table Top Scale

    Platform Scale

    Precision Scale

    Pocket Scale

    France Electronic Weighing Scale Market by By End-User Vertical

    Industrial

    Veterinary

    Scientific/Laboratory

    Jewelry

    Food & Beverages

    Health & Fitness

    Industrial

    Education

    UK Outlook (USD Billion, 2018-2032)

    UK Electronic Weighing Scale Market by By Type

    Table Top Scale

    Platform Scale

    Precision Scale

    Pocket Scale

    UK Electronic Weighing Scale Market by By End-User Vertical

    Industrial

    Veterinary

    Scientific/Laboratory

    Jewelry

    Food & Beverages

    Health & Fitness

    Industrial

    Education

    ITALY Outlook (USD Billion, 2018-2032)

    ITALY Electronic Weighing Scale Market by By Type

    Table Top Scale

    Platform Scale

    Precision Scale

    Pocket Scale

    ITALY Electronic Weighing Scale Market by By End-User Vertical

    Industrial

    Veterinary

    Scientific/Laboratory

    Jewelry

    Food & Beverages

    Health & Fitness

    Industrial

    Education

    SPAIN Outlook (USD Billion, 2018-2032)

    Spain Electronic Weighing Scale Market by By Type

    Table Top Scale

    Platform Scale

    Precision Scale

    Pocket Scale

    Spain Electronic Weighing Scale Market by By End-User Vertical

    Industrial

    Veterinary

    Scientific/Laboratory

    Jewelry

    Food & Beverages

    Health & Fitness

    Industrial

    Education

    Rest Of Europe Outlook (USD Billion, 2018-2032)

    Rest Of Europe Electronic Weighing Scale Market by By Type

    Table Top Scale

    Platform Scale

    Precision Scale

    Pocket Scale

    REST OF EUROPE Electronic Weighing Scale Market by By End-User Vertical

    Industrial

    Veterinary

    Scientific/Laboratory

    Jewelry

    Food & Beverages

    Health & Fitness

    Industrial

    Education

    Asia-Pacific Outlook (USD Billion, 2018-2032)

    Asia-Pacific Electronic Weighing Scale Market by By Type

    Table Top Scale

    Platform Scale

    Precision Scale

    Pocket Scale

    Asia-Pacific Electronic Weighing Scale Market by By End-User Vertical

    Industrial

    Veterinary

    Scientific/Laboratory

    Jewelry

    Food & Beverages

    Health & Fitness

    Industrial

    Education

    China Outlook (USD Billion, 2018-2032)

    China Electronic Weighing Scale Market by By Type

    Table Top Scale

    Platform Scale

    Precision Scale

    Pocket Scale

    China Electronic Weighing Scale Market by By End-User Vertical

    Industrial

    Veterinary

    Scientific/Laboratory

    Jewelry

    Food & Beverages

    Health & Fitness

    Industrial

    Education

    Japan Outlook (USD Billion, 2018-2032)

    Japan Electronic Weighing Scale Market by By Type

    Table Top Scale

    Platform Scale

    Precision Scale

    Pocket Scale

    Japan Electronic Weighing Scale Market by By End-User Vertical

    Industrial

    Veterinary

    Scientific/Laboratory

    Jewelry

    Food & Beverages

    Health & Fitness

    Industrial

    Education

    India Outlook (USD Billion, 2018-2032)

    India Electronic Weighing Scale Market by By Type

    Table Top Scale

    Platform Scale

    Precision Scale

    Pocket Scale

    India Electronic Weighing Scale Market by By End-User Vertical

    Industrial

    Veterinary

    Scientific/Laboratory

    Jewelry

    Food & Beverages

    Health & Fitness

    Industrial

    Education

    Australia Outlook (USD Billion, 2018-2032)

    Australia Electronic Weighing Scale Market by By Type

    Table Top Scale

    Platform Scale

    Precision Scale

    Pocket Scale

    Australia Electronic Weighing Scale Market by By End-User Vertical

    Industrial

    Veterinary

    Scientific/Laboratory

    Jewelry

    Food & Beverages

    Health & Fitness

    Industrial

    Education

    Rest of Asia-Pacific Outlook (USD Billion, 2018-2032)

    Rest of Asia-Pacific Electronic Weighing Scale Market by By Type

    Table Top Scale

    Platform Scale

    Precision Scale

    Pocket Scale

    Rest of Asia-Pacific Electronic Weighing Scale Market by By End-User Vertical

    Industrial

    Veterinary

    Scientific/Laboratory

    Jewelry

    Food & Beverages

    Health & Fitness

    Industrial

    Education

    Rest of the World Outlook (USD Billion, 2018-2032)

    Rest of the World Electronic Weighing Scale Market by By Type

    Table Top Scale

    Platform Scale

    Precision Scale

    Pocket Scale

    Rest of the World Electronic Weighing Scale Market by By End-User Vertical

    Industrial

    Veterinary

    Scientific/Laboratory

    Jewelry

    Food & Beverages

    Health & Fitness

    Industrial

    Education

    Middle East Outlook (USD Billion, 2018-2032)

    Middle East Electronic Weighing Scale Market by By Type

    Table Top Scale

    Platform Scale

    Precision Scale

    Pocket Scale

    Middle East Electronic Weighing Scale Market by By End-User Vertical

    Industrial

    Veterinary

    Scientific/Laboratory

    Jewelry

    Food & Beverages

    Health & Fitness

    Industrial

    Education

    Africa Outlook (USD Billion, 2018-2032)

    Africa Electronic Weighing Scale Market by By Type

    Table Top Scale

    Platform Scale

    Precision Scale

    Pocket Scale

    Africa Electronic Weighing Scale Market by By End-User Vertical

    Industrial

    Veterinary

    Scientific/Laboratory

    Jewelry

    Food & Beverages

    Health & Fitness

    Industrial

    Education

    Latin America Outlook (USD Billion, 2018-2032)

    Latin America Electronic Weighing Scale Market by By Type

    Table Top Scale

    Platform Scale

    Precision Scale

    Pocket Scale

    Latin America Electronic Weighing Scale Market by By End-User Vertical

    Industrial

    Veterinary

    Scientific/Laboratory

    Jewelry

    Food & Beverages

    Health & Fitness

    Industrial

    Education

    Infographic

    Free Sample Request

    Kindly complete the form below to receive a free sample of this Report

    Get Free Sample

    Customer Strories

    “I am very pleased with how market segments have been defined in a relevant way for my purposes (such as "Portable Freezers & refrigerators" and "last-mile"). In general the report is well structured. Thanks very much for your efforts.”

    Victoria Milne

    Founder
    Case Study
    Chemicals and Materials

    Compare Licence

    ×
    Features License Type
    Single User Multiuser License Enterprise User
    Price $4,950 $5,950 $7,250
    Maximum User Access Limit 1 User Upto 10 Users Unrestricted Access Throughout the Organization
    Free Customization
    Direct Access to Analyst
    Deliverable Format
    Platform Access
    Discount on Next Purchase 10% 15% 15%
    Printable Versions