info@marketresearchfuture.com   ๐Ÿ“ž +1 (855) 661-4441(US)   ๐Ÿ“ž +44 1720 412 167(UK)   ๐Ÿ“ž +91 2269738890(APAC)
Certified Global Research Member
Isomar 1 Iso 1
Key Questions Answered
  • Global Market Outlook
  • In-depth analysis of global and regional trends
  • Analyze and identify the major players in the market, their market share, key developments, etc.
  • To understand the capability of the major players based on products offered, financials, and strategies.
  • Identify disrupting products, companies, and trends.
  • To identify opportunities in the market.
  • Analyze the key challenges in the market.
  • Analyze the regional penetration of players, products, and services in the market.
  • Comparison of major players financial performance.
  • Evaluate strategies adopted by major players.
  • Recommendations
Why Choose Market Research Future?
  • Vigorous research methodologies for specific market.
  • Knowledge partners across the globe
  • Large network of partner consultants.
  • Ever-increasing/ Escalating data base with quarterly monitoring of various markets
  • Trusted by fortune 500 companies/startups/ universities/organizations
  • Large database of 5000+ markets reports.
  • Effective and prompt pre- and post-sales support.

Electric Vehicle Fast Charging System Market Research Report By Charging Type (DC Fast Charging, AC Charging, Semi-Fast Charging), By Connector Type (Type 1, Type 2, CHAdeMO, CCS, GB/T), By End User (Residential, Commercial, Public Infrastructure), By Power Output (Below 50 kW, 50 kW to 150 kW, Above 150 kW) and By Regional (North America, Europe, South America, Asia Pacific, Middle East and Africa)-Forecast to 2035


ID: MRFR/AM/9874-HCR | 200 Pages | Author: Sejal Akre| August 2025

Global Electric Vehicle Fast Charging System Market Overview

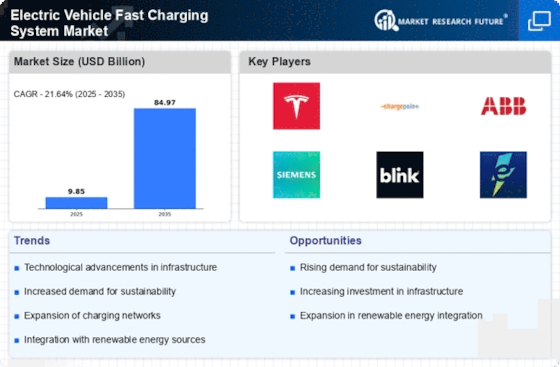
As per MRFR analysis, the Electric Vehicle Fast Charging System Market Size was estimated at 8.1 (USD Billion) in 2023.The Electric Vehicle Fast Charging System Market Industry is expected to grow from 9.85(USD Billion) in 2024 to 85 (USD Billion) by 2035. The Electric Vehicle Fast Charging System Market CAGR (growth rate) is expected to be around 21.64% during the forecast period (2025 - 2035).

Key Electric Vehicle Fast Charging System Market Trends Highlighted

Several important factors are driving the Electric Vehicle Fast Charging System Market to develop quickly. Governments are being forced to make regulations that encourage electric vehicles because people are becoming more mindful of the environment, and the world is working to lower greenhouse gas emissions.

Many nations are setting goals to switch to electric vehicles, which is making the need for fast-charging infrastructure even greater. Battery technology has also come a long way, and quicker charging makes electric cars more appealing, which makes more people want to convert from gas-powered automobiles.

There have also been new trends that stress the need for ultra-fast charging stations. These stations may cut down on charging periods by a lot, making electric cars more convenient for those who are used to the simplicity of refuelling petrol vehicles.

There are also new ways to change things, such as wireless charging solutions and mobile charging devices, which are slowly being included in city plans. This opens up a lot of possibilities, including building more charging stations in rural regions and making intercity charging networks better so that EV users can travel longer distances.

More and more, governments, manufacturers, and energy suppliers are working together to make the charging ecosystem better by making joint investments.

Partnerships may also collaborate on putting charging stations in public spaces, retail centers, and businesses to make them easier to get to. As cities across the world work to make transportation greener, there is still much room for development in the electric car rapid charging industry. This will help create a sustainable energy future and get more people to use electric vehicles.

Global Electric Vehicle Fast Charging System Market Overview

Source: Primary Research, Secondary Research, Market Research Future Database and Analyst Review

Growth in Electric Vehicle Adoption

The EV Fast Charging System Market Industry is witnessing a significant increase owing to the growing adoption of electric vehicles (EVs). Recent reports indicate that global electric vehicle sales exceeded 6.5 million units in 2021, marking a 108% increase compared to previous years.

Major automotive manufacturers like Tesla, Volkswagen, and BMW are heavily investing in electric vehicle production, which is supported by government policies encouraging the transition to electric mobility.

For instance, countries such as Norway have set ambitious targets where all new cars sold by 2025 should be zero-emission. This surge in EV production directly drives the demand for a robust fast charging infrastructure.

As the number of EVs on the road continues to rise, particularly in regions with favorable government incentives, increased fast charging capacity is critical, thus contributing to substantial market growth in the Electric Vehicle Fast Charging System Market Industry.

Government Initiatives and Support

Government initiatives worldwide play a pivotal role in augmenting the Electric Vehicle Fast Charging System Market Industry. Various national and regional governments are implementing regulations and incentives to promote faster adoption of EVs and their charging infrastructure.

For example, the United States has allocated billions through programs like the Bipartisan Infrastructure Law to expand the EV charging network nationwide, targeting to add 500,000 chargers by 2030.

Similarly, the European Union has aimed to deploy up to 1 million public charging points by 2025. This heightened government backing not only boosts consumer confidence in electric vehicles but also directly increases investment in fast charging technologies, paving the way for market growth.

Technological Advancements

Technological advancements in charging solutions significantly influence the Electric Vehicle Fast Charging System Market Industry. Innovations in charging technologies, including ultra-fast chargers and smart charging systems, are reducing charging time and enhancing user convenience.

Data from industry sources indicate that ultra-rapid charging technology can charge electric vehicles to 80% in just 15 minutes. Companies like ABB and Siemens are leading this technology evolution by developing cutting-edge fast charging systems with higher power outputs and greater efficiency.

As these technologies become more accessible, they are likely to facilitate the widespread adoption of electric vehicles, thereby driving demand in the Electric Vehicle Fast Charging System Market Industry.

Electric Vehicle Fast Charging System Market Segment Insights

Electric Vehicle Fast Charging System Market Type Insights

The Fast Charging System for Electric Vehicles Market demonstrates strong growth and segmentation across various charging types, reflecting the increasing demand for efficient and effective charging solutions. In 2024, the market for Charging Type is projected to be valued at 9.85 USD Billion, showcasing a robust potential across its categories.

A major segment within this market is DC Fast Charging, which holds a significant market share valued at 4.85 USD Billion in 2024 and is expected to expand to 40.0 USD Billion by 2035.This segment is vital due to its capability to recharge electric vehicles rapidly, accommodating the need for convenience and reduced downtime for users, hence driving its market growth.

Conversely, AC Charging presents a noteworthy valuation of 3.0 USD Billion in 2024, growing to 25.0 USD Billion by 2035. This type of charging is prevalent for home and workplace charging solutions, which contributes to its steady demand.

AC Charging plays a crucial role in the overall charging infrastructure, as it often serves as the first point of contact for electric vehicle users, providing essential support for daily driving routines.

Additionally, Semi-Fast Charging is also an engaging segment, valued at 2.0 USD Billion in 2024 and on track to reach 20.0 USD Billion by 2035. Although it holds the smallest market valuation among these types, its appeal in tiered charging solutions and dedicated usage in specific infrastructures make it relevant.

The overall landscape of the market showcases a fast-evolving industry characterized by advancing technologies and increasing investments. Governments across the globe are actively promoting the adoption of electric vehicles, laying down the groundwork for enhanced charging infrastructure, which in turn serves as a growth driver for all segments.

The expanding market is expected to face challenges such as the availability of charging stations and integration with existing energy systems, yet it equally presents numerous opportunities for innovation and expansion within the charging types.

The interplay between these segments not only highlights the diversity of offerings in the market but also emphasizes the critical need for efficient electric vehicle charging solutions in the transition toward a more sustainable transportation ecosystem. The valuable data surrounding the Electric Vehicle Fast Charging System Market segmentation showcases the promising landscape and its potential for future growth.

Electric Vehicle Fast Charging System Market Charging Type Insights

Source: Primary Research, Secondary Research, Market Research Future Database and Analyst Review

Electric Vehicle Fast Charging System Market Connector Type Insights

The Electric Vehicle Fast Charging System Market is witnessing significant growth, driven by the increasing adoption of electric vehicles and the rising demand for efficient charging solutions.

As of 2024, the overall market is expected to be valued at 9.85 USD Billion, showcasing the importance of Connector Type in facilitating the charging process. Connector Type in this market includes several key variations, such as Type 1, Type 2, CHAdeMO, CCS, and GB/T.

Among these, Type 2 and CCS are gaining traction globally due to their compatibility with a wide range of vehicles, which enhances user convenience and charging infrastructure development.Meanwhile, CHAdeMO, though dominant in specific regions, is increasingly facing competition as the industry leans towards standardized solutions.

The Electric Vehicle Fast Charging System Market segmentation reflects these dynamics, highlighting the need for diverse and efficient connectors to meet global consumer preferences and regulatory standards.

This market segment not only plays a pivotal role in enhancing charging speeds but also impacts the overall market growth, as countries aim to establish comprehensive charging networks to support the transition to electric mobility.

With the expected market statistics pointing to a valuation of 85.0 USD Billion by 2035, the Connector Type segment is set to remain integral to the overall industry expansion and technological advancements in fast charging solutions.

Electric Vehicle Fast Charging System Market End User Insights

The Electric Vehicle Fast Charging System Market is experiencing substantial growth, driven by diverse End User applications that include Residential, Commercial, and Public Infrastructure. By 2024, the overall market is expected to be valued at 9.85 USD Billion, reflecting a strong demand for fast charging solutions.

The Residential segment plays a crucial role, catering to electric vehicle owners who seek convenient charging solutions at home, which supports their daily commuting needs while enhancing the adoption of electric vehicles.

The Commercial segment is significant as businesses increasingly install fast charging stations to accommodate electric fleet operations and provide charging services to customers, thereby enhancing customer experience and satisfaction.

Public Infrastructure also dominates the market, with governments investing in the installation of fast charging networks to promote electric vehicle usage and reduce emissions, aligning with environmental goals.

As the market continues to evolve, these End User categories present opportunities and challenges, including the need for increased charging station availability, technological advancements, and strategies to integrate renewable energy sources into the charging process.

The strong momentum in the Electric Vehicle Fast Charging System Market indicates a clear pathway for achieving a sustainable and cleaner transportation future.

Electric Vehicle Fast Charging System Market Power Output Insights

The Electric Vehicle Fast Charging System Market is expanding significantly, with a projected value of 9.85 USD Billion in 2024 and a significant leap to 85.0 USD Billion by 2035. The market segmentation for power output reveals three primary categories, each catering to different consumer needs and technological capabilities.

The below 50 kW category offers basic charging solutions suitable for residential and urban settings, while the 50 kW to 150 kW range is more prevalent for commercial applications, allowing for faster turnover and shorter downtime.This segment is particularly essential for businesses aiming to enhance customer experiences while optimizing vehicle downtime.

The above 150 kW segment is at the forefront of technological advancement, supporting high-performance electric vehicles and facilitating long-distance travel by drastically reducing charging time. This growing demand reflects the increasing consumer preference for faster charging solutions in the market.

As the Electric Vehicle Fast Charging System Market continues to evolve, addressing the diverse requirements across these power output categories will be critical for growth and consumer satisfaction, driven by both technological innovation and a shift toward sustainable transportation solutions.

Electric Vehicle Fast Charging System Market Regional Insights

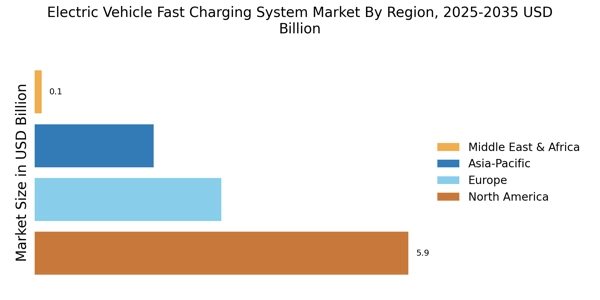
The Electric Vehicle Fast Charging System Market has shown significant growth across various regions, contributing to its overall value of 9.85 USD Billion in 2024. North America is a dominant player, with a valuation of 3.0 USD Billion in 2024, projected to reach 30.0 USD Billion by 2035.

This region benefits from robust infrastructure investments and strong governmental support for electric vehicle adoption. Europe follows closely, initially valued at 2.85 USD Billion in 2024 and growing to 28.5 USD Billion, influenced by stringent emissions regulations and a proactive approach towards sustainable transportation.

Meanwhile, Asia Pacific, valued at 3.5 USD Billion in 2024, is expected to reach 15.0 USD Billion, driven primarily by Chinaโ€™s aggressive market strategies for electric vehicles and related charging infrastructures.

South America, although currently smaller with 0.5 USD Billion in 2024, has the potential to grow significantly to 5.0 USD Billion due to increasing investments in renewable energy.

The Middle East and Africa, starting at a valuation of 0.99 USD Billion, is projected to grow to 6.5 USD Billion, as regional governments aim to diversify energy sources and reduce dependence on oil.

Each of these regions presents unique challenges and opportunities, as varying levels of infrastructure, governmental policies, and consumer acceptance shape the landscape of the Electric Vehicle Fast Charging System Market.

Electric Vehicle Fast Charging System Market Regional Insights

Source: Primary Research, Secondary Research, Market Research Future Database and Analyst Review

Electric Vehicle Fast Charging System Market Key Players and Competitive Insights

The Electric Vehicle Fast Charging System Market is witnessing unprecedented growth as the transition to sustainable transportation accelerates worldwide. Key trends influencing this market include increasing consumer demand for electric vehicles, supportive government policies, and advancements in charging technology.

As more players enter the market, competition is intensifying, driving innovation and efforts to establish robust charging infrastructure. Players are continually working on enhancing charging speed, reducing costs, and expanding networks to cater to the growing electric vehicle population.

Strategic collaborations, investments, and mergers are also commonplace as companies strive to secure a competitive edge in this dynamic landscape.

Electrify America holds an influential position in the Electric Vehicle Fast Charging System Market, leveraging its expansive network to cater to the increasing number of electric vehicle users. The company stands out for its widespread availability across key regions, ensuring that it meets the growing demand for fast charging solutions.ts commitment to sustainable energy, including the use of 100% renewable energy for charging stations, enhances its reputation as a market leader.

Furthermore, Electrify America's focus on innovation has led to the development of high-powered charging stations, allowing drivers to charge their vehicles quickly and efficiently. Their robust partnerships and investment in technology position them favorably within the competitive landscape, with a keen eye on expanding coverage to meet future needs.

BP is a significant player in the Electric Vehicle Fast Charging System Market, demonstrating commitment through the development and expansion of its charging infrastructure across various regions.

The company's strengths lie in its extensive experience in energy markets and its ability to leverage existing assets for the growth of electric vehicle charging solutions. BP focuses on offering a variety of key services that cater to both consumers and businesses, facilitating seamless charging experiences.

The company continues to explore mergers and acquisitions to enhance its capabilities in the fast-charging sector, thereby ensuring its adaptability in this rapidly evolving market. With its investment in state-of-the-art charging technology and strategic initiatives aimed at increasing market presence, BP aims to establish itself as a leading provider of electric vehicle fast charging solutions globally.

Key Companies in the Electric Vehicle Fast Charging System Market Include

  • Electrify America
  • BP
  • Tritium
  • ABB
  • Engie
  • ChargePoint
  • Shell
  • IONITY
  • Tesla
  • Siemens
  • EVBox
  • NIO
  • Blink Charging

Electric Vehicle Fast Charging System Market Industry Developments

The Electric Vehicle Fast Charging System Market is experiencing significant advancements, particularly with companies such as Electrify America, BP, and ChargePoint leading the charge in expanding infrastructure.

Recent developments include the expansion of high-speed charging networks, with ChargePoint unveiling plans in September 2023 to increase its charging station coverage significantly across urban and highway locations.

In August 2023, Shell announced its acquisition of a stake in Ionity, enhancing its capabilities in the European fast-charging network sector.

Another noteworthy event is the partnership between ABB and NIO, established in July 2023, aimed at integrating advanced technology into fast charging solutions for electric vehicles.

Market demand continues to surge, driving investments from major players like Tritium and Siemens, who are focusing on R&D efforts to improve charging efficiency and reduce costs.

The Electric Vehicle Fast Charging System Market has seen notable investments, with a surge in market valuation estimated to reach 50 USD Billion by 2024, reflecting a robust growth trajectory bolstered by government incentives and regulations aimed at promoting electric mobility.

In the past two years, the market has witnessed increased competition and collaboration, shaping a dynamic environment conducive to innovation and expansion.

Report Attribute/Metric Details
Market Size 2023 8.1 (USD Billion)
Market Size 2024 9.85 (USD Billion)
Market Size 2035 85.0 (USD Billion)
Compound Annual Growth Rate (CAGR) 21.64% (2025 - 2035)
Report Coverage Revenue Forecast, Competitive Landscape, Growth Factors, and Trends
Base Year 2024
Market Forecast Period 2025 - 2035
Historical Data 2019 - 2024
Market Forecast Units USD Billion
Key Companies Profiled Electrify America, BP, Tritium, ABB, Engie, ChargePoint, Shell, IONITY, Tesla, Siemens, EVBox, NIO, Blink Charging
Segments Covered Charging Type, Connector Type, End User, Power Output, Regional
Key Market Opportunities Rising EV adoption rates, Government incentives for infrastructure, Technological advancements in charging speed, Integration with renewable energy sources, Expansion in urban charging networks
Key Market Dynamics rising EV adoption, government incentives, technological advancements, infrastructure expansion, consumer demand for convenience
Countries Covered North America, Europe, APAC, South America, MEA


Frequently Asked Questions (FAQ):

The expected market size of the Electric Vehicle Fast Charging System Market by 2024 is valued at 9.85 USD Billion.

The Electric Vehicle Fast Charging System Market is projected to grow at a CAGR of 21.64% from 2025 to 2035.

The market size of DC Fast Charging is expected to reach 40.0 USD Billion by 2035.

North America is anticipated to dominate the market with an expected valuation of 30.0 USD Billion by 2035.

The market size of AC Charging is projected to be 25.0 USD Billion by 2035.

Key players in the market include Electrify America, BP, Tritium, ABB, and ChargePoint.

The market size of Semi-Fast Charging is expected to reach 20.0 USD Billion by 2035.

The market size for the Asia Pacific region is expected to be 15.0 USD Billion by 2035.

Growth drivers include increasing EV adoption, government initiatives, and the need for fast charging infrastructure.

The market valuation for South America is projected to be 5.0 USD Billion by the end of 2035.

Comments

Electric Vehicle Fast Charging System Market Segmentation


  • Electric Vehicle Fast Charging System Market By Charging Type (USD Billion, 2019-2035)

    • DC Fast Charging

    • AC Charging

    • Semi-Fast Charging


  • Electric Vehicle Fast Charging System Market By Connector Type (USD Billion, 2019-2035)

    • Type 1

    • Type 2

    • CHAdeMO

    • CCS

    • GB/T


  • Electric Vehicle Fast Charging System Market By End User (USD Billion, 2019-2035)

    • Residential

    • Commercial

    • Public Infrastructure


  • Electric Vehicle Fast Charging System Market By Power Output (USD Billion, 2019-2035)

    • Below 50 kW

    • 50 kW to 150 kW

    • Above 150 kW


  • Electric Vehicle Fast Charging System Market By Regional (USD Billion, 2019-2035)

    • North America

    • Europe

    • South America

    • Asia Pacific

    • Middle East and Africa


Electric Vehicle Fast Charging System Market Regional Outlook (USD Billion, 2019-2035)


    • North America Electric Vehicle Fast Charging System Market Outlook (USD Billion, 2019-2035)


      • North America Market by Charging Type


        • DC Fast Charging


        • AC Charging


        • Semi-Fast Charging


      • North America Market by Connector Type


        • Type 1


        • Type 2


        • CHAdeMO


        • CCS


        • GB/T


      • North America Market by End User Type


        • Residential


        • Commercial


        • Public Infrastructure


      • North America Market by Power Output Type


        • Below 50 kW


        • 50 kW to 150 kW


        • Above 150 kW


      • North America Market by Regional Type


        • US


        • Canada


      • US Electric Vehicle Fast Charging System Market Outlook (USD Billion, 2019-2035)


      • US Market by Charging Type


        • DC Fast Charging


        • AC Charging


        • Semi-Fast Charging


      • US Market by Connector Type


        • Type 1


        • Type 2


        • CHAdeMO


        • CCS


        • GB/T


      • US Market by End User Type


        • Residential


        • Commercial


        • Public Infrastructure


      • US Market by Power Output Type


        • Below 50 kW


        • 50 kW to 150 kW


        • Above 150 kW


      • CANADA Electric Vehicle Fast Charging System Market Outlook (USD Billion, 2019-2035)


      • CANADA Market by Charging Type


        • DC Fast Charging


        • AC Charging


        • Semi-Fast Charging


      • CANADA Market by Connector Type


        • Type 1


        • Type 2


        • CHAdeMO


        • CCS


        • GB/T


      • CANADA Market by End User Type


        • Residential


        • Commercial


        • Public Infrastructure


      • CANADA Market by Power Output Type


        • Below 50 kW


        • 50 kW to 150 kW


        • Above 150 kW


      • Europe Electric Vehicle Fast Charging System Marketย Outlook (USD Billion, 2019-2035)


        • Europe Market by Charging Type


          • DC Fast Charging


          • AC Charging


          • Semi-Fast Charging


        • Europe Market by Connector Type


          • Type 1


          • Type 2


          • CHAdeMO


          • CCS


          • GB/T


        • Europe Market by End User Type


          • Residential


          • Commercial


          • Public Infrastructure


        • Europe Market by Power Output Type


          • Below 50 kW


          • 50 kW to 150 kW


          • Above 150 kW


        • Europe Market by Regional Type


          • Germany


          • UK


          • France


          • Russia


          • Italy


          • Spain


          • Rest of Europe


        • GERMANY Electric Vehicle Fast Charging System Market Outlook (USD Billion, 2019-2035)


        • GERMANY Market by Charging Type


          • DC Fast Charging


          • AC Charging


          • Semi-Fast Charging


        • GERMANY Market by Connector Type


          • Type 1


          • Type 2


          • CHAdeMO


          • CCS


          • GB/T


        • GERMANY Market by End User Type


          • Residential


          • Commercial


          • Public Infrastructure


        • GERMANY Market by Power Output Type


          • Below 50 kW


          • 50 kW to 150 kW


          • Above 150 kW


        • UK Electric Vehicle Fast Charging System Market Outlook (USD Billion, 2019-2035)


        • UK Market by Charging Type


          • DC Fast Charging


          • AC Charging


          • Semi-Fast Charging


        • UK Market by Connector Type


          • Type 1


          • Type 2


          • CHAdeMO


          • CCS


          • GB/T


        • UK Market by End User Type


          • Residential


          • Commercial


          • Public Infrastructure


        • UK Market by Power Output Type


          • Below 50 kW


          • 50 kW to 150 kW


          • Above 150 kW


        • FRANCE Electric Vehicle Fast Charging System Market Outlook (USD Billion, 2019-2035)


        • FRANCE Market by Charging Type


          • DC Fast Charging


          • AC Charging


          • Semi-Fast Charging


        • FRANCE Market by Connector Type


          • Type 1


          • Type 2


          • CHAdeMO


          • CCS


          • GB/T


        • FRANCE Market by End User Type


          • Residential


          • Commercial


          • Public Infrastructure


        • FRANCE Market by Power Output Type


          • Below 50 kW


          • 50 kW to 150 kW


          • Above 150 kW


        • RUSSIA Electric Vehicle Fast Charging System Market Outlook (USD Billion, 2019-2035)


        • RUSSIA Market by Charging Type


          • DC Fast Charging


          • AC Charging


          • Semi-Fast Charging


        • RUSSIA Market by Connector Type


          • Type 1


          • Type 2


          • CHAdeMO


          • CCS


          • GB/T


        • RUSSIA Market by End User Type


          • Residential


          • Commercial


          • Public Infrastructure


        • RUSSIA Market by Power Output Type


          • Below 50 kW


          • 50 kW to 150 kW


          • Above 150 kW


        • ITALY Electric Vehicle Fast Charging System Market Outlook (USD Billion, 2019-2035)


        • ITALY Market by Charging Type


          • DC Fast Charging


          • AC Charging


          • Semi-Fast Charging


        • ITALY Market by Connector Type


          • Type 1


          • Type 2


          • CHAdeMO


          • CCS


          • GB/T


        • ITALY Market by End User Type


          • Residential


          • Commercial


          • Public Infrastructure


        • ITALY Market by Power Output Type


          • Below 50 kW


          • 50 kW to 150 kW


          • Above 150 kW


        • SPAIN Electric Vehicle Fast Charging System Market Outlook (USD Billion, 2019-2035)


        • SPAIN Market by Charging Type


          • DC Fast Charging


          • AC Charging


          • Semi-Fast Charging


        • SPAIN Market by Connector Type


          • Type 1


          • Type 2


          • CHAdeMO


          • CCS


          • GB/T


        • SPAIN Market by End User Type


          • Residential


          • Commercial


          • Public Infrastructure


        • SPAIN Market by Power Output Type


          • Below 50 kW


          • 50 kW to 150 kW


          • Above 150 kW


        • REST OF EUROPE Electric Vehicle Fast Charging System Market Outlook (USD Billion, 2019-2035)


        • REST OF EUROPE Market by Charging Type


          • DC Fast Charging


          • AC Charging


          • Semi-Fast Charging


        • REST OF EUROPE Market by Connector Type


          • Type 1


          • Type 2


          • CHAdeMO


          • CCS


          • GB/T


        • REST OF EUROPE Market by End User Type


          • Residential


          • Commercial


          • Public Infrastructure


        • REST OF EUROPE Market by Power Output Type


          • Below 50 kW


          • 50 kW to 150 kW


          • Above 150 kW


        • APAC Electric Vehicle Fast Charging System Market Outlook (USD Billion, 2019-2035)


          • APAC Market by Charging Type


            • DC Fast Charging


            • AC Charging


            • Semi-Fast Charging


          • APAC Market by Connector Type


            • Type 1


            • Type 2


            • CHAdeMO


            • CCS


            • GB/T


          • APAC Market by End User Type


            • Residential


            • Commercial


            • Public Infrastructure


          • APAC Market by Power Output Type


            • Below 50 kW


            • 50 kW to 150 kW


            • Above 150 kW


          • APAC Market by Regional Type


            • China


            • India


            • Japan


            • South Korea


            • Malaysia


            • Thailand


            • Indonesia


            • Rest of APAC


          • CHINA Electric Vehicle Fast Charging System Market Outlook (USD Billion, 2019-2035)


          • CHINA Market by Charging Type


            • DC Fast Charging


            • AC Charging


            • Semi-Fast Charging


          • CHINA Market by Connector Type


            • Type 1


            • Type 2


            • CHAdeMO


            • CCS


            • GB/T


          • CHINA Market by End User Type


            • Residential


            • Commercial


            • Public Infrastructure


          • CHINA Market by Power Output Type


            • Below 50 kW


            • 50 kW to 150 kW


            • Above 150 kW


          • INDIA Electric Vehicle Fast Charging System Market Outlook (USD Billion, 2019-2035)


          • INDIA Market by Charging Type


            • DC Fast Charging


            • AC Charging


            • Semi-Fast Charging


          • INDIA Market by Connector Type


            • Type 1


            • Type 2


            • CHAdeMO


            • CCS


            • GB/T


          • INDIA Market by End User Type


            • Residential


            • Commercial


            • Public Infrastructure


          • INDIA Market by Power Output Type


            • Below 50 kW


            • 50 kW to 150 kW


            • Above 150 kW


          • JAPAN Electric Vehicle Fast Charging System Market Outlook (USD Billion, 2019-2035)


          • JAPAN Market by Charging Type


            • DC Fast Charging


            • AC Charging


            • Semi-Fast Charging


          • JAPAN Market by Connector Type


            • Type 1


            • Type 2


            • CHAdeMO


            • CCS


            • GB/T


          • JAPAN Market by End User Type


            • Residential


            • Commercial


            • Public Infrastructure


          • JAPAN Market by Power Output Type


            • Below 50 kW


            • 50 kW to 150 kW


            • Above 150 kW


          • SOUTH KOREA Electric Vehicle Fast Charging System Market Outlook (USD Billion, 2019-2035)


          • SOUTH KOREA Market by Charging Type


            • DC Fast Charging


            • AC Charging


            • Semi-Fast Charging


          • SOUTH KOREA Market by Connector Type


            • Type 1


            • Type 2


            • CHAdeMO


            • CCS


            • GB/T


          • SOUTH KOREA Market by End User Type


            • Residential


            • Commercial


            • Public Infrastructure


          • SOUTH KOREA Market by Power Output Type


            • Below 50 kW


            • 50 kW to 150 kW


            • Above 150 kW


          • MALAYSIA Electric Vehicle Fast Charging System Market Outlook (USD Billion, 2019-2035)


          • MALAYSIA Market by Charging Type


            • DC Fast Charging


            • AC Charging


            • Semi-Fast Charging


          • MALAYSIA Market by Connector Type


            • Type 1


            • Type 2


            • CHAdeMO


            • CCS


            • GB/T


          • MALAYSIA Market by End User Type


            • Residential


            • Commercial


            • Public Infrastructure


          • MALAYSIA Market by Power Output Type


            • Below 50 kW


            • 50 kW to 150 kW


            • Above 150 kW


          • THAILAND Electric Vehicle Fast Charging System Market Outlook (USD Billion, 2019-2035)


          • THAILAND Market by Charging Type


            • DC Fast Charging


            • AC Charging


            • Semi-Fast Charging


          • THAILAND Market by Connector Type


            • Type 1


            • Type 2


            • CHAdeMO


            • CCS


            • GB/T


          • THAILAND Market by End User Type


            • Residential


            • Commercial


            • Public Infrastructure


          • THAILAND Market by Power Output Type


            • Below 50 kW


            • 50 kW to 150 kW


            • Above 150 kW


          • INDONESIA Electric Vehicle Fast Charging System Market Outlook (USD Billion, 2019-2035)


          • INDONESIA Market by Charging Type


            • DC Fast Charging


            • AC Charging


            • Semi-Fast Charging


          • INDONESIA Market by Connector Type


            • Type 1


            • Type 2


            • CHAdeMO


            • CCS


            • GB/T


          • INDONESIA Market by End User Type


            • Residential


            • Commercial


            • Public Infrastructure


          • INDONESIA Market by Power Output Type


            • Below 50 kW


            • 50 kW to 150 kW


            • Above 150 kW


          • REST OF APAC Electric Vehicle Fast Charging System Market Outlook (USD Billion, 2019-2035)


          • REST OF APAC Market by Charging Type


            • DC Fast Charging


            • AC Charging


            • Semi-Fast Charging


          • REST OF APAC Market by Connector Type


            • Type 1


            • Type 2


            • CHAdeMO


            • CCS


            • GB/T


          • REST OF APAC Market by End User Type


            • Residential


            • Commercial


            • Public Infrastructure


          • REST OF APAC Market by Power Output Type


            • Below 50 kW


            • 50 kW to 150 kW


            • Above 150 kW


          • South America Electric Vehicle Fast Charging System Market Outlook (USD Billion, 2019-2035)


            • South America Market by Charging Type


              • DC Fast Charging


              • AC Charging


              • Semi-Fast Charging


            • South America Market by Connector Type


              • Type 1


              • Type 2


              • CHAdeMO


              • CCS


              • GB/T


            • South America Market by End User Type


              • Residential


              • Commercial


              • Public Infrastructure


            • South America Market by Power Output Type


              • Below 50 kW


              • 50 kW to 150 kW


              • Above 150 kW


            • South America Market by Regional Type


              • Brazil


              • Mexico


              • Argentina


              • Rest of South America


            • BRAZIL Electric Vehicle Fast Charging System Market Outlook (USD Billion, 2019-2035)


            • BRAZIL Market by Charging Type


              • DC Fast Charging


              • AC Charging


              • Semi-Fast Charging


            • BRAZIL Market by Connector Type


              • Type 1


              • Type 2


              • CHAdeMO


              • CCS


              • GB/T


            • BRAZIL Market by End User Type


              • Residential


              • Commercial


              • Public Infrastructure


            • BRAZIL Market by Power Output Type


              • Below 50 kW


              • 50 kW to 150 kW


              • Above 150 kW


            • MEXICO Electric Vehicle Fast Charging System Market Outlook (USD Billion, 2019-2035)


            • MEXICO Market by Charging Type


              • DC Fast Charging


              • AC Charging


              • Semi-Fast Charging


            • MEXICO Market by Connector Type


              • Type 1


              • Type 2


              • CHAdeMO


              • CCS


              • GB/T


            • MEXICO Market by End User Type


              • Residential


              • Commercial


              • Public Infrastructure


            • MEXICO Market by Power Output Type


              • Below 50 kW


              • 50 kW to 150 kW


              • Above 150 kW


            • ARGENTINA Electric Vehicle Fast Charging System Market Outlook (USD Billion, 2019-2035)


            • ARGENTINA Market by Charging Type


              • DC Fast Charging


              • AC Charging


              • Semi-Fast Charging


            • ARGENTINA Market by Connector Type


              • Type 1


              • Type 2


              • CHAdeMO


              • CCS


              • GB/T


            • ARGENTINA Market by End User Type


              • Residential


              • Commercial


              • Public Infrastructure


            • ARGENTINA Market by Power Output Type


              • Below 50 kW


              • 50 kW to 150 kW


              • Above 150 kW


            • REST OF SOUTH AMERICA Electric Vehicle Fast Charging System Market Outlook (USD Billion, 2019-2035)


            • REST OF SOUTH AMERICA Market by Charging Type


              • DC Fast Charging


              • AC Charging


              • Semi-Fast Charging


            • REST OF SOUTH AMERICA Market by Connector Type


              • Type 1


              • Type 2


              • CHAdeMO


              • CCS


              • GB/T


            • REST OF SOUTH AMERICA Market by End User Type


              • Residential


              • Commercial


              • Public Infrastructure


            • REST OF SOUTH AMERICA Market by Power Output Type


              • Below 50 kW


              • 50 kW to 150 kW


              • Above 150 kW


            • MEA Electric Vehicle Fast Charging System Market Outlook (USD Billion, 2019-2035)


              • MEA Market by Charging Type


                • DC Fast Charging


                • AC Charging


                • Semi-Fast Charging


              • MEA Market by Connector Type


                • Type 1


                • Type 2


                • CHAdeMO


                • CCS


                • GB/T


              • MEA Market by End User Type


                • Residential


                • Commercial


                • Public Infrastructure


              • MEA Market by Power Output Type


                • Below 50 kW


                • 50 kW to 150 kW


                • Above 150 kW


              • MEA Market by Regional Type


                • GCC Countries


                • South Africa


                • Rest of MEA


              • GCC COUNTRIES Electric Vehicle Fast Charging System Market Outlook (USD Billion, 2019-2035)


              • GCC COUNTRIES Market by Charging Type


                • DC Fast Charging


                • AC Charging


                • Semi-Fast Charging


              • GCC COUNTRIES Market by Connector Type


                • Type 1


                • Type 2


                • CHAdeMO


                • CCS


                • GB/T


              • GCC COUNTRIES Market by End User Type


                • Residential


                • Commercial


                • Public Infrastructure


              • GCC COUNTRIES Market by Power Output Type


                • Below 50 kW


                • 50 kW to 150 kW


                • Above 150 kW


              • SOUTH AFRICA Electric Vehicle Fast Charging System Market Outlook (USD Billion, 2019-2035)


              • SOUTH AFRICA Market by Charging Type


                • DC Fast Charging


                • AC Charging


                • Semi-Fast Charging


              • SOUTH AFRICA Market by Connector Type


                • Type 1


                • Type 2


                • CHAdeMO


                • CCS


                • GB/T


              • SOUTH AFRICA Market by End User Type


                • Residential


                • Commercial


                • Public Infrastructure


              • SOUTH AFRICA Market by Power Output Type


                • Below 50 kW


                • 50 kW to 150 kW


                • Above 150 kW


              • REST OF MEA Electric Vehicle Fast Charging System Market Outlook (USD Billion, 2019-2035)


              • REST OF MEA Market by Charging Type


                • DC Fast Charging


                • AC Charging


                • Semi-Fast Charging


              • REST OF MEA Market by Connector Type


                • Type 1


                • Type 2


                • CHAdeMO


                • CCS


                • GB/T


              • REST OF MEA Market by End User Type


                • Residential


                • Commercial


                • Public Infrastructure


              • REST OF MEA Market by Power Output Type


                • Below 50 kW


                • 50 kW to 150 kW


                • Above 150 kW


TABLE OF CONTENTS

1. EXECUTIVE SUMMARY

1.1. Market Overview

1.2. Key Findings

1.3. Market Segmentation

1.4. Competitive Landscape

1.5. Challenges and Opportunities

1.6. Future Outlook

2. MARKET INTRODUCTION

2.1. Definition

2.2. Scope of the study

2.2.1. Research Objective

2.2.2. Assumption

2.2.3. Limitations

3. RESEARCH METHODOLOGY

3.1. Overview

3.2. Data Mining

3.3. Secondary Research

3.4. Primary Research

3.4.1. Primary Interviews and Information Gathering Process

3.4.2. Breakdown of Primary Respondents

3.5. Forecasting Model

3.6. Market Size Estimation

3.6.1. Bottom-Up Approach

3.6.2. Top-Down Approach

3.7. Data Triangulation

3.8. Validation

4. MARKET DYNAMICS

4.1. Overview

4.2. Drivers

4.3. Restraints

4.4. Opportunities

5. MARKET FACTOR ANALYSIS

5.1. Value chain Analysis

5.2. Porter's Five Forces Analysis

5.2.1. Bargaining Power of Suppliers

5.2.2. Bargaining Power of Buyers

5.2.3. Threat of New Entrants

5.2.4. Threat of Substitutes

5.2.5. Intensity of Rivalry

5.3. COVID-19 Impact Analysis

5.3.1. Market Impact Analysis

5.3.2. Regional Impact

5.3.3. Opportunity and Threat Analysis

6. MARKET BY CHARGING TYPE (USD BILLION)

6.1. DC Fast Charging

6.2. AC Charging

6.3. Semi-Fast Charging

7. MARKET BY CONNECTOR TYPE (USD BILLION)

7.1. Type 1

7.2. Type 2

7.3. CHAdeMO

7.4. CCS

7.5. GB/T

8. MARKET BY END USER (USD BILLION)

8.1. Residential

8.2. Commercial

8.3. Public Infrastructure

9. MARKET BY POWER OUTPUT (USD BILLION)

9.1. Below 50 kW

9.2. 50 kW to 150 kW

9.3. Above 150 kW

10. MARKET BY REGIONAL (USD BILLION)

10.1. North America

10.1.1. US

10.1.2. Canada

10.2. Europe

10.2.1. Germany

10.2.2. UK

10.2.3. France

10.2.4. Russia

10.2.5. Italy

10.2.6. Spain

10.2.7. Rest of Europe

10.3. APAC

10.3.1. China

10.3.2. India

10.3.3. Japan

10.3.4. South Korea

10.3.5. Malaysia

10.3.6. Thailand

10.3.7. Indonesia

10.3.8. Rest of APAC

10.4. South America

10.4.1. Brazil

10.4.2. Mexico

10.4.3. Argentina

10.4.4. Rest of South America

10.5. MEA

10.5.1. GCC Countries

10.5.2. South Africa

10.5.3. Rest of MEA

11. COMPETITIVE LANDSCAPE

11.1. Overview

11.2. Competitive Analysis

11.3. Market share Analysis

11.4. Major Growth Strategy in the Electric Vehicle Fast Charging System Market

11.5. Competitive Benchmarking

11.6. Leading Players in Terms of Number of Developments in the Electric Vehicle Fast Charging System Market

11.7. Key developments and growth strategies

11.7.1. New Product Launch/Service Deployment

11.7.2. Merger & Acquisitions

11.7.3. Joint Ventures

11.8. Major Players Financial Matrix

11.8.1. Sales and Operating Income

11.8.2. Major Players R&D Expenditure. 2023

12. COMPANY PROFILES

12.1. Electrify America

12.1.1. Financial Overview

12.1.2. Products Offered

12.1.3. Key Developments

12.1.4. SWOT Analysis

12.1.5. Key Strategies

12.2. BP

12.2.1. Financial Overview

12.2.2. Products Offered

12.2.3. Key Developments

12.2.4. SWOT Analysis

12.2.5. Key Strategies

12.3. Tritium

12.3.1. Financial Overview

12.3.2. Products Offered

12.3.3. Key Developments

12.3.4. SWOT Analysis

12.3.5. Key Strategies

12.4. ABB

12.4.1. Financial Overview

12.4.2. Products Offered

12.4.3. Key Developments

12.4.4. SWOT Analysis

12.4.5. Key Strategies

12.5. Engie

12.5.1. Financial Overview

12.5.2. Products Offered

12.5.3. Key Developments

12.5.4. SWOT Analysis

12.5.5. Key Strategies

12.6. ChargePoint

12.6.1. Financial Overview

12.6.2. Products Offered

12.6.3. Key Developments

12.6.4. SWOT Analysis

12.6.5. Key Strategies

12.7. Shell

12.7.1. Financial Overview

12.7.2. Products Offered

12.7.3. Key Developments

12.7.4. SWOT Analysis

12.7.5. Key Strategies

12.8. IONITY

12.8.1. Financial Overview

12.8.2. Products Offered

12.8.3. Key Developments

12.8.4. SWOT Analysis

12.8.5. Key Strategies

12.9. Tesla

12.9.1. Financial Overview

12.9.2. Products Offered

12.9.3. Key Developments

12.9.4. SWOT Analysis

12.9.5. Key Strategies

12.10. Coulomb Technologies

12.10.1. Financial Overview

12.10.2. Products Offered

12.10.3. Key Developments

12.10.4. SWOT Analysis

12.10.5. Key Strategies

12.11. Siemens

12.11.1. Financial Overview

12.11.2. Products Offered

12.11.3. Key Developments

12.11.4. SWOT Analysis

12.11.5. Key Strategies

12.12. EVBox

12.12.1. Financial Overview

12.12.2. Products Offered

12.12.3. Key Developments

12.12.4. SWOT Analysis

12.12.5. Key Strategies

12.13. Greenlots

12.13.1. Financial Overview

12.13.2. Products Offered

12.13.3. Key Developments

12.13.4. SWOT Analysis

12.13.5. Key Strategies

12.14. NIO

12.14.1. Financial Overview

12.14.2. Products Offered

12.14.3. Key Developments

12.14.4. SWOT Analysis

12.14.5. Key Strategies

12.15. Blink Charging

12.15.1. Financial Overview

12.15.2. Products Offered

12.15.3. Key Developments

12.15.4. SWOT Analysis

12.15.5. Key Strategies

13. APPENDIX

13.1. References

13.2. Related Reports

LIST OF TABLES
TABLE 1. LIST OF ASSUMPTIONS
TABLE 2. NORTH AMERICA MARKET SIZE ESTIMATES & FORECAST, BY CHARGING TYPE, 2019-2035 (USD BILLIONS)

TABLE 3. NORTH AMERICA MARKET SIZE ESTIMATES & FORECAST, BY CONNECTOR TYPE, 2019-2035 (USD BILLIONS)

TABLE 4. NORTH AMERICA MARKET SIZE ESTIMATES & FORECAST, BY END USER, 2019-2035 (USD BILLIONS)

TABLE 5. NORTH AMERICA MARKET SIZE ESTIMATES & FORECAST, BY POWER OUTPUT, 2019-2035 (USD BILLIONS)

TABLE 6. NORTH AMERICA MARKET SIZE ESTIMATES & FORECAST, BY REGIONAL, 2019-2035 (USD BILLIONS)

TABLE 7. US MARKET SIZE ESTIMATES & FORECAST, BY CHARGING TYPE, 2019-2035 (USD BILLIONS)

TABLE 8. US MARKET SIZE ESTIMATES & FORECAST, BY CONNECTOR TYPE, 2019-2035 (USD BILLIONS)

TABLE 9. US MARKET SIZE ESTIMATES & FORECAST, BY END USER, 2019-2035 (USD BILLIONS)

TABLE 10. US MARKET SIZE ESTIMATES & FORECAST, BY POWER OUTPUT, 2019-2035 (USD BILLIONS)

TABLE 11. US MARKET SIZE ESTIMATES & FORECAST, BY REGIONAL, 2019-2035 (USD BILLIONS)

TABLE 12. CANADA MARKET SIZE ESTIMATES & FORECAST, BY CHARGING TYPE, 2019-2035 (USD BILLIONS)

TABLE 13. CANADA MARKET SIZE ESTIMATES & FORECAST, BY CONNECTOR TYPE, 2019-2035 (USD BILLIONS)

TABLE 14. CANADA MARKET SIZE ESTIMATES & FORECAST, BY END USER, 2019-2035 (USD BILLIONS)

TABLE 15. CANADA MARKET SIZE ESTIMATES & FORECAST, BY POWER OUTPUT, 2019-2035 (USD BILLIONS)

TABLE 16. CANADA MARKET SIZE ESTIMATES & FORECAST, BY REGIONAL, 2019-2035 (USD BILLIONS)

TABLE 17. EUROPE MARKET SIZE ESTIMATES & FORECAST, BY CHARGING TYPE, 2019-2035 (USD BILLIONS)

TABLE 18. EUROPE MARKET SIZE ESTIMATES & FORECAST, BY CONNECTOR TYPE, 2019-2035 (USD BILLIONS)

TABLE 19. EUROPE MARKET SIZE ESTIMATES & FORECAST, BY END USER, 2019-2035 (USD BILLIONS)

TABLE 20. EUROPE MARKET SIZE ESTIMATES & FORECAST, BY POWER OUTPUT, 2019-2035 (USD BILLIONS)

TABLE 21. EUROPE MARKET SIZE ESTIMATES & FORECAST, BY REGIONAL, 2019-2035 (USD BILLIONS)

TABLE 22. GERMANY MARKET SIZE ESTIMATES & FORECAST, BY CHARGING TYPE, 2019-2035 (USD BILLIONS)

TABLE 23. GERMANY MARKET SIZE ESTIMATES & FORECAST, BY CONNECTOR TYPE, 2019-2035 (USD BILLIONS)

TABLE 24. GERMANY MARKET SIZE ESTIMATES & FORECAST, BY END USER, 2019-2035 (USD BILLIONS)

TABLE 25. GERMANY MARKET SIZE ESTIMATES & FORECAST, BY POWER OUTPUT, 2019-2035 (USD BILLIONS)

TABLE 26. GERMANY MARKET SIZE ESTIMATES & FORECAST, BY REGIONAL, 2019-2035 (USD BILLIONS)

TABLE 27. UK MARKET SIZE ESTIMATES & FORECAST, BY CHARGING TYPE, 2019-2035 (USD BILLIONS)

TABLE 28. UK MARKET SIZE ESTIMATES & FORECAST, BY CONNECTOR TYPE, 2019-2035 (USD BILLIONS)

TABLE 29. UK MARKET SIZE ESTIMATES & FORECAST, BY END USER, 2019-2035 (USD BILLIONS)

TABLE 30. UK MARKET SIZE ESTIMATES & FORECAST, BY POWER OUTPUT, 2019-2035 (USD BILLIONS)

TABLE 31. UK MARKET SIZE ESTIMATES & FORECAST, BY REGIONAL, 2019-2035 (USD BILLIONS)

TABLE 32. FRANCE MARKET SIZE ESTIMATES & FORECAST, BY CHARGING TYPE, 2019-2035 (USD BILLIONS)

TABLE 33. FRANCE MARKET SIZE ESTIMATES & FORECAST, BY CONNECTOR TYPE, 2019-2035 (USD BILLIONS)

TABLE 34. FRANCE MARKET SIZE ESTIMATES & FORECAST, BY END USER, 2019-2035 (USD BILLIONS)

TABLE 35. FRANCE MARKET SIZE ESTIMATES & FORECAST, BY POWER OUTPUT, 2019-2035 (USD BILLIONS)

TABLE 36. FRANCE MARKET SIZE ESTIMATES & FORECAST, BY REGIONAL, 2019-2035 (USD BILLIONS)

TABLE 37. RUSSIA MARKET SIZE ESTIMATES & FORECAST, BY CHARGING TYPE, 2019-2035 (USD BILLIONS)

TABLE 38. RUSSIA MARKET SIZE ESTIMATES & FORECAST, BY CONNECTOR TYPE, 2019-2035 (USD BILLIONS)

TABLE 39. RUSSIA MARKET SIZE ESTIMATES & FORECAST, BY END USER, 2019-2035 (USD BILLIONS)

TABLE 40. RUSSIA MARKET SIZE ESTIMATES & FORECAST, BY POWER OUTPUT, 2019-2035 (USD BILLIONS)

TABLE 41. RUSSIA MARKET SIZE ESTIMATES & FORECAST, BY REGIONAL, 2019-2035 (USD BILLIONS)

TABLE 42. ITALY MARKET SIZE ESTIMATES & FORECAST, BY CHARGING TYPE, 2019-2035 (USD BILLIONS)

TABLE 43. ITALY MARKET SIZE ESTIMATES & FORECAST, BY CONNECTOR TYPE, 2019-2035 (USD BILLIONS)

TABLE 44. ITALY MARKET SIZE ESTIMATES & FORECAST, BY END USER, 2019-2035 (USD BILLIONS)

TABLE 45. ITALY MARKET SIZE ESTIMATES & FORECAST, BY POWER OUTPUT, 2019-2035 (USD BILLIONS)

TABLE 46. ITALY MARKET SIZE ESTIMATES & FORECAST, BY REGIONAL, 2019-2035 (USD BILLIONS)

TABLE 47. SPAIN MARKET SIZE ESTIMATES & FORECAST, BY CHARGING TYPE, 2019-2035 (USD BILLIONS)

TABLE 48. SPAIN MARKET SIZE ESTIMATES & FORECAST, BY CONNECTOR TYPE, 2019-2035 (USD BILLIONS)

TABLE 49. SPAIN MARKET SIZE ESTIMATES & FORECAST, BY END USER, 2019-2035 (USD BILLIONS)

TABLE 50. SPAIN MARKET SIZE ESTIMATES & FORECAST, BY POWER OUTPUT, 2019-2035 (USD BILLIONS)

TABLE 51. SPAIN MARKET SIZE ESTIMATES & FORECAST, BY REGIONAL, 2019-2035 (USD BILLIONS)

TABLE 52. REST OF EUROPE MARKET SIZE ESTIMATES & FORECAST, BY CHARGING TYPE, 2019-2035 (USD BILLIONS)

TABLE 53. REST OF EUROPE MARKET SIZE ESTIMATES & FORECAST, BY CONNECTOR TYPE, 2019-2035 (USD BILLIONS)

TABLE 54. REST OF EUROPE MARKET SIZE ESTIMATES & FORECAST, BY END USER, 2019-2035 (USD BILLIONS)

TABLE 55. REST OF EUROPE MARKET SIZE ESTIMATES & FORECAST, BY POWER OUTPUT, 2019-2035 (USD BILLIONS)

TABLE 56. REST OF EUROPE MARKET SIZE ESTIMATES & FORECAST, BY REGIONAL, 2019-2035 (USD BILLIONS)

TABLE 57. APAC MARKET SIZE ESTIMATES & FORECAST, BY CHARGING TYPE, 2019-2035 (USD BILLIONS)

TABLE 58. APAC MARKET SIZE ESTIMATES & FORECAST, BY CONNECTOR TYPE, 2019-2035 (USD BILLIONS)

TABLE 59. APAC MARKET SIZE ESTIMATES & FORECAST, BY END USER, 2019-2035 (USD BILLIONS)

TABLE 60. APAC MARKET SIZE ESTIMATES & FORECAST, BY POWER OUTPUT, 2019-2035 (USD BILLIONS)

TABLE 61. APAC MARKET SIZE ESTIMATES & FORECAST, BY REGIONAL, 2019-2035 (USD BILLIONS)

TABLE 62. CHINA MARKET SIZE ESTIMATES & FORECAST, BY CHARGING TYPE, 2019-2035 (USD BILLIONS)

TABLE 63. CHINA MARKET SIZE ESTIMATES & FORECAST, BY CONNECTOR TYPE, 2019-2035 (USD BILLIONS)

TABLE 64. CHINA MARKET SIZE ESTIMATES & FORECAST, BY END USER, 2019-2035 (USD BILLIONS)

TABLE 65. CHINA MARKET SIZE ESTIMATES & FORECAST, BY POWER OUTPUT, 2019-2035 (USD BILLIONS)

TABLE 66. CHINA MARKET SIZE ESTIMATES & FORECAST, BY REGIONAL, 2019-2035 (USD BILLIONS)

TABLE 67. INDIA MARKET SIZE ESTIMATES & FORECAST, BY CHARGING TYPE, 2019-2035 (USD BILLIONS)

TABLE 68. INDIA MARKET SIZE ESTIMATES & FORECAST, BY CONNECTOR TYPE, 2019-2035 (USD BILLIONS)

TABLE 69. INDIA MARKET SIZE ESTIMATES & FORECAST, BY END USER, 2019-2035 (USD BILLIONS)

TABLE 70. INDIA MARKET SIZE ESTIMATES & FORECAST, BY POWER OUTPUT, 2019-2035 (USD BILLIONS)

TABLE 71. INDIA MARKET SIZE ESTIMATES & FORECAST, BY REGIONAL, 2019-2035 (USD BILLIONS)

TABLE 72. JAPAN MARKET SIZE ESTIMATES & FORECAST, BY CHARGING TYPE, 2019-2035 (USD BILLIONS)

TABLE 73. JAPAN MARKET SIZE ESTIMATES & FORECAST, BY CONNECTOR TYPE, 2019-2035 (USD BILLIONS)

TABLE 74. JAPAN MARKET SIZE ESTIMATES & FORECAST, BY END USER, 2019-2035 (USD BILLIONS)

TABLE 75. JAPAN MARKET SIZE ESTIMATES & FORECAST, BY POWER OUTPUT, 2019-2035 (USD BILLIONS)

TABLE 76. JAPAN MARKET SIZE ESTIMATES & FORECAST, BY REGIONAL, 2019-2035 (USD BILLIONS)

TABLE 77. SOUTH KOREA MARKET SIZE ESTIMATES & FORECAST, BY CHARGING TYPE, 2019-2035 (USD BILLIONS)

TABLE 78. SOUTH KOREA MARKET SIZE ESTIMATES & FORECAST, BY CONNECTOR TYPE, 2019-2035 (USD BILLIONS)

TABLE 79. SOUTH KOREA MARKET SIZE ESTIMATES & FORECAST, BY END USER, 2019-2035 (USD BILLIONS)

TABLE 80. SOUTH KOREA MARKET SIZE ESTIMATES & FORECAST, BY POWER OUTPUT, 2019-2035 (USD BILLIONS)

TABLE 81. SOUTH KOREA MARKET SIZE ESTIMATES & FORECAST, BY REGIONAL, 2019-2035 (USD BILLIONS)

TABLE 82. MALAYSIA MARKET SIZE ESTIMATES & FORECAST, BY CHARGING TYPE, 2019-2035 (USD BILLIONS)

TABLE 83. MALAYSIA MARKET SIZE ESTIMATES & FORECAST, BY CONNECTOR TYPE, 2019-2035 (USD BILLIONS)

TABLE 84. MALAYSIA MARKET SIZE ESTIMATES & FORECAST, BY END USER, 2019-2035 (USD BILLIONS)

TABLE 85. MALAYSIA MARKET SIZE ESTIMATES & FORECAST, BY POWER OUTPUT, 2019-2035 (USD BILLIONS)

TABLE 86. MALAYSIA MARKET SIZE ESTIMATES & FORECAST, BY REGIONAL, 2019-2035 (USD BILLIONS)

TABLE 87. THAILAND MARKET SIZE ESTIMATES & FORECAST, BY CHARGING TYPE, 2019-2035 (USD BILLIONS)

TABLE 88. THAILAND MARKET SIZE ESTIMATES & FORECAST, BY CONNECTOR TYPE, 2019-2035 (USD BILLIONS)

TABLE 89. THAILAND MARKET SIZE ESTIMATES & FORECAST, BY END USER, 2019-2035 (USD BILLIONS)

TABLE 90. THAILAND MARKET SIZE ESTIMATES & FORECAST, BY POWER OUTPUT, 2019-2035 (USD BILLIONS)

TABLE 91. THAILAND MARKET SIZE ESTIMATES & FORECAST, BY REGIONAL, 2019-2035 (USD BILLIONS)

TABLE 92. INDONESIA MARKET SIZE ESTIMATES & FORECAST, BY CHARGING TYPE, 2019-2035 (USD BILLIONS)

TABLE 93. INDONESIA MARKET SIZE ESTIMATES & FORECAST, BY CONNECTOR TYPE, 2019-2035 (USD BILLIONS)

TABLE 94. INDONESIA MARKET SIZE ESTIMATES & FORECAST, BY END USER, 2019-2035 (USD BILLIONS)

TABLE 95. INDONESIA MARKET SIZE ESTIMATES & FORECAST, BY POWER OUTPUT, 2019-2035 (USD BILLIONS)

TABLE 96. INDONESIA MARKET SIZE ESTIMATES & FORECAST, BY REGIONAL, 2019-2035 (USD BILLIONS)

TABLE 97. REST OF APAC MARKET SIZE ESTIMATES & FORECAST, BY CHARGING TYPE, 2019-2035 (USD BILLIONS)

TABLE 98. REST OF APAC MARKET SIZE ESTIMATES & FORECAST, BY CONNECTOR TYPE, 2019-2035 (USD BILLIONS)

TABLE 99. REST OF APAC MARKET SIZE ESTIMATES & FORECAST, BY END USER, 2019-2035 (USD BILLIONS)

TABLE 100. REST OF APAC MARKET SIZE ESTIMATES & FORECAST, BY POWER OUTPUT, 2019-2035 (USD BILLIONS)

TABLE 101. REST OF APAC MARKET SIZE ESTIMATES & FORECAST, BY REGIONAL, 2019-2035 (USD BILLIONS)

TABLE 102. SOUTH AMERICA MARKET SIZE ESTIMATES & FORECAST, BY CHARGING TYPE, 2019-2035 (USD BILLIONS)

TABLE 103. SOUTH AMERICA MARKET SIZE ESTIMATES & FORECAST, BY CONNECTOR TYPE, 2019-2035 (USD BILLIONS)

TABLE 104. SOUTH AMERICA MARKET SIZE ESTIMATES & FORECAST, BY END USER, 2019-2035 (USD BILLIONS)

TABLE 105. SOUTH AMERICA MARKET SIZE ESTIMATES & FORECAST, BY POWER OUTPUT, 2019-2035 (USD BILLIONS)

TABLE 106. SOUTH AMERICA MARKET SIZE ESTIMATES & FORECAST, BY REGIONAL, 2019-2035 (USD BILLIONS)

TABLE 107. BRAZIL MARKET SIZE ESTIMATES & FORECAST, BY CHARGING TYPE, 2019-2035 (USD BILLIONS)

TABLE 108. BRAZIL MARKET SIZE ESTIMATES & FORECAST, BY CONNECTOR TYPE, 2019-2035 (USD BILLIONS)

TABLE 109. BRAZIL MARKET SIZE ESTIMATES & FORECAST, BY END USER, 2019-2035 (USD BILLIONS)

TABLE 110. BRAZIL MARKET SIZE ESTIMATES & FORECAST, BY POWER OUTPUT, 2019-2035 (USD BILLIONS)

TABLE 111. BRAZIL MARKET SIZE ESTIMATES & FORECAST, BY REGIONAL, 2019-2035 (USD BILLIONS)

TABLE 112. MEXICO MARKET SIZE ESTIMATES & FORECAST, BY CHARGING TYPE, 2019-2035 (USD BILLIONS)

TABLE 113. MEXICO MARKET SIZE ESTIMATES & FORECAST, BY CONNECTOR TYPE, 2019-2035 (USD BILLIONS)

TABLE 114. MEXICO MARKET SIZE ESTIMATES & FORECAST, BY END USER, 2019-2035 (USD BILLIONS)

TABLE 115. MEXICO MARKET SIZE ESTIMATES & FORECAST, BY POWER OUTPUT, 2019-2035 (USD BILLIONS)

TABLE 116. MEXICO MARKET SIZE ESTIMATES & FORECAST, BY REGIONAL, 2019-2035 (USD BILLIONS)

TABLE 117. ARGENTINA MARKET SIZE ESTIMATES & FORECAST, BY CHARGING TYPE, 2019-2035 (USD BILLIONS)

TABLE 118. ARGENTINA MARKET SIZE ESTIMATES & FORECAST, BY CONNECTOR TYPE, 2019-2035 (USD BILLIONS)

TABLE 119. ARGENTINA MARKET SIZE ESTIMATES & FORECAST, BY END USER, 2019-2035 (USD BILLIONS)

TABLE 120. ARGENTINA MARKET SIZE ESTIMATES & FORECAST, BY POWER OUTPUT, 2019-2035 (USD BILLIONS)

TABLE 121. ARGENTINA MARKET SIZE ESTIMATES & FORECAST, BY REGIONAL, 2019-2035 (USD BILLIONS)

TABLE 122. REST OF SOUTH AMERICA MARKET SIZE ESTIMATES & FORECAST, BY CHARGING TYPE, 2019-2035 (USD BILLIONS)

TABLE 123. REST OF SOUTH AMERICA MARKET SIZE ESTIMATES & FORECAST, BY CONNECTOR TYPE, 2019-2035 (USD BILLIONS)

TABLE 124. REST OF SOUTH AMERICA MARKET SIZE ESTIMATES & FORECAST, BY END USER, 2019-2035 (USD BILLIONS)

TABLE 125. REST OF SOUTH AMERICA MARKET SIZE ESTIMATES & FORECAST, BY POWER OUTPUT, 2019-2035 (USD BILLIONS)

TABLE 126. REST OF SOUTH AMERICA MARKET SIZE ESTIMATES & FORECAST, BY REGIONAL, 2019-2035 (USD BILLIONS)

TABLE 127. MEA MARKET SIZE ESTIMATES & FORECAST, BY CHARGING TYPE, 2019-2035 (USD BILLIONS)

TABLE 128. MEA MARKET SIZE ESTIMATES & FORECAST, BY CONNECTOR TYPE, 2019-2035 (USD BILLIONS)

TABLE 129. MEA MARKET SIZE ESTIMATES & FORECAST, BY END USER, 2019-2035 (USD BILLIONS)

TABLE 130. MEA MARKET SIZE ESTIMATES & FORECAST, BY POWER OUTPUT, 2019-2035 (USD BILLIONS)

TABLE 131. MEA MARKET SIZE ESTIMATES & FORECAST, BY REGIONAL, 2019-2035 (USD BILLIONS)

TABLE 132. GCC COUNTRIES MARKET SIZE ESTIMATES & FORECAST, BY CHARGING TYPE, 2019-2035 (USD BILLIONS)

TABLE 133. GCC COUNTRIES MARKET SIZE ESTIMATES & FORECAST, BY CONNECTOR TYPE, 2019-2035 (USD BILLIONS)

TABLE 134. GCC COUNTRIES MARKET SIZE ESTIMATES & FORECAST, BY END USER, 2019-2035 (USD BILLIONS)

TABLE 135. GCC COUNTRIES MARKET SIZE ESTIMATES & FORECAST, BY POWER OUTPUT, 2019-2035 (USD BILLIONS)

TABLE 136. GCC COUNTRIES MARKET SIZE ESTIMATES & FORECAST, BY REGIONAL, 2019-2035 (USD BILLIONS)

TABLE 137. SOUTH AFRICA MARKET SIZE ESTIMATES & FORECAST, BY CHARGING TYPE, 2019-2035 (USD BILLIONS)

TABLE 138. SOUTH AFRICA MARKET SIZE ESTIMATES & FORECAST, BY CONNECTOR TYPE, 2019-2035 (USD BILLIONS)

TABLE 139. SOUTH AFRICA MARKET SIZE ESTIMATES & FORECAST, BY END USER, 2019-2035 (USD BILLIONS)

TABLE 140. SOUTH AFRICA MARKET SIZE ESTIMATES & FORECAST, BY POWER OUTPUT, 2019-2035 (USD BILLIONS)

TABLE 141. SOUTH AFRICA MARKET SIZE ESTIMATES & FORECAST, BY REGIONAL, 2019-2035 (USD BILLIONS)

TABLE 142. REST OF MEA MARKET SIZE ESTIMATES & FORECAST, BY CHARGING TYPE, 2019-2035 (USD BILLIONS)

TABLE 143. REST OF MEA MARKET SIZE ESTIMATES & FORECAST, BY CONNECTOR TYPE, 2019-2035 (USD BILLIONS)

TABLE 144. REST OF MEA MARKET SIZE ESTIMATES & FORECAST, BY END USER, 2019-2035 (USD BILLIONS)

TABLE 145. REST OF MEA MARKET SIZE ESTIMATES & FORECAST, BY POWER OUTPUT, 2019-2035 (USD BILLIONS)

TABLE 146. REST OF MEA MARKET SIZE ESTIMATES & FORECAST, BY REGIONAL, 2019-2035 (USD BILLIONS)

TABLE 147. PRODUCT LAUNCH/PRODUCT DEVELOPMENT/APPROVAL

TABLE 148. ACQUISITION/PARTNERSHIP

LIST OF FIGURES
FIGURE 1. MARKET SYNOPSIS

FIGURE 2. NORTH AMERICA ELECTRIC VEHICLE FAST CHARGING SYSTEM MARKET ANALYSIS

FIGURE 3. US MARKET ANALYSIS BY CHARGING TYPE

FIGURE 4. US MARKET ANALYSIS BY CONNECTOR TYPE

FIGURE 5. US MARKET ANALYSIS BY END USER

FIGURE 6. US MARKET ANALYSIS BY POWER OUTPUT

FIGURE 7. US MARKET ANALYSIS BY REGIONAL

FIGURE 8. CANADA MARKET ANALYSIS BY CHARGING TYPE

FIGURE 9. CANADA MARKET ANALYSIS BY CONNECTOR TYPE

FIGURE 10. CANADA MARKET ANALYSIS BY END USER

FIGURE 11. CANADA MARKET ANALYSIS BY POWER OUTPUT

FIGURE 12. CANADA MARKET ANALYSIS BY REGIONAL

FIGURE 13. EUROPE ELECTRIC VEHICLE FAST CHARGING SYSTEM MARKET ANALYSIS

FIGURE 14. GERMANY MARKET ANALYSIS BY CHARGING TYPE

FIGURE 15. GERMANY MARKET ANALYSIS BY CONNECTOR TYPE

FIGURE 16. GERMANY MARKET ANALYSIS BY END USER

FIGURE 17. GERMANY MARKET ANALYSIS BY POWER OUTPUT

FIGURE 18. GERMANY MARKET ANALYSIS BY REGIONAL

FIGURE 19. UK MARKET ANALYSIS BY CHARGING TYPE

FIGURE 20. UK MARKET ANALYSIS BY CONNECTOR TYPE

FIGURE 21. UK MARKET ANALYSIS BY END USER

FIGURE 22. UK MARKET ANALYSIS BY POWER OUTPUT

FIGURE 23. UK MARKET ANALYSIS BY REGIONAL

FIGURE 24. FRANCE MARKET ANALYSIS BY CHARGING TYPE

FIGURE 25. FRANCE MARKET ANALYSIS BY CONNECTOR TYPE

FIGURE 26. FRANCE MARKET ANALYSIS BY END USER

FIGURE 27. FRANCE MARKET ANALYSIS BY POWER OUTPUT

FIGURE 28. FRANCE MARKET ANALYSIS BY REGIONAL

FIGURE 29. RUSSIA MARKET ANALYSIS BY CHARGING TYPE

FIGURE 30. RUSSIA MARKET ANALYSIS BY CONNECTOR TYPE

FIGURE 31. RUSSIA MARKET ANALYSIS BY END USER

FIGURE 32. RUSSIA MARKET ANALYSIS BY POWER OUTPUT

FIGURE 33. RUSSIA MARKET ANALYSIS BY REGIONAL

FIGURE 34. ITALY MARKET ANALYSIS BY CHARGING TYPE

FIGURE 35. ITALY MARKET ANALYSIS BY CONNECTOR TYPE

FIGURE 36. ITALY MARKET ANALYSIS BY END USER

FIGURE 37. ITALY MARKET ANALYSIS BY POWER OUTPUT

FIGURE 38. ITALY MARKET ANALYSIS BY REGIONAL

FIGURE 39. SPAIN MARKET ANALYSIS BY CHARGING TYPE

FIGURE 40. SPAIN MARKET ANALYSIS BY CONNECTOR TYPE

FIGURE 41. SPAIN MARKET ANALYSIS BY END USER

FIGURE 42. SPAIN MARKET ANALYSIS BY POWER OUTPUT

FIGURE 43. SPAIN MARKET ANALYSIS BY REGIONAL

FIGURE 44. REST OF EUROPE MARKET ANALYSIS BY CHARGING TYPE

FIGURE 45. REST OF EUROPE MARKET ANALYSIS BY CONNECTOR TYPE

FIGURE 46. REST OF EUROPE MARKET ANALYSIS BY END USER

FIGURE 47. REST OF EUROPE MARKET ANALYSIS BY POWER OUTPUT

FIGURE 48. REST OF EUROPE MARKET ANALYSIS BY REGIONAL

FIGURE 49. APAC ELECTRIC VEHICLE FAST CHARGING SYSTEM MARKET ANALYSIS

FIGURE 50. CHINA MARKET ANALYSIS BY CHARGING TYPE

FIGURE 51. CHINA MARKET ANALYSIS BY CONNECTOR TYPE

FIGURE 52. CHINA MARKET ANALYSIS BY END USER

FIGURE 53. CHINA MARKET ANALYSIS BY POWER OUTPUT

FIGURE 54. CHINA MARKET ANALYSIS BY REGIONAL

FIGURE 55. INDIA MARKET ANALYSIS BY CHARGING TYPE

FIGURE 56. INDIA MARKET ANALYSIS BY CONNECTOR TYPE

FIGURE 57. INDIA MARKET ANALYSIS BY END USER

FIGURE 58. INDIA MARKET ANALYSIS BY POWER OUTPUT

FIGURE 59. INDIA MARKET ANALYSIS BY REGIONAL

FIGURE 60. JAPAN MARKET ANALYSIS BY CHARGING TYPE

FIGURE 61. JAPAN MARKET ANALYSIS BY CONNECTOR TYPE

FIGURE 62. JAPAN MARKET ANALYSIS BY END USER

FIGURE 63. JAPAN MARKET ANALYSIS BY POWER OUTPUT

FIGURE 64. JAPAN MARKET ANALYSIS BY REGIONAL

FIGURE 65. SOUTH KOREA MARKET ANALYSIS BY CHARGING TYPE

FIGURE 66. SOUTH KOREA MARKET ANALYSIS BY CONNECTOR TYPE

FIGURE 67. SOUTH KOREA MARKET ANALYSIS BY END USER

FIGURE 68. SOUTH KOREA MARKET ANALYSIS BY POWER OUTPUT

FIGURE 69. SOUTH KOREA MARKET ANALYSIS BY REGIONAL

FIGURE 70. MALAYSIA MARKET ANALYSIS BY CHARGING TYPE

FIGURE 71. MALAYSIA MARKET ANALYSIS BY CONNECTOR TYPE

FIGURE 72. MALAYSIA MARKET ANALYSIS BY END USER

FIGURE 73. MALAYSIA MARKET ANALYSIS BY POWER OUTPUT

FIGURE 74. MALAYSIA MARKET ANALYSIS BY REGIONAL

FIGURE 75. THAILAND MARKET ANALYSIS BY CHARGING TYPE

FIGURE 76. THAILAND MARKET ANALYSIS BY CONNECTOR TYPE

FIGURE 77. THAILAND MARKET ANALYSIS BY END USER

FIGURE 78. THAILAND MARKET ANALYSIS BY POWER OUTPUT

FIGURE 79. THAILAND MARKET ANALYSIS BY REGIONAL

FIGURE 80. INDONESIA MARKET ANALYSIS BY CHARGING TYPE

FIGURE 81. INDONESIA MARKET ANALYSIS BY CONNECTOR TYPE

FIGURE 82. INDONESIA MARKET ANALYSIS BY END USER

FIGURE 83. INDONESIA MARKET ANALYSIS BY POWER OUTPUT

FIGURE 84. INDONESIA MARKET ANALYSIS BY REGIONAL

FIGURE 85. REST OF APAC MARKET ANALYSIS BY CHARGING TYPE

FIGURE 86. REST OF APAC MARKET ANALYSIS BY CONNECTOR TYPE

FIGURE 87. REST OF APAC MARKET ANALYSIS BY END USER

FIGURE 88. REST OF APAC MARKET ANALYSIS BY POWER OUTPUT

FIGURE 89. REST OF APAC MARKET ANALYSIS BY REGIONAL

FIGURE 90. SOUTH AMERICA ELECTRIC VEHICLE FAST CHARGING SYSTEM MARKET ANALYSIS

FIGURE 91. BRAZIL MARKET ANALYSIS BY CHARGING TYPE

FIGURE 92. BRAZIL MARKET ANALYSIS BY CONNECTOR TYPE

FIGURE 93. BRAZIL MARKET ANALYSIS BY END USER

FIGURE 94. BRAZIL MARKET ANALYSIS BY POWER OUTPUT

FIGURE 95. BRAZIL MARKET ANALYSIS BY REGIONAL

FIGURE 96. MEXICO MARKET ANALYSIS BY CHARGING TYPE

FIGURE 97. MEXICO MARKET ANALYSIS BY CONNECTOR TYPE

FIGURE 98. MEXICO MARKET ANALYSIS BY END USER

FIGURE 99. MEXICO MARKET ANALYSIS BY POWER OUTPUT

FIGURE 100. MEXICO MARKET ANALYSIS BY REGIONAL

FIGURE 101. ARGENTINA MARKET ANALYSIS BY CHARGING TYPE

FIGURE 102. ARGENTINA MARKET ANALYSIS BY CONNECTOR TYPE

FIGURE 103. ARGENTINA MARKET ANALYSIS BY END USER

FIGURE 104. ARGENTINA MARKET ANALYSIS BY POWER OUTPUT

FIGURE 105. ARGENTINA MARKET ANALYSIS BY REGIONAL

FIGURE 106. REST OF SOUTH AMERICA MARKET ANALYSIS BY CHARGING TYPE

FIGURE 107. REST OF SOUTH AMERICA MARKET ANALYSIS BY CONNECTOR TYPE

FIGURE 108. REST OF SOUTH AMERICA MARKET ANALYSIS BY END USER

FIGURE 109. REST OF SOUTH AMERICA MARKET ANALYSIS BY POWER OUTPUT

FIGURE 110. REST OF SOUTH AMERICA MARKET ANALYSIS BY REGIONAL

FIGURE 111. MEA ELECTRIC VEHICLE FAST CHARGING SYSTEM MARKET ANALYSIS

FIGURE 112. GCC COUNTRIES MARKET ANALYSIS BY CHARGING TYPE

FIGURE 113. GCC COUNTRIES MARKET ANALYSIS BY CONNECTOR TYPE

FIGURE 114. GCC COUNTRIES MARKET ANALYSIS BY END USER

FIGURE 115. GCC COUNTRIES MARKET ANALYSIS BY POWER OUTPUT

FIGURE 116. GCC COUNTRIES MARKET ANALYSIS BY REGIONAL

FIGURE 117. SOUTH AFRICA MARKET ANALYSIS BY CHARGING TYPE

FIGURE 118. SOUTH AFRICA MARKET ANALYSIS BY CONNECTOR TYPE

FIGURE 119. SOUTH AFRICA MARKET ANALYSIS BY END USER

FIGURE 120. SOUTH AFRICA MARKET ANALYSIS BY POWER OUTPUT

FIGURE 121. SOUTH AFRICA MARKET ANALYSIS BY REGIONAL

FIGURE 122. REST OF MEA MARKET ANALYSIS BY CHARGING TYPE

FIGURE 123. REST OF MEA MARKET ANALYSIS BY CONNECTOR TYPE

FIGURE 124. REST OF MEA MARKET ANALYSIS BY END USER

FIGURE 125. REST OF MEA MARKET ANALYSIS BY POWER OUTPUT

FIGURE 126. REST OF MEA MARKET ANALYSIS BY REGIONAL
FIGURE 127. KEY BUYING CRITERIA OF ELECTRIC VEHICLE FAST CHARGING SYSTEM MARKET

FIGURE 128. RESEARCH PROCESS OF MRFR

FIGURE 129. DRO ANALYSIS OF ELECTRIC VEHICLE FAST CHARGING SYSTEM MARKET

FIGURE 130. DRIVERS IMPACT ANALYSIS: ELECTRIC VEHICLE FAST CHARGING SYSTEM MARKET

FIGURE 131. RESTRAINTS IMPACT ANALYSIS: ELECTRIC VEHICLE FAST CHARGING SYSTEM MARKET

FIGURE 132. SUPPLY / VALUE CHAIN: ELECTRIC VEHICLE FAST CHARGING SYSTEM MARKET

FIGURE 133. ELECTRIC VEHICLE FAST CHARGING SYSTEM MARKET, BY CHARGING TYPE, 2025 (% SHARE)

FIGURE 134. ELECTRIC VEHICLE FAST CHARGING SYSTEM MARKET, BY CHARGING TYPE, 2019 TO 2035 (USD Billions)

FIGURE 135. ELECTRIC VEHICLE FAST CHARGING SYSTEM MARKET, BY CONNECTOR TYPE, 2025 (% SHARE)

FIGURE 136. ELECTRIC VEHICLE FAST CHARGING SYSTEM MARKET, BY CONNECTOR TYPE, 2019 TO 2035 (USD Billions)

FIGURE 137. ELECTRIC VEHICLE FAST CHARGING SYSTEM MARKET, BY END USER, 2025 (% SHARE)

FIGURE 138. ELECTRIC VEHICLE FAST CHARGING SYSTEM MARKET, BY END USER, 2019 TO 2035 (USD Billions)

FIGURE 139. ELECTRIC VEHICLE FAST CHARGING SYSTEM MARKET, BY POWER OUTPUT, 2025 (% SHARE)

FIGURE 140. ELECTRIC VEHICLE FAST CHARGING SYSTEM MARKET, BY POWER OUTPUT, 2019 TO 2035 (USD Billions)

FIGURE 141. ELECTRIC VEHICLE FAST CHARGING SYSTEM MARKET, BY REGIONAL, 2025 (% SHARE)

FIGURE 142. ELECTRIC VEHICLE FAST CHARGING SYSTEM MARKET, BY REGIONAL, 2019 TO 2035 (USD Billions)

FIGURE 143. BENCHMARKING OF MAJOR COMPETITORS

Leading companies partner with us for data-driven Insights.

clients

Kindly complete the form below to receive a free sample of this Report

We do not share your information with anyone. However, we may send you emails based on your report interest from time to time. You may contact us at any time to opt-out.

Tailored for You
  • Dedicated Research on any specifics segment or region.
  • Focused Research on specific players in the market.
  • Custom Report based only on your requirements.
  • Flexibility to add or subtract any chapter in the study.
  • Historic data from 2014 and forecasts outlook till 2040.
  • Flexibility of providing data/insights in formats (PDF, PPT, Excel).
  • Provide cross segmentation in applicable scenario/markets.
report-img