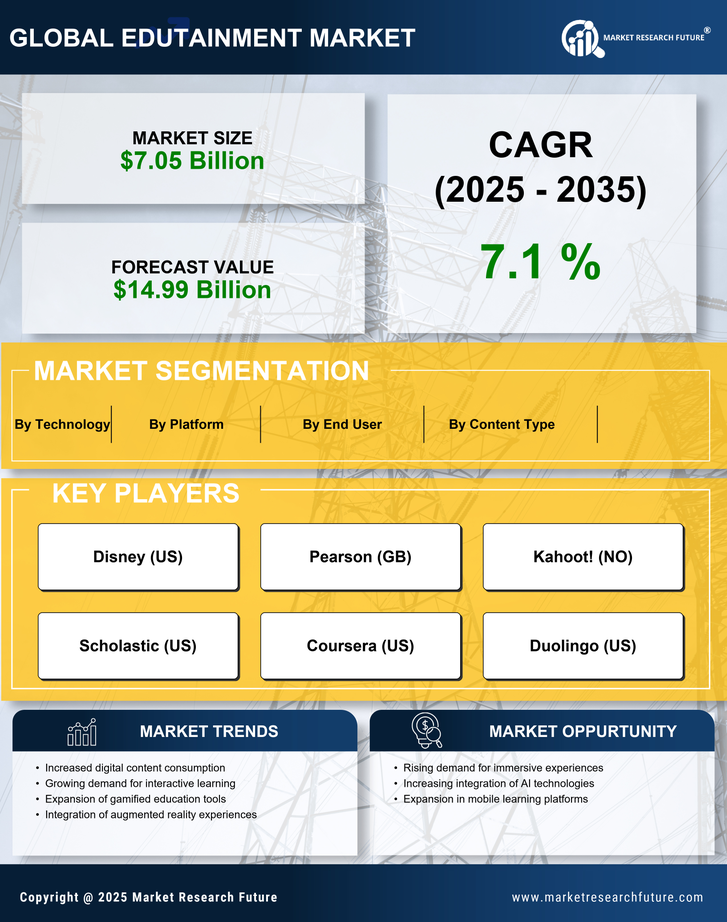
ID: MRFR/ICT/6819-HCR | 111 Pages | Author: Ankit Gupta | March 2024
Table of Contents
1. EXECUTIVE SUMMARY
1.1. Market Attractiveness Analysis
1.1.1. Global Edutainment Market, by Service Type
1.1.2. Global Edutainment Market, by Revenue Source
1.1.3. Global Edutainment Market, by End User
1.1.4. Global Edutainment Market, by Region
2. MARKET INTRODUCTION
2.1. Definition
2.2. Scope of the Study
2.3. Market Structure
2.4. Key Buying Criteria
2.5. Macro Factor Indicator Analysis
3. RESEARCH METHODOLOGY
3.1. Research Process
3.2. Primary Research
3.3. Secondary Research
3.4. Market Size Estimation
3.5. Forecast Model
3.6. List of Assumptions
4. MARKET DYNAMICS
4.1. Introduction
4.2. Drivers
4.2.1. Increasing Sales of Smartphones in Developing Countries
4.2.2. Rising Investments by Established Players in Edutainment Centers
4.3. Restraints
4.3.1. Limited Awareness about Edutainment Services
4.4. Opportunities
4.4.1. Use of Immersive Technology
5. MARKET FACTOR ANALYSIS
5.1. Value Chain Analysis/Supply Chain Analysis
5.2. Porter’s Five Forces Model
5.2.1. Bargaining Power of Suppliers
5.2.2. Bargaining Power of Buyers
5.2.3. Threat of New Entrants
5.2.4. Threat of Substitutes
5.2.5. Intensity of Rivalry
6. GLOBAL EDUTAINMENT MARKET, BY SERVICE TYPE
6.1. Introduction
6.2. Non-Interactive/Spectator Service
6.3. Interactive & Participatory Service
7. GLOBAL EDUTAINMENT MARKET, BY REVENUE SOURCE
7.1. Introduction
7.2. Advertising
7.3. Ticket Fees
7.4. Partnership
8. GLOBAL EDUTAINMENT MARKET, BY END USER
8.1. Introduction
8.2. Individuals
8.3. Schools
8.4. Universities
9. GLOBAL EDUTAINMENT MARKET, BY REGION
9.1. Introduction
9.2. North America
9.2.1. US
9.2.2. Canada
9.2.3. Mexico
9.3. Europe
9.3.1. Germany
9.3.2. France
9.3.3. UK
9.3.4. Rest of Europe
9.4. Asia-Pacific
9.4.1. China
9.4.2. India
9.4.3. Japan
9.4.4. Rest of Asia-Pacific
9.5. Middle East & Africa
9.6. South America
10. COMPETITIVE LANDSCAPE
10.1. Introduction
10.2. Competitive Analysis
11. COMPANY PROFILES
11.1. Brightcove Inc.
11.1.1. Company Overview
11.1.2. Financial Overview
11.1.3. Products Offered
11.1.4. Key Developments
11.1.5. SWOT Analysis
11.1.6. Key Strategies
11.2. Tata Sons Private Limited
11.2.1. Company Overview
11.2.2. Financial Overview
11.2.3. Products Offered
11.2.4. Key Developments
11.2.5. SWOT Analysis
11.2.6. Key Strategies
11.3. KNeoMedia Limited
11.3.1. Company Overview
11.3.2. Financial Overview
11.3.3. Products Offered
11.3.4. Key Developments
11.3.5. SWOT Analysis
11.3.6. Key Strategies
11.4. KidZania Operations S.A.R.L
11.4.1. Company Overview
11.4.2. Financial Overview
11.4.3. Products Offered
11.4.4. Key Developments
11.4.5. SWOT Analysis
11.4.6. Key Strategies
11.5. Kramer Electronics
11.5.1. Company Overview
11.5.2. Financial Overview
11.5.3. Products Offered
11.5.4. Key Developments
11.5.5. SWOT Analysis
11.5.6. Key Strategies
11.6. LEGOLAND Discovery Center
11.6.1. Company Overview
11.6.2. Financial Overview
11.6.3. Products Offered
11.6.4. Key Developments
11.6.5. SWOT Analysis
11.6.6. Key Strategies
11.7. Kaltura, Inc.
11.7.1. Company Overview
11.7.2. Financial Overview
11.7.3. Products Offered
11.7.4. Key Developments
11.7.5. SWOT Analysis
11.7.6. Key Strategies
11.8. Kidz Holding S.A.L.
11.8.1. Company Overview
11.8.2. Financial Overview
11.8.3. Products Offered
11.8.4. Key Developments
11.8.5. SWOT Analysis
11.8.6. Key Strategies
11.9. AEL Data Services LLP
11.9.1. Company Overview
11.9.2. Financial Overview
11.9.3. Products Offered
11.9.4. Key Developments
11.9.5. SWOT Analysis
11.9.6. Key Strategies
11.10. Meraas
11.10.1. Company Overview
11.10.2. Financial Overview
11.10.3. Products Offered
11.10.4. Key Developments
11.10.5. SWOT Analysis
11.10.6. Key Strategies
11.11. Reliance Jio Infocomm Limited
11.11.1. Company Overview
11.11.2. Financial Overview
11.11.3. Products Offered
11.11.4. Key Developments
11.11.5. SWOT Analysis
11.11.6. Key Strategies
11.12. d'Vinci Interactive, Inc.
11.12.1. Company Overview
11.12.2. Financial Overview
11.12.3. Products Offered
11.12.4. Key Developments
11.12.5. SWOT Analysis
11.12.6. Key Strategies
11.13. zSpace, Inc
11.13.1. Company Overview
11.13.2. Financial Overview
11.13.3. Products Offered
11.13.4. Key Developments
11.13.5. SWOT Analysis
11.13.6. Key Strategies
11.14. Time4Learning, Inc.
11.14.1. Company Overview
11.14.2. Financial Overview
11.14.3. Products Offered
11.14.4. Key Developments
11.14.5. SWOT Analysis
11.14.6. Key Strategie
12. APPENDIX
12.1.1. Discussion Blueprint
NOTE:
This table of content is tentative and subject to change as the research progresses.
ï‚¡ In section 14, only the top ten companies will be profiled. Each company will be profiled based on the market overview, financials, product portfolio, business strategies, and recent developments parameters.
ï‚¡ Please note: The financial details of the company cannot be provided if the information is not available in the public domain and or from reliable sources.
LIST OF TABLES
TABLE 1 LIST OF ASSUMPTIONS
TABLE 2 GLOBAL EDUTAINMENT MARKET, BY SERVICE TYPE, 2022-2030 (USD MILLION)
TABLE 3 GLOBAL EDUTAINMENT MARKET, BY REVENUE SOURCE, 2022-2030 (USD MILLION)
TABLE 4 GLOBAL EDUTAINMENT MARKET, BY END USER, 2022-2030 (USD MILLION)
TABLE 5 GLOBAL EDUTAINMENT MARKET, BY REGION, 2022-2030 (USD MILLION)
TABLE 6 NORTH AMERICA: EDUTAINMENT MARKET, BY COUNTRY, 2022-2030 (USD MILLION)
TABLE 7 NORTH AMERICA: EDUTAINMENT MARKET, BY SERVICE TYPE, 2022-2030 (USD MILLION)
TABLE 8 NORTH AMERICA: EDUTAINMENT MARKET, BY REVENUE SOURCE, 2022-2030 (USD MILLION)
TABLE 9 NORTH AMERICA: EDUTAINMENT MARKET, BY END USER, 2022-2030 (USD MILLION)
TABLE 10 US: EDUTAINMENT MARKET, BY SERVICE TYPE, 2022-2030 (USD MILLION)
TABLE 11 US: EDUTAINMENT MARKET, BY REVENUE SOURCE, 2022-2030 (USD MILLION)
TABLE 12 US: EDUTAINMENT MARKET, BY END USER, 2022-2030 (USD MILLION)
TABLE 13 CANADA: EDUTAINMENT MARKET, BY SERVICE TYPE, 2022-2030 (USD MILLION)
TABLE 14 CANADA: EDUTAINMENT MARKET, BY REVENUE SOURCE, 2022-2030 (USD MILLION)
TABLE 15 CANADA: EDUTAINMENT MARKET, BY I END USER, 2022-2030 (USD MILLION)
TABLE 16 MEXICO: EDUTAINMENT MARKET, BY SERVICE TYPE, 2022-2030 (USD MILLION)
TABLE 17 MEXICO: EDUTAINMENT MARKET, BY REVENUE SOURCE, 2022-2030 (USD MILLION)
TABLE 18 MEXICO: EDUTAINMENT MARKET, BY END USER, 2022-2030 (USD MILLION)
TABLE 19 EUROPE: EDUTAINMENT MARKET, BY COUNTRY, 2022-2030 (USD MILLION)
TABLE 20 EUROPE: EDUTAINMENT MARKET, BY SERVICE TYPE, 2022-2030 (USD MILLION)
TABLE 21 EUROPE: EDUTAINMENT MARKET, BY REVENUE SOURCE, 2022-2030 (USD MILLION)
TABLE 22 EUROPE: EDUTAINMENT MARKET, BY END USER, 2022-2030 (USD MILLION)
TABLE 23 UK: EDUTAINMENT MARKET, BY SERVICE TYPE, 2022-2030 (USD MILLION)
TABLE 24 UK: EDUTAINMENT MARKET, BY REVENUE SOURCE, 2022-2030 (USD MILLION)
TABLE 25 UK: EDUTAINMENT MARKET, BY END USER, 2022-2030 (USD MILLION)
TABLE 26 GERMANY: EDUTAINMENT MARKET, BY SERVICE TYPE, 2022-2030 (USD MILLION)
TABLE 27 GERMANY: EDUTAINMENT MARKET, BY REVENUE SOURCE, 2022-2030 (USD MILLION)
TABLE 28 GERMANY: EDUTAINMENT MARKET, BY END USER, 2022-2030 (USD MILLION)
TABLE 29 FRANCE: EDUTAINMENT MARKET, BY SERVICE TYPE, 2022-2030 (USD MILLION)
TABLE 30 FRANCE: EDUTAINMENT MARKET, BY REVENUE SOURCE, 2022-2030 (USD MILLION)
TABLE 31 FRANCE: EDUTAINMENT MARKET, BY END USER, 2022-2030 (USD MILLION)
TABLE 32REST OF EUROPE: EDUTAINMENT MARKET, BY SERVICE TYPE, 2022-2030 (USD MILLION)
TABLE 33REST OF EUROPE: EDUTAINMENT MARKET, BY REVENUE SOURCE, 2022-2030 (USD MILLION)
TABLE 34REST OF EUROPE: EDUTAINMENT MARKET, BY END USER, 2022-2030 (USD MILLION)
TABLE 35ASIA-PACIFIC: EDUTAINMENT MARKET, BY COUNTRY, 2022-2030 (USD MILLION)
TABLE 36ASIA-PACIFIC: EDUTAINMENT MARKET, BY SERVICE TYPE, 2022-2030 (USD MILLION)
TABLE 37ASIA-PACIFIC: EDUTAINMENT MARKET, BY REVENUE SOURCE, 2022-2030 (USD MILLION)
TABLE 38ASIA-PACIFIC: EDUTAINMENT MARKET, BY END USER, 2022-2030 (USD MILLION)
TABLE 39CHINA: EDUTAINMENT MARKET, BY SERVICE TYPE, 2022-2030 (USD MILLION)
TABLE 40CHINA: EDUTAINMENT MARKET, BY REVENUE SOURCE, 2022-2030 (USD MILLION)
TABLE 41CHINA: EDUTAINMENT MARKET, BY END USER, 2022-2030 (USD MILLION)
TABLE 42INDIA: EDUTAINMENT MARKET, BY SERVICE TYPE, 2022-2030 (USD MILLION)
TABLE 43INDIA: EDUTAINMENT MARKET, BY REVENUE SOURCE, 2022-2030 (USD MILLION)
TABLE 44INDIA: EDUTAINMENT MARKET, BY END USER, 2022-2030 (USD MILLION)
TABLE 45JAPAN: EDUTAINMENT MARKET, BY SERVICE TYPE, 2022-2030 (USD MILLION)
TABLE 46JAPAN: EDUTAINMENT MARKET, BY REVENUE SOURCE, 2022-2030 (USD MILLION)
TABLE 47JAPAN: EDUTAINMENT MARKET, BY END USER, 2022-2030 (USD MILLION)
TABLE 48REST OF ASIA-PACIFIC: EDUTAINMENT MARKET, BY SERVICE TYPE, 2022-2030 (USD MILLION)
TABLE 49REST OF ASIA-PACIFIC: EDUTAINMENT MARKET, BY REVENUE SOURCE, 2022-2030 (USD MILLION)
TABLE 50REST OF ASIA–PACIFIC: EDUTAINMENT MARKET, BY END USER, 2022-2030 (USD MILLION)
TABLE 51MIDDLE EAST & AFRICA: EDUTAINMENT MARKET, BY SERVICE TYPE, 2022-2030 (USD MILLION)
TABLE 52MIDDLE EAST & AFRICA: EDUTAINMENT MARKET, BY REVENUE SOURCE, 2022-2030 (USD MILLION)
TABLE 53MIDDLE EAST & AFRICA: EDUTAINMENT MARKET, BY END USER, 2022-2030 (USD MILLION)
TABLE 54SOUTH AMERICA: EDUTAINMENT MARKET, BY SERVICE TYPE, 2022-2030 (USD MILLION)
TABLE 55SOUTH AMERICA: EDUTAINMENT MARKET, BY REVENUE SOURCE, 2022-2030 (USD MILLION)
TABLE 56SOUTH AMERICA: EDUTAINMENT MARKET, BY END USER, 2022-2030 (USD MILLION)
LIST OF FIGURES
FIGURE 1MARKET SYNOPSIS
FIGURE 2RESEARCH PROCESS OF MRFR
FIGURE 3TOP DOWN & BOTTOM–UP APPROACHES
FIGURE 4GLOBAL EDUTAINMENT MARKET, BY SERVICE TYPE, 2022-2030 (USD MILLION)
FIGURE 5GLOBAL EDUTAINMENT MARKET, BY REVENUE SOURCE, 2022-2030 (USD MILLION)
FIGURE 6GLOBAL EDUTAINMENT MARKET, BY END USER, 2022-2030 (USD MILLION)
FIGURE 7GLOBAL EDUTAINMENT MARKET, BY REGION, 2022-2030 (USD MILLION))
FIGURE 8NORTH AMERICA: EDUTAINMENT MARKET, BY COUNTRY, 2022-2030 (USD MILLION)
FIGURE 9NORTH AMERICA: EDUTAINMENT MARKET, BY SERVICE TYPE, 2022-2030 (USD MILLION)
FIGURE 10NORTH AMERICA: EDUTAINMENT MARKET, BY REVENUE SOURCE, 2022-2030 (USD MILLION)
FIGURE 11NORTH AMERICA: EDUTAINMENT MARKET, BY END USER, 2022-2030 (USD MILLION)
FIGURE 12EUROPE: EDUTAINMENT MARKET, BY COUNTRY, 2022-2030 (USD MILLION)
FIGURE 13EUROPE: EDUTAINMENT MARKET, BY SERVICE TYPE, 2022-2030 (USD MILLION)
FIGURE 14EUROPE: EDUTAINMENT MARKET, BY REVENUE SOURCE, 2022-2030 (USD MILLION)
FIGURE 15 EUROPE: EDUTAINMENT MARKET, BY END USER, 2022-2030 (USD MILLION)
FIGURE 16ASIA-PACIFIC: EDUTAINMENT MARKET, BY COUNTRY, 2022-2030 (USD MILLION)
FIGURE 17ASIA-PACIFIC: EDUTAINMENT MARKET, BY SERVICE TYPE, 2022-2030 (USD MILLION)
FIGURE 18ASIA-PACIFIC: EDUTAINMENT MARKET, BY REVENUE SOURCE, 2022-2030 (USD MILLION)
FIGURE 19ASIA-PACIFIC: EDUTAINMENT MARKET, BY END USER, 2022-2030 (USD MILLION)
FIGURE 20MIDDLE EAST & AFRICA: EDUTAINMENT MARKET, BY SERVICE TYPE, 2022-2030 (USD MILLION)
FIGURE 21MIDDLE EAST & AFRICA: EDUTAINMENT MARKET, BY REVENUE SOURCE, 2022-2030 (USD MILLION)
FIGURE 22MIDDLE EAST & AFRICA: EDUTAINMENT MARKET, BY END USER, 2022-2030 (USD MILLION)
FIGURE 23SOUTH AMERICA: EDUTAINMENT MARKET, BY SERVICE TYPE, 2022-2030 (USD MILLION)
FIGURE 24SOUTH AMERICA: EDUTAINMENT MARKET, BY REVENUE SOURCE, 2022-2030 (USD MILLION)
FIGURE 25SOUTH AMERICA: EDUTAINMENT MARKET, BY END USER, 2022-2030 (USD MILLION)
Edutainment Market Segmentation
Edutainment Service Type Outlook (USD Million, 2018-2030)
Non-Interactive/Spectator Service
Interactive/Participatory Service
Edutainment Revenue Source Outlook (USD Million, 2018-2030)
Advertising
Ticket Fees
Partnership
Edutainment End User Outlook (USD Million, 2018-2030)
Individuals
Schools
Universities
Edutainment Regional Outlook (USD Million, 2018-2030)
North America Outlook (USD Million, 2018-2030)
North America Edutainment by Service Type
Non-Interactive/Spectator Service
Interactive/Participatory Service
North America Edutainment by Revenue Source
Advertising
Ticket Fees
Partnership
North America Edutainment by End User
Individuals
Schools
Universities
US Outlook (USD Million, 2018-2030)
US Edutainment by Service Type
Non-Interactive/Spectator Service
Interactive/Participatory Service
US Edutainment by Revenue Source
Advertising
Ticket Fees
Partnership
US Edutainment by End User
Individuals
Schools
Universities
CANADA Outlook (USD Million, 2018-2030)
CANADA Edutainment by Service Type
Non-Interactive/Spectator Service
Interactive/Participatory Service
CANADA Edutainment by Revenue Source
Advertising
Ticket Fees
Partnership
CANADA Edutainment by End User
Individuals
Schools
Universities
Europe Outlook (USD Million, 2018-2030)
Europe Edutainment by Service Type
Non-Interactive/Spectator Service
Interactive/Participatory Service
Europe Edutainment by Revenue Source
Advertising
Ticket Fees
Partnership
Europe Edutainment by End User
Individuals
Schools
Universities
Germany Outlook (USD Million, 2018-2030)
Germany Edutainment by Service Type
Non-Interactive/Spectator Service
Interactive/Participatory Service
Germany Edutainment by Revenue Source
Advertising
Ticket Fees
Partnership
Germany Edutainment by End User
Individuals
Schools
Universities
France Outlook (USD Million, 2018-2030)
France Edutainment by Service Type
Non-Interactive/Spectator Service
Interactive/Participatory Service
France Edutainment by Revenue Source
Advertising
Ticket Fees
Partnership
France Edutainment by End User
Individuals
Schools
Universities
UK Outlook (USD Million, 2018-2030)
UK Edutainment by Service Type
Non-Interactive/Spectator Service
Interactive/Participatory Service
UK Edutainment by Revenue Source
Advertising
Ticket Fees
Partnership
UK Edutainment by End User
Individuals
Schools
Universities
ITALY Outlook (USD Million, 2018-2030)
ITALY Edutainment by Service Type
Non-Interactive/Spectator Service
Interactive/Participatory Service
ITALY Edutainment by Revenue Source
Advertising
Ticket Fees
Partnership
ITALY Edutainment by End User
Individuals
Schools
Universities
SPAIN Outlook (USD Million, 2018-2030)
Spain Edutainment by Service Type
Non-Interactive/Spectator Service
Interactive/Participatory Service
Spain Edutainment by Revenue Source
Advertising
Ticket Fees
Partnership
Spain Edutainment by End User
Individuals
Schools
Universities
Rest Of Europe Outlook (USD Million, 2018-2030)
Rest Of Europe Edutainment by Service Type
Non-Interactive/Spectator Service
Interactive/Participatory Service
REST OF EUROPE Edutainment by Revenue Source
Advertising
Ticket Fees
Partnership
REST OF EUROPE Edutainment by End User
Individuals
Schools
Universities
Asia-Pacific Outlook (USD Million, 2018-2030)
Asia-Pacific Edutainment by Service Type
Non-Interactive/Spectator Service
Interactive/Participatory Service
Asia-Pacific Edutainment by Revenue Source
Advertising
Ticket Fees
Partnership
Asia-Pacific Edutainment by End User
Individuals
Schools
Universities
China Outlook (USD Million, 2018-2030)
China Edutainment by Service Type
Non-Interactive/Spectator Service
Interactive/Participatory Service
China Edutainment by Revenue Source
Advertising
Ticket Fees
Partnership
China Edutainment by End User
Individuals
Schools
Universities
Japan Outlook (USD Million, 2018-2030)
Japan Edutainment by Service Type
Non-Interactive/Spectator Service
Interactive/Participatory Service
Japan Edutainment by Revenue Source
Advertising
Ticket Fees
Partnership
Japan Edutainment by End User
Individuals
Schools
Universities
India Outlook (USD Million, 2018-2030)
India Edutainment by Service Type
Non-Interactive/Spectator Service
Interactive/Participatory Service
India Edutainment by Revenue Source
Advertising
Ticket Fees
Partnership
India Edutainment by End User
Individuals
Schools
Universities
Australia Outlook (USD Million, 2018-2030)
Australia Edutainment by Service Type
Non-Interactive/Spectator Service
Interactive/Participatory Service
Australia Edutainment by Revenue Source
Advertising
Ticket Fees
Partnership
Australia Edutainment by End User
Individuals
Schools
Universities
Rest of Asia-Pacific Outlook (USD Million, 2018-2030)
Rest of Asia-Pacific Edutainment by Service Type
Non-Interactive/Spectator Service
Interactive/Participatory Service
Rest of Asia-Pacific Edutainment by Revenue Source
Advertising
Ticket Fees
Partnership
Rest of Asia-Pacific Edutainment by End User
Individuals
Schools
Universities
Rest of the World Outlook (USD Million, 2018-2030)
Rest of the World Edutainment by Service Type
Non-Interactive/Spectator Service
Interactive/Participatory Service
Rest of the World Edutainment by Revenue Source
Advertising
Ticket Fees
Partnership
Rest of the World Edutainment by End User
Individuals
Schools
Universities
Middle East Outlook (USD Million, 2018-2030)
Middle East Edutainment by Service Type
Non-Interactive/Spectator Service
Interactive/Participatory Service
Middle East Edutainment by Revenue Source
Advertising
Ticket Fees
Partnership
Middle East Edutainment by End User
Individuals
Schools
Universities
Africa Outlook (USD Million, 2018-2030)
Africa Edutainment by Service Type
Non-Interactive/Spectator Service
Interactive/Participatory Service
Africa Edutainment by Revenue Source
Advertising
Ticket Fees
Partnership
Africa Edutainment by End User
Individuals
Schools
Universities
Latin America Outlook (USD Million, 2018-2030)
Latin America Edutainment by Service Type
Non-Interactive/Spectator Service
Interactive/Participatory Service
Latin America Edutainment by Revenue Source
Advertising
Ticket Fees
Partnership
Latin America Edutainment by End User
Individuals
Schools
Universities
Research Methodology on Edutainment Market
Abstract
This research report analyzes the current state of the edutainment market and its prospects for future growth. The research methodology includes a review of existing literature, interviews with key stakeholders in the edutainment industry, and primary data collection in the form of surveys with edutainment users and potential consumers. The objectives of the research are to identify key drivers and trends in the edutainment industry, understand perceptions and opinions on the edutainment market, and generate new insights and recommendations for the industry.
Introduction
Edutainment is an emerging format which combines education and entertainment in a package also known as educational entertainment. It is a digital platform that uses interactive technology and content to provide information that is both engaging and informative. Edutainment is increasingly being used in classrooms, business education, and home learning as an engaging way to learn and absorb new information.
This research investigates current trends and drivers in the edutainment market and their implications for stakeholders. The research methodology consists of a literature review, interviews with key stakeholders in the industry, and a survey of edutainment users and potential consumers.
Research Objectives
The objectives of this research are as follows:
Literature Review
The first step in the research process is a comprehensive review of the existing literature on the edutainment market, including published academic papers, industry reports and white papers, online articles and blogs, and any other relevant material. The literature review focuses on the current state of the market, trends, drivers, and the competitive landscape.
Interviews
Interviews are conducted with key stakeholders in the edutainment industry, including industry experts, edutainment content creators, investors, and edutainment users. The interviews are structured and semi-structured depending on the stakeholder and will focus on the topics of market size and growth, key trends and drivers, competitive landscape and opportunities, and other insights into the edutainment market. The interviews are recorded and transcribed for further analysis.
Survey
A survey is conducted with a representative sample of edutainment users and potential consumers. The survey is administered online and includes questions on the topics of edutainment usage, preferences, and opinions. The survey is designed to capture opinions on edutainment’s potential in different contexts and its strengths and weaknesses as an educational medium.
Analysis
The data collected from the literature review, interviews, and surveys are analyzed using both qualitative and quantitative techniques. The literature will be analyzed using qualitative techniques such as content analysis to identify key trends and drivers, and the interview and survey data will be analyzed using quantitative techniques such as descriptive statistics to generate insights and recommendations for the edutainment industry.
Conclusion
The proposed research provides an in-depth analysis of the edutainment market to identify key trends and drivers and generate new insights and recommendations for the industry. The research methodology includes a literature review, interviews with key stakeholders, and a survey of edutainment users and potential consumers. The results of the research will provide invaluable insights into the edutainment industry and its potential future prospects.