E paper Display Market Segmentation
E paper Display Market By Product Type (USD Billion, 2025-2035)
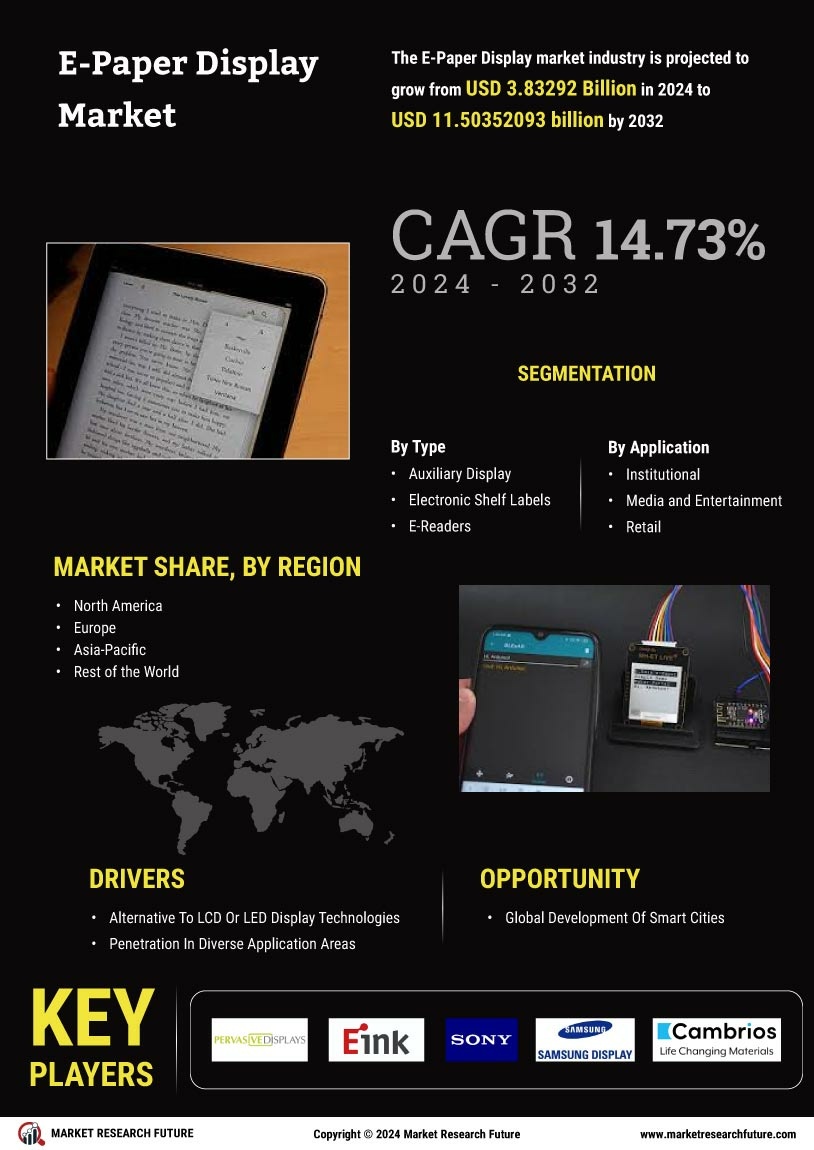
- Auxiliary Displays
- Electronic Shelf Labels
- E-Readers
- Others
E paper Display Market By Application (USD Billion, 2025-2035)
- Consumer and Wearable Electronics
- Institutional
- Media and Entertainment
- Retail
- Others