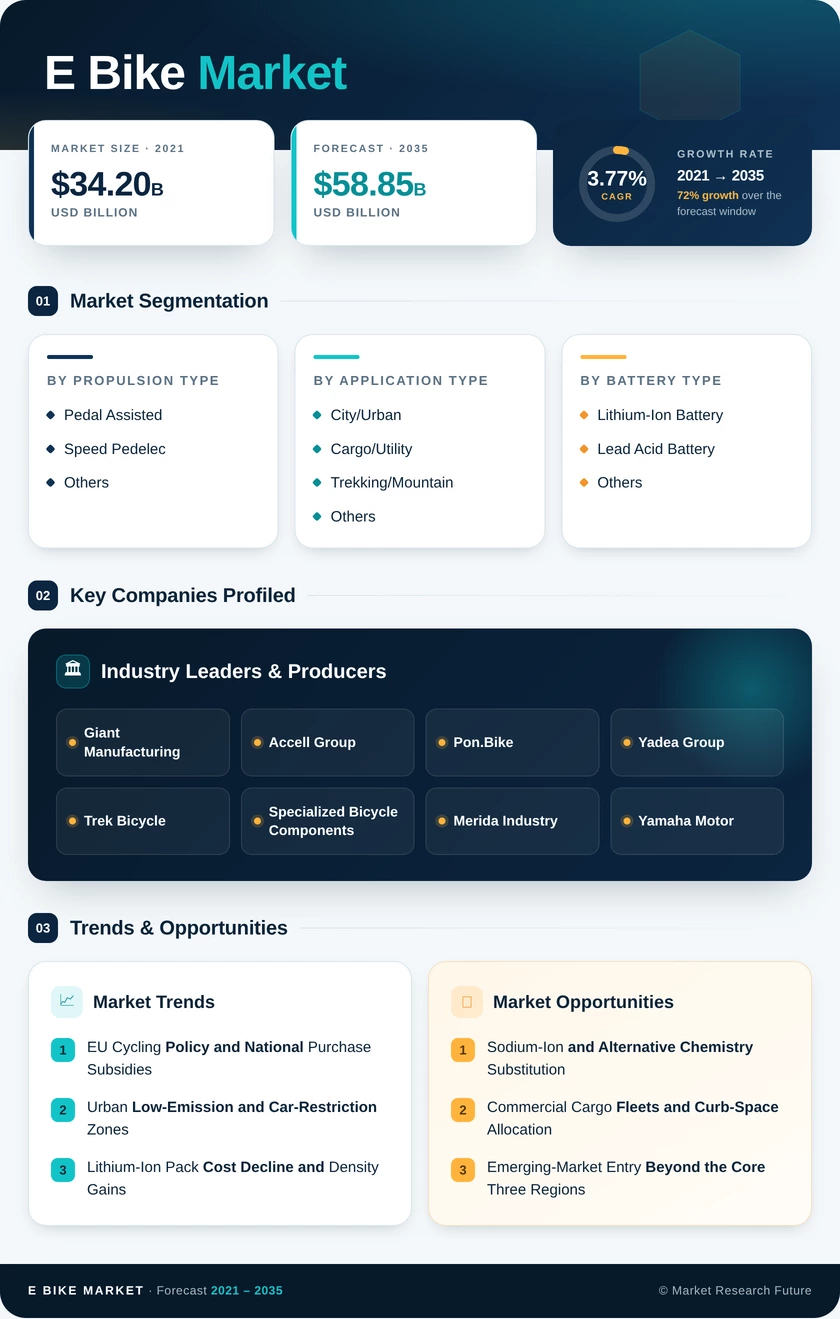
E-Bike Market (2026 - 2035)

ID: MRFR/AT/1344-HCR 110 Pages Shubham Munde Last Updated: October 16, 2026
E-Bike Market Research Report By Propulsion Type (Pedal Assisted, Speed Pedelec, Others), By Application Type (City/Urban, Cargo/Utility, Trekking/Mountain, Others), By Battery Type (Lithium-Ion Battery, Lead Acid Battery, Others), By Motor Placement (Hub (Front/Rear), Mid-Drive), By Drive Systems (Chain Drive, Belt Drive, Others), By Motor Power (Below 250 W, 250โ€“500 W, 501โ€“600 W, Above 600 W), By Price Band (Below USD 1,000, USD 1,000โ€“1,499, USD 1,500โ€“2,499, USD 2,500โ€“3,499, USD 3,500โ€“5,999, Above USD 6,000), By Sales Channel (Offline (Dealers and Specialty Stores), Online), By End Use (Personal/Family, Shared/Rental, Commercial/Delivery Fleets) - Forecast to 2035
E-Bike Market
Market Size
Forecast Period2026-2035
CAGR (2026-2035)3.77%
2025 Market SizeUSD 40.65 Billion
2035 Market SizeUSD 58.85 Billion
Key Players
Giant Manufacturing
Accell Group
Pon.Bike
Yadea Group
Trek Bicycle
Specialized Bicycle Components
Opportunities
  • Sodium-Ion and Alternative Chemistry Substitution
  • Commercial Cargo Fleets and Curb-Space Allocation
  • Emerging-Market Entry Beyond the Core Three Regions
  1. 1 Market Summary | |
    1. 1.1 Study Assumptions & Market Definition | |
    2. 1.2 Scope of the Study | |
    3. 1.3 Research Methodology | |
  2. 2 Key Report Takeaways | |
    1. 2.1 By Propulsion Type | |
    2. 2.2 By Application Type | |
    3. 2.3 By Battery Type | |
    4. 2.4 By Motor Placement | |
    5. 2.5 By Drive Systems | |
    6. 2.6 By Motor Power | |
    7. 2.7 By Price Band | |
    8. 2.8 By Sales Channel | |
    9. 2.9 By End Use | |
    10. 2.10 By Region | |
  3. 3 Market Size and Forecast (2021โ€“2035) | |
    1. 3.1 Historical Market Size (2021โ€“2024) | |
    2. 3.2 Base Year Assessment (2025) | |
    3. 3.3 Forecast Market Size (2026โ€“2035) | |
    4. 3.4 Year-over-Year Growth Analysis | |
  4. 4 Driver Impact Analysis | |
    1. 4.1 EU Cycling Policy and National Purchase Subsidies | |
    2. 4.2 Urban Low-Emission and Car-Restriction Zones | |
    3. 4.3 Lithium-Ion Pack Cost Decline and Density Gains | |
    4. 4.4 Commercial Last-Mile Fleet Electrification | |
    5. 4.5 Mid-Drive Torque and Connected Drivetrain Innovation | |
    6. 4.6 Corporate Lease and Salary-Sacrifice Programs | |
    7. 4.7 Tourism and Rental Fleet Conversion | |
  5. 5 Restraints Impact Analysis | |
    1. 5.1 Battery Fire Incidents and Tightening Certification | |
    2. 5.2 EU Anti-Dumping Duties and Tariff Escalation | |
    3. 5.3 Channel Inventory Overhang and Discounting | |
    4. 5.4 Theft Exposure and Secure Parking Deficits | |
    5. 5.5 Fragmented Speed and Power Classification | |
  6. 6 Opportunities | |
    1. 6.1 Sodium-Ion and Alternative Chemistry Substitution | |
    2. 6.2 Commercial Cargo Fleets and Curb-Space Allocation | |
    3. 6.3 Emerging-Market Entry Beyond the Core Three Regions | |
    4. 6.4 Connected Services and Battery-as-a-Service Monetisation | |
    5. 6.5 Speed-Pedelec Regulatory Opening for Suburban Corridors | |
  7. 7 Regional Market Share and Country-Level Analysis | |
    1. 7.1 North America | | |
      1. 7.1.1 US | | |
      2. 7.1.2 Canada | | |
      3. 7.1.3 Mexico | |
    2. 7.2 Europe | | |
      1. 7.2.1 Germany | | |
      2. 7.2.2 UK | | |
      3. 7.2.3 France | | |
      4. 7.2.4 Italy | | |
      5. 7.2.5 Spain | | |
      6. 7.2.6 Nordic Countries | | |
      7. 7.2.7 Russia | | |
      8. 7.2.8 Rest of Europe | |
    3. 7.3 Asia-Pacific | | |
      1. 7.3.1 China | | |
      2. 7.3.2 India | | |
      3. 7.3.3 Japan | | |
      4. 7.3.4 South Korea | | |
      5. 7.3.5 ASEAN | | |
      6. 7.3.6 Rest of Asia-Pacific | |
    4. 7.4 South America | | |
      1. 7.4.1 Brazil | | |
      2. 7.4.2 Argentina | | |
      3. 7.4.3 Rest of South America | |
    5. 7.5 Middle East & Africa | | |
      1. 7.5.1 Saudi Arabia | | |
      2. 7.5.2 UAE | | |
      3. 7.5.3 South Africa | | |
      4. 7.5.4 Egypt | | |
      5. 7.5.5 Rest of MEA | |
  8. 8 Future Outlook (2026โ€“2035) | |
    1. 8.1 Algorithmic Assist and Adaptive Drivetrains | |
    2. 8.2 Battery Supply Chain Localisation | |
    3. 8.3 Platform Economics and Subscription Models | |
    4. 8.4 Circularity and ESG Reporting Obligations | |
  9. 9 Segmentation Analysis | |
    1. 9.1 By Propulsion Type | | |
      1. 9.1.1 Pedal Assisted | | |
      2. 9.1.2 Speed Pedelec | | |
      3. 9.1.3 Others | |
    2. 9.2 By Application Type | | |
      1. 9.2.1 City/Urban | | |
      2. 9.2.2 Cargo/Utility | | |
      3. 9.2.3 Trekking/Mountain | | |
      4. 9.2.4 Others | |
    3. 9.3 By Battery Type | | |
      1. 9.3.1 Lithium-Ion Battery | | |
      2. 9.3.2 Lead Acid Battery | | |
      3. 9.3.3 Others | |
    4. 9.4 By Motor Placement | | |
      1. 9.4.1 Hub (Front/Rear) | | |
      2. 9.4.2 Mid-Drive | |
    5. 9.5 By Drive Systems | | |
      1. 9.5.1 Chain Drive | | |
      2. 9.5.2 Belt Drive | | |
      3. 9.5.3 Others | |
    6. 9.6 By Motor Power | | |
      1. 9.6.1 Below 250 W | | |
      2. 9.6.2 250โ€“500 W | | |
      3. 9.6.3 501โ€“600 W | | |
      4. 9.6.2 Above 600 W | |
    7. 9.7 By Price Band | | |
      1. 9.7.1 Below USD 1,000 | | |
      2. 9.7.2 USD 1,000โ€“1,499 | | |
      3. 9.7.3 USD 1,500โ€“2,499 | | |
      4. 9.7.4 USD 2,500โ€“3,499 | | |
      5. 9.7.5 USD 3,500โ€“5,999 | | |
      6. 9.7.6 Above USD 6,000 | |
    8. 9.8 By Sales Channel | | |
      1. 9.8.1 Offline (Dealers and Specialty Stores) | | |
      2. 9.8.2 Online | |
    9. 9.9 By End Use | | |
      1. 9.9.1 Personal/Family | | |
      2. 9.9.2 Shared/Rental | | |
      3. 9.9.3 Commercial/Delivery Fleets | |
  10. 10 Competitive Landscape | |
    1. 10.1 Market Concentration Analysis | |
    2. 10.2 Competitive Benchmarking Matrix | |
    3. 10.3 Company Profiles | |
  11. 11 Recent News and Developments | |
  12. 12 Report Scope and Methodology | |
  13. 13 Detailed Sources and Citations | |
  14. 14 Frequently Asked Questions (FAQs) | | LIST OF TABLES | |
  15. TABLE 1 Global Market Size & Forecast by Revenue (USD Billion), 2021โ€“2035 | |
  16. TABLE 2 Year-over-Year Growth Analysis, 2021โ€“2035 | |
  17. TABLE 3 Driver Impact Assessment Matrix, 2026โ€“2035 | |
  18. TABLE 4 Restraint Impact Assessment Matrix, 2026โ€“2035 | |
  19. TABLE 5 Regional Summary โ€” Share, Value and Growth, 2025 | |
  20. TABLE 6 North America Country-Level Breakdown, 2025 | |
  21. TABLE 7 Europe Country-Level Breakdown, 2025 | |
  22. TABLE 8 Asia-Pacific Country-Level Breakdown, 2025 | |
  23. TABLE 9 South America Country-Level Breakdown, 2025 | |
  24. TABLE 10 Middle East & Africa Country-Level Breakdown, 2025 | |
  25. TABLE 11 Size by Propulsion Type, 2021โ€“2035 (USD Billion) | |
  26. TABLE 12 Size by Application Type, 2021โ€“2035 (USD Billion) | |
  27. TABLE 13 Size by Battery Type, 2021โ€“2035 (USD Billion) | |
  28. TABLE 14 Size by Motor Placement, 2021โ€“2035 (USD Billion) | |
  29. TABLE 15 Size by Drive Systems, 2021โ€“2035 (USD Billion) | |
  30. TABLE 16 Size by Motor Power, 2021โ€“2035 (USD Billion) | |
  31. TABLE 17 Size by Price Band, 2021โ€“2035 (USD Billion) | |
  32. TABLE 18 Size by Sales Channel, 2021โ€“2035 (USD Billion) | |
  33. TABLE 19 Size by End Use, 2021โ€“2035 (USD Billion) | |
  34. TABLE 20 Competitive Benchmarking Matrix, 2026 | |
  35. TABLE 21 Company Profiles โ€” Key Players | |
  36. TABLE 22 Recent Developments & Strategic Announcements, 2023โ€“2025 | |
  37. TABLE 23 Report Scope & Methodology Summary | |
  38. TABLE 24 Detailed Sources and Citations | | LIST OF FIGURES | |
  39. FIGURE 1 Market Dynamics โ€” Drivers, Restraints and Opportunities | |
  40. FIGURE 2 Industry Value Chain Analysis | |
  41. FIGURE 3 Porter's Five Forces Assessment | |
  42. FIGURE 4 Market Size Trend and Forecast Curve, 2021โ€“2035 | |
  43. FIGURE 5 Year-over-Year Growth Trajectory, 2022โ€“2035 | |
  44. FIGURE 6 Share by Propulsion Type, 2025 | |
  45. FIGURE 7 Share by Application Type, 2025 | |
  46. FIGURE 8 Share by Battery Type, 2025 | |
  47. FIGURE 9 Share by Motor Placement, 2025 | |
  48. FIGURE 10 Share by Drive Systems, 2025 | |
  49. FIGURE 11 Share by Motor Power, 2025 | |
  50. FIGURE 12 Share by Price Band, 2025 | |
  51. FIGURE 13 Share by Sales Channel, 2025 | |
  52. FIGURE 14 Share by End Use, 2025 | |
  53. FIGURE 15 Regional Revenue Share, 2025 | |
  54. FIGURE 16 Regional CAGR Comparison, 2026โ€“2035 | |
  55. FIGURE 17 Europe Country-Level Share Distribution, 2025 | |
  56. FIGURE 18 Asia-Pacific Country-Level Share Distribution, 2025 | |
  57. FIGURE 19 Competitive Landscape โ€” Estimated Revenue Share Bands, 2026 | |
  58. FIGURE 20 Strategic Positioning Map โ€” Scale vs. Premium Focus, 2026

Segmentation Quick Reference

DimensionSub-SegmentsDominant SegmentFastest Growing Segment
By Propulsion TypePedal Assisted; Speed Pedelec; OthersPedal Assisted (73.4% share)Speed Pedelec (4.30% CAGR)
By Application TypeCity/Urban; Cargo/Utility; Trekking/Mountain; OthersCity/Urban (70.7% share)Trekking/Mountain (3.91% CAGR)
By Battery TypeLithium-Ion Battery; Lead Acid Battery; OthersLithium-Ion Battery (91.5% share)Others (4.62% CAGR)
By Motor PlacementHub (Front/Rear); Mid-DriveHub (Front/Rear) (60.1% share)Mid-Drive (5.28% CAGR)
By Drive SystemsChain Drive; Belt Drive; OthersChain Drive (71.2% share)Belt Drive (5.55% CAGR)
By Motor PowerBelow 250 W; 250โ€“500 W; 501โ€“600 W; Above 600 WBelow 250 W (54.4% share)501โ€“600 W (5.06% CAGR)
By Price BandBelow USD 1,000; USD 1,000โ€“1,499; USD 1,500โ€“2,499; USD 2,500โ€“3,499; USD 3,500โ€“5,999; Above USD 6,000USD 1,000โ€“1,499 (27.5% share)USD 3,500โ€“5,999 (5.94% CAGR)
By Sales ChannelOffline (Dealers and Specialty Stores); OnlineOffline (Dealers and Specialty Stores) (67.3% share)Online (7.08% CAGR)
By End UsePersonal/Family; Shared/Rental; Commercial/Delivery FleetsPersonal/Family (57.3% share)Commercial/Delivery Fleets (6.37% CAGR)
By RegionNorth America; Europe; Asia-Pacific; South America; Middle East & AfricaEurope (42.5% share)North America (4.21% CAGR)

ย 

Market Segmentation Overview

By Propulsion Type

Sub-SegmentKey Trend
Pedal AssistedBicycle-equivalent classification keeps registration and insurance obligations off the buyer.
Speed Pedelec45 km/h assistance targets 15โ€“25 km suburban corridors where car parity is achievable
OthersThrottle-operated units retain value where local rules permit non-pedal actuation.

ย 

Pedal-assisted leads on 73.4% share because EU type approval treats it as an ordinary bicycle, which removes every administrative barrier a casual buyer would otherwise face. Speed Pedelec grows fastest at 4.30% CAGR despite carrying registration, insurance, and helmet requirements, since the time saving on longer suburban commutes justifies the paperwork for daily riders. The Others group stays regionally confined because throttle actuation is legal in parts of North America and Asia but not in mainstream European configurations.

By Application Type

Sub-SegmentKey Trend
City/UrbanLow-emission zone enforcement converts commuting into a cost-avoidance decision.
Cargo/UtilityMunicipal curb-space allocation supports fleet-scale logistics procurement.
Trekking/MountainTour operators standardise on assisted fleets for mixed-fitness groups.
OthersFolding and specialty builds serve transit-integrated and storage-constrained riders.

ย 

City/Urban holds the clear lead because commuting is the single largest recurring use case, and low-emission zone enforcement converts that use case into a financial decision. Trekking/Mountain grows faster than the category average as guided tour operators standardise on assisted fleets to accommodate mixed-fitness groups. Cargo/Utility remains smaller in revenue but carries the highest average selling price and the strongest attach rate for service contracts.

By Battery Type

Sub-SegmentKey Trend
Lithium-Ion BatteryPack prices near USD 115/kWh redeployed into larger usable capacity
Lead Acid BatteryPersists only where replacement cost outweighs weight and cycle-life penalties
OthersSodium-ion and early solid-state cells entering limited commercial production

ย 

Lithium-Ion Battery is effectively the default at 91.5% share, and continued cell deflation has been spent on range rather than price, which directly addresses the objection that historically blocked


ย 

ย 

ย 

ย 

ย 

ย 

ย 

ย 

Download PDF ×

We do not share your information with anyone. However, we may send you emails based on your report interest from time to time. You may contact us at any time to opt-out.