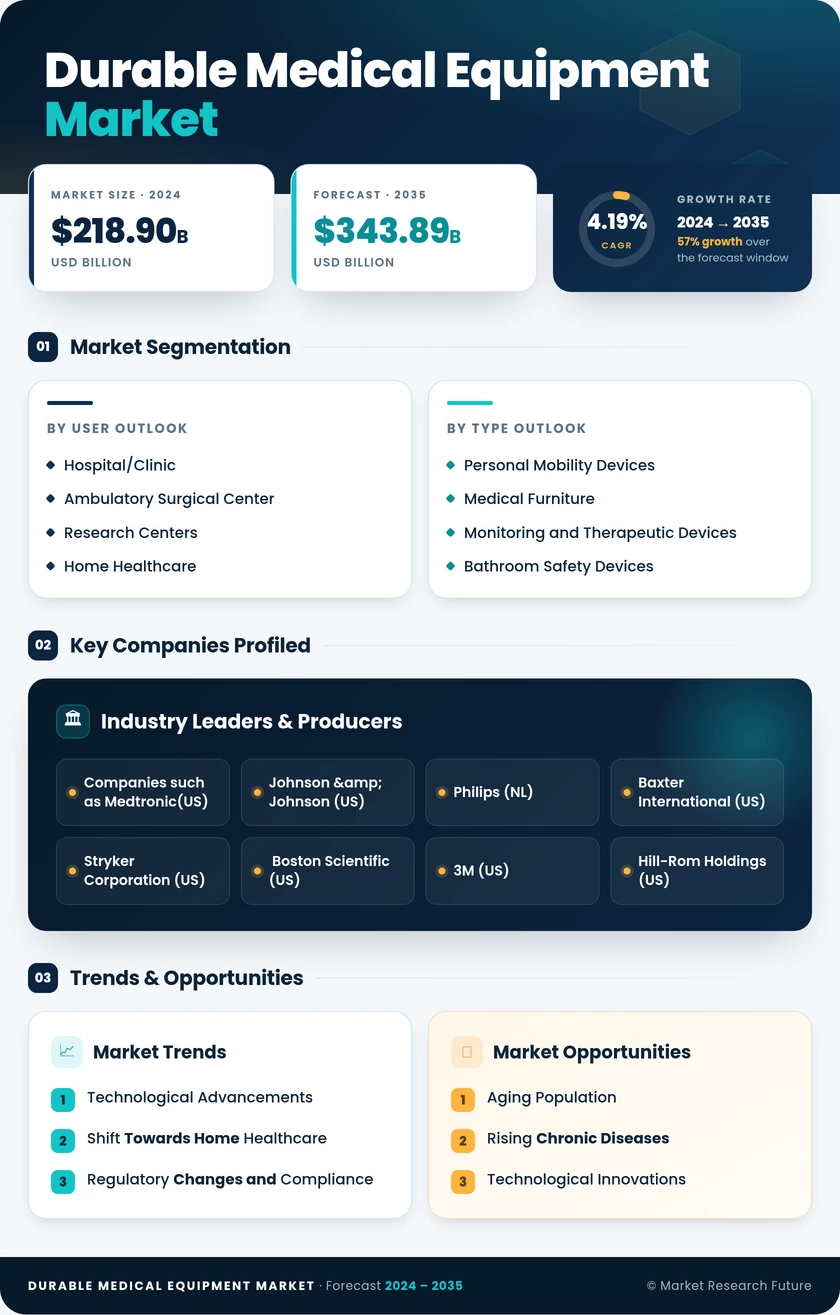
Durable Medical Equipment Market (2026 - 2035)

ID: MRFR/MED/1989-HCR 55 Pages Satyendra Maurya Last Updated: September 15, 2026
Durable Medical Equipment Market Research Report: Size, Share, Trend Analysis By Device Type (Personal Mobility Devices, Medical Furniture, Monitoring and Therapeutic Devices, And Bathroom Safety Devices), By End Userss (Hospital/Clinic, Ambulatory Surgical Center, Research Centers, And Home Healthcare), And By Region (North America, Europe, Asia-Pacific, And Rest Of The World) - Growth Outlook & Industry Forecast 2025 To 2035
Durable Medical Equipment Market
Market Size
Forecast Period2026-2035
CAGR (2026-2035)5.80%
2025 Market SizeUSD 246.90 Billion
2035 Market SizeUSD 433.70 Billion
Key Players
ResMed
Baxter International
Medline Industries
Philips
Stryker
Invacare Holdings
Opportunities
  • Device Telemetry as a Recurring Revenue Stream
  • Emerging-Market Coverage Gaps
  • Equipment-as-a-Service Contracting
  1. 1 Market Summary | |
    1. 1.1 Study Assumptions & Market Definition | |
    2. 1.2 Scope of the Study | |
    3. 1.3 Research Methodology | |
  2. 2 Key Report Takeaways | |
    1. 2.1 By Device Type | |
    2. 2.2 By End-User | |
    3. 2.3 By Distribution Channel | |
    4. 2.4 By Region | |
  3. 3 Market Size and Forecast (2021–2035) | |
    1. 3.1 Historical Market Size (2021–2024) | |
    2. 3.2 Base Year Assessment (2025) | |
    3. 3.3 Forecast Market Size (2026–2035) | |
    4. 3.4 Year-over-Year Growth Analysis | |
  4. 4 Driver Impact Analysis | |
    1. 4.1 Aging Demographics and Chronic Disease Prevalence | |
    2. 4.2 Reimbursement Expansion for Home-Based Care | |
    3. 4.3 Connected Device and Remote Monitoring Adoption | |
    4. 4.4 Asia-Pacific Public Insurance Coverage Expansion | |
    5. 4.5 Hospital-at-Home and Post-Acute Capacity Shifts | |
    6. 4.6 E-Commerce and Direct-to-Patient Fulfillment | |
    7. 4.7 Rental and Subscription Ownership Models | |
  5. 5 Restraints Impact Analysis | |
    1. 5.1 Competitive Bidding and Reference Pricing Compression | |
    2. 5.2 Component Cost and Supply Chain Volatility | |
    3. 5.3 Reimbursement Documentation and Audit Burden | |
    4. 5.4 Product Recalls and Regulatory Scrutiny | |
    5. 5.5 Service Technician and Fitting Capacity Shortages | |
  6. 6 Opportunities | |
    1. 6.1 Device Telemetry as a Recurring Revenue Stream | |
    2. 6.2 Emerging-Market Coverage Gaps | |
    3. 6.3 Equipment-as-a-Service Contracting | |
    4. 6.4 Refurbishment and Circular Equipment Programs | |
    5. 6.5 Retail-Clinic Convergence | |
  7. 7 Regional Market Share and Country-Level Analysis | |
    1. 7.1 North America | | |
      1. 7.1.1 United States | | |
      2. 7.1.2 Canada | |
    2. 7.2 Europe | | |
      1. 7.2.1 Germany | | |
      2. 7.2.2 United Kingdom | | |
      3. 7.2.3 France | | |
      4. 7.2.4 Rest of Europe | |
    3. 7.3 Asia-Pacific | | |
      1. 7.3.1 China | | |
      2. 7.3.2 Japan | | |
      3. 7.3.3 India | | |
      4. 7.3.4 Rest of Asia-Pacific | |
    4. 7.4 South America | | |
      1. 7.4.1 Brazil | | |
      2. 7.4.2 Rest of South America | |
    5. 7.5 Middle East & Africa | | |
      1. 7.5.1 Saudi Arabia | | |
      2. 7.5.2 United Arab Emirates | | |
      3. 7.5.3 South Africa | | |
      4. 7.5.4 Rest of Middle East & Africa | |
  8. 8 Future Outlook (2026–2035) | |
    1. 8.1 Predictive Maintenance and Embedded Intelligence | |
    2. 8.2 Platform Economics and Subscription Pricing | |
    3. 8.3 Interoperability and Data Standards | |
    4. 8.4 Sustainability and Circular Product Design | |
  9. 9 Segmentation Analysis | |
    1. 9.1 By Device Type | | |
      1. 9.1.1 Personal Mobility Devices | | |
      2. 9.1.2 Bathroom Safety Devices & Medical Furniture | | |
      3. 9.1.3 Monitoring & Therapeutic Devices | |
    2. 9.2 By End-User | | |
      1. 9.2.1 Hospitals & Clinics | | |
      2. 9.2.2 Home-Healthcare Settings | | |
      3. 9.2.3 Ambulatory Surgery Centers | | |
      4. 9.2.4 Nursing Homes & Hospices | |
    3. 9.3 By Distribution Channel | | |
      1. 9.3.1 Hospital & Clinic Pharmacies | | |
      2. 9.3.2 Retail Pharmacies & DME Stores | | |
      3. 9.3.3 Online & Direct-to-Patient | |
  10. 10 Competitive Landscape | |
    1. 10.1 Market Concentration Analysis (2026) | |
    2. 10.2 Competitive Benchmarking Matrix | |
    3. 10.3 Company Profiles | |
  11. 11 Recent News and Developments | |
  12. 12 Report Scope and Methodology | |
  13. 13 Detailed Sources and Citations | |
  14. 14 Frequently Asked Questions | | LIST OF TABLES | |
  15. TABLE 1 Global Durable Medical Equipment Market Size & Forecast, by Revenue (USD Billion), 2021–2035 | |
  16. TABLE 2 Global Durable Medical Equipment Market – Year-over-Year Growth Analysis, 2021–2035 | |
  17. TABLE 3 Driver Impact Analysis Matrix, 2026–2035 | |
  18. TABLE 4 Restraint Impact Analysis Matrix, 2026–2035 | |
  19. TABLE 5 Global Market Size, by Region, 2021–2035 (USD Billion) | |
  20. TABLE 6 North America Market Size, by Country, 2021–2035 (USD Billion) | |
  21. TABLE 7 Europe Market Size, by Country, 2021–2035 (USD Billion) | |
  22. TABLE 8 Asia-Pacific Market Size, by Country, 2021–2035 (USD Billion) | |
  23. TABLE 9 South America Market Size, by Country, 2021–2035 (USD Billion) | |
  24. TABLE 10 Middle East & Africa Market Size, by Country, 2021–2035 (USD Billion) | |
  25. TABLE 11 Global Market Size, by Device Type, 2021–2035 (USD Billion) | |
  26. TABLE 12 Global Market Size, by End-User, 2021–2035 (USD Billion) | |
  27. TABLE 13 Global Market Size, by Distribution Channel, 2021–2035 (USD Billion) | |
  28. TABLE 14 Competitive Benchmarking Matrix, 2026 | |
  29. TABLE 15 Company Profiles – Key Players | |
  30. TABLE 16 Recent Developments & Strategic Announcements, 2023–2025 | |
  31. TABLE 17 Report Scope & Methodology Summary | |
  32. TABLE 18 Detailed Sources and Citations Index | | LIST OF FIGURES | |
  33. FIGURE 1 Market Dynamics Overview – Drivers, Restraints and Opportunities | |
  34. FIGURE 2 Industry Value Chain Analysis | |
  35. FIGURE 3 Porter's Five Forces Analysis | |
  36. FIGURE 4 Global Market Size Trend, 2021–2035 (USD Billion) | |
  37. FIGURE 5 Market Share by Device Type, 2025 vs 2035 | |
  38. FIGURE 6 Market Share by End-User, 2025 vs 2035 | |
  39. FIGURE 7 Market Share by Distribution Channel, 2025 vs 2035 | |
  40. FIGURE 8 Regional Revenue Share Distribution, 2025 | |
  41. FIGURE 9 Regional CAGR Comparison, 2026–2035 | |
  42. FIGURE 10 Competitive Landscape Positioning Map, 2026

Segmentation Quick Reference

DimensionSub-SegmentsDominant SegmentFastest Growing Segment
By Device TypePersonal Mobility Devices (Wheelchairs); Bathroom Safety Devices & Medical Furniture; Monitoring & Therapeutic DevicesMonitoring & Therapeutic Devices (41.1% share, 2025)Monitoring & Therapeutic Devices (41.1% share, 2025)
By End-UserHospitals & Clinics; Home-Healthcare Settings; Ambulatory Surgery Centers; Nursing Homes & HospicesHospitals & Clinics (57.0% share, 2025)Home-Healthcare Settings (10.5% CAGR, 2026–2035)
By Distribution ChannelHospital & Clinic Pharmacies; Retail Pharmacies & DME Stores; Online & Direct-to-PatientRetail Pharmacies & DME Stores (49.7% share, 2025)Online & Direct-to-Patient (12.6% CAGR, 2026–2035)


Market Segmentation Overview

By Device Type

Sub-SegmentKey Trend
Personal Mobility Devices (Wheelchairs)Power models add fall-detection and posture sensors to justify premium pricing
Bathroom Safety Devices & Medical FurnitureFall-prevention funding sustains volume, but low unit prices cap revenue growth
Monitoring & Therapeutic DevicesConnected respiratory and glucose hardware reimbursed through remote monitoring codes


Monitoring and therapeutic devices both lead this dimension and grow fastest within it, because payer codes for remote physiologic monitoring turn connected concentrators, CPAP systems, and sensors into recurring-revenue assets rather than one-time capital items. Personal mobility devices hold the second-largest revenue pool, with wheelchairs anchoring demand, yet growth is constrained by competitive bidding pressure on power chair reimbursement. Bathroom safety devices and medical furniture trail in growth despite steady placement volumes, since replacement cycles run seven to ten years and average selling prices resist inflation.

By End-User

Sub-SegmentKey Trend
Hospitals & ClinicsIntensive-care ventilators and high-acuity beds sustain the largest procurement base
Home-Healthcare SettingsReimbursement migration places hospital-grade hardware in residences
Ambulatory Surgery CentersMobile C-arms and compact ultrasound support same-day procedure volume
Nursing Homes & HospicesConnected beds and monitoring mats reduce penalized readmissions


Hospitals and clinics dominate this dimension on the strength of acuity: ventilators, surgical navigation platforms and specialty support surfaces cannot practically be sited elsewhere. Home-healthcare settings expand fastest because Medicare's hospital-at-home authority and Japan's long-term care insurance both pay for residential delivery of equipment that previously required admission. Ambulatory surgery centers and nursing homes occupy the middle, buying selectively against same-day throughput and readmission-penalty exposure respectively, which forces suppliers to design modular platforms serving very different service and power requirements.

By Distribution Channel

Sub-SegmentKey Trend
Hospital & Clinic PharmaciesDischarge-linked provisioning prioritizes speed over unit price
Retail Pharmacies & DME StoresIn-store assessment clinics defend share through fitting and setup services
Online & Direct-to-PatientSame-day delivery partnerships and self-pay purchasing drive fastest expansion


Retail pharmacies and DME stores lead this dimension because custom seating, mask fitting, and oxygen setup require trained hands and physical assessment that no shipping model replicates. Online and direct-to-patient channels grow fastest by a wide margin, helped by four-hour metropolitan fulfillment and by regulatory frameworks that permit compliant cross-border e-commerce within Europe. Hospital and clinic pharmacies sit between the two, valued for discharge speed rather than price, and their share holds steady as bed-capacity pressure keeps provisioning urgent.




Download PDF ×

We do not share your information with anyone. However, we may send you emails based on your report interest from time to time. You may contact us at any time to opt-out.