ID: MRFR/MED/5481-HCR | February 2021 | Region: Global | 90 pages
Market Scenario:
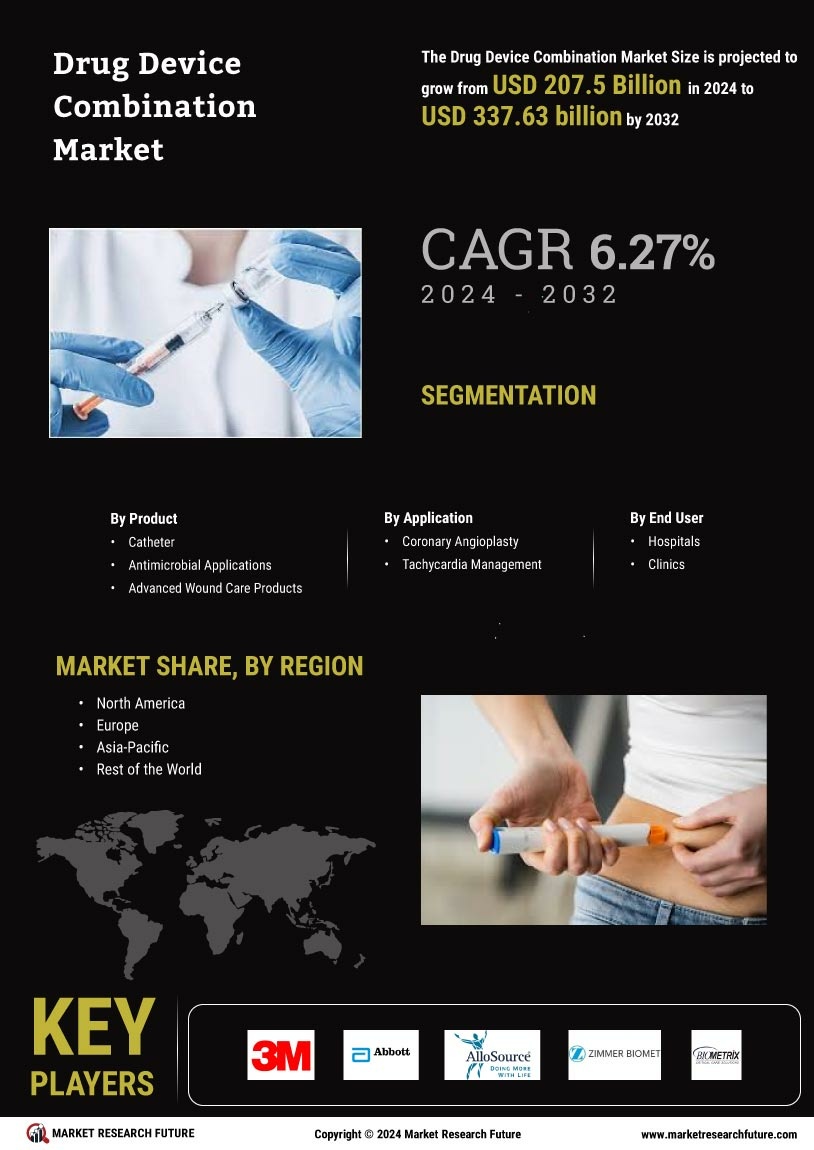
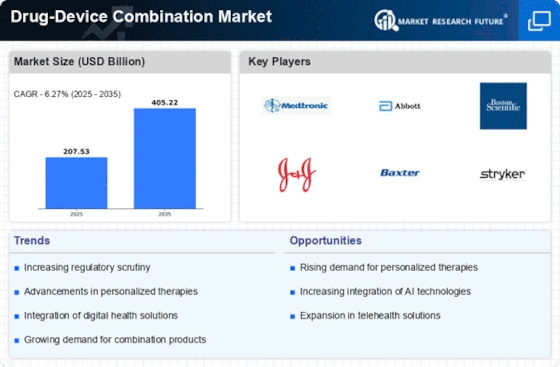
Global Drug Device Combination is expected to register a CAGR of 11.4% during the forecast period of 2018 to 2023.
In this market, products that comprises of more than two regulated components, i.e., drug and device are considered. Such devices are extensively utilized for therapeutic purposes against diseases like cardiovascular diseases. From the past few years, the global burden of the diseases like cardiovascular diseases, urology diseases, and others have increased. This provided suitable backgrounds for the market to develop and grow. According to the factsheet of 2017 published by the Centers for Disease Control and Prevention it was estimated that ~610,000 people within the U.S. die from heart diseases. Moreover, it is mentionable that from the past few years, the reported cases of urology diseases have increased. According to the cancer research UK, there were ~47,151 new cases of prostate cancer within the region. This is estimated to significantly increase the demand for drug devices for the related therapeutics, enabling the drug device combination market to grow.
Additionally, factors such as growing healthcare expenditure, rising awareness for the disease, and increasing R&D expenses by the key players drives the global drug device combination market. However, side effects, high cost of the products, and presence of low income countries within the developing regions restricts the market growth. It has been reported that products like Cypher causes thrombosis.
Segmentation:
The Global Drug Device Combination is segmented based on product, application, end user and region.Based on product, the market is segmented into catheter, advanced wound care products, and others. The catheter segment is sub-segmented into antimicrobial catheter, urological catheters, cardiovascular catheters, oximetry catheters, thermodilution catheters, wound drainage catheter, and others. The advanced wound care products segment is sub-divided into antibiotic wound care, bone graft substitutes, antibiotic bone cements, drug eluting stents, photodynamic therapy. The bone graft substitutes segment is sub-segmented into ceramic based bone graft substitute, allograft-based bone graft substitutes, cell-based bone graft substitutes, and others. On the basis of application, the market is devised into coronary angioplasty, tachycardia management, non-cardiovascular treatments, peripheral arterial disease (pad), bone treatment, antimicrobial applications, wound care, ophthalmic treatment, and others. By end user, the market is divided into hospitals & clinics, ambulatory centres, and academic & research organization, and others. In the current scope of the study, the above-mentioned segments are covered into the four global regions, namely- the Americas, Europe, Asia-Pacific and the Middle East & African region.
Regional Market Summary
Global Drug Device Combination Share (%), by Region, 2017
Sources:
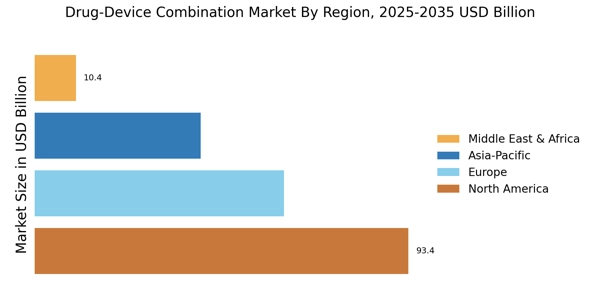
The Americas dominated the Global Market for Drug Device Combination products owing to rising prevalence of cardiovascular diseases and presence of major market players within the region. Additionally, suitable reimbursement policies, high healthcare expenditure, and developed healthcare sector in the U.S. and Canada boost the market to grow. In 2017, it was estimated that Europe stood second in the global drug device combination owing to the to the presence of a well-developed healthcare infrastructure, increasing awareness for the devices within the region and presence of developed economies within the region. Additionally, a large patient pool boosts the market.
Asia Pacific was projected to be the fastest growing region in 2017. This can be attributed due to the increasing penetration of the market players within the region, growing healthcare sector and increasing government support for foreign investments. According to a report published by the Indian Brand Equity Foundation in 2017, the Indian healthcare sector was estimated to grow at a CAGR of 22.87 and reach USD 280 billion by 2020.
On the other hand, the Middle East and Africa held least share in the Global Drug Device Combination Market due to the presence of poor economies and low per capita income, especially within the African region. The Middle Eastern region is estimated to be a major market for the Middle East and African region. This can be attributed due to increasing government funding in the healthcare followed by the presence of developed economies like United Arab Emirates, Saudi Arabia, Dubai, and others within the regional boundaries of the region.
Key players:
Some of the key players in the global drug device combination are 3M, Abbott Laboratories, AlloSource, Biomet Orthopedics, Inc., Biometrix Medical, Biotronik, Boston Scientific Corporation, C.R. BARD, Inc., Cook Critical Care, Inc., Covidien Ltd, Smith & Nephew Plc, St. Jude Medical Inc, Stryker Corporation, Wright Medical Group, Inc., Zimmer Holding, Inc., and others.
Research Methodology:
Market Research Future research is conducted by industry experts who offer insights into industry structure, market segmentation, assessment, Competitive Landscape (CL), penetration, as well as on emerging trends. Besides primary interviews (~ 80%) and secondary research (~ 20%), their analysis is based on their years of professional expertise in respective industries. Our analysts also predict where the market will be headed in the next five to ten years, by analysing historical trends and current market positions. Furthermore, the varying trends of segments and categories geographically presented are studied and are estimated based on the primary and secondary research.
Extensive primary research was conducted to gain a deeper insight of the market and the industry performance. In this particular report we have conducted primary surveys (interviews) with key level executives (VPs, CEOs, Marketing Directors, Business Development Managers, and many more) of major players who are active in the market. In addition to analyzing the current and historical trends, our analysts predict where the market is headed, over the next five to ten years.
Secondary research was mainly used to collect and identify information useful for extensive, technical, market-oriented, and commercial study of the drug device combination. It was also used to obtain key information about major players, market classification, and segmentation according to industry trends, geographical markets, and developments related to the market and perspectives. For this study, analysts have gathered information from various credible sources, such as annual reports, SEC filings, journals, white papers, corporate presentations, company web sites, international organization of chemical manufacturers, some paid databases, and many others.
Intended Audience:
Market Segmentation and Key Market Players
Global Drug Device Combination Market, by Product:
Global Drug Device Combination Market, by Application:
Global Drug Device Combination Market, by End User
Frequently Asked Questions (FAQ) :
Drug Device Combination Market has a growth opportunity with an 11.4% CAGR during the forecast period of 2018 to 2023.
Americas would dominate the global Drug Device Combination Market.
Asia Pacific regional Drug Device Combination Market would be the fastest-growing among all the regions.
Drug Device Combination Market has players like AlloSource, 3M, Abbott Laboratories, Biometrix Medical, Biotronik, C.R. BARD, Boston Scientific Corporation, Biomet Orthopedics, Inc., Inc., Covidien Ltd, Cook Critical Care, Inc., St. Jude Medical Inc, Smith & Nephew Plc, Zimmer Holding, Inc., Stryker Corporation, Wright Medical Group, Inc., and others.
Drug Device Combination Market would be triggered by end users like academic & research organizations, ambulatory centers, hospitals & clinics, and others.
Table of Contents:
Chapter 1. Report Prologue
Chapter 2. Market Introduction
2.1 Definition
2.2 Scope of the Study
2.2.1 Research Objective
2.2.2 Assumptions
2.2.3 Limitations
Chapter 3. Research Methodology
3.1 Introduction
3.2 Primary Research
3.3 Secondary Research
3.4 Market Size Estimation
Chapter 4. Market Dynamics
4.1 Drivers
4.2 Restraints
4.3 Opportunities
4.4 Macroeconomic Indicators
4.5 Technology Trends & Assessment
Chapter 5. Market Factor Analysis
5.1 Porter’s Five Forces Analysis
5.1.1 Bargaining Power of Suppliers
5.1.2 Bargaining Power of Buyers
5.1.3 Threat of New Entrants
5.1.4 Threat of Substitutes
5.1.5 Intensity of Rivalry
5.2 Value Chain Analysis
Chapter 6. Global Drug Device Combination Market, by Product
6.1 Introduction
6.2 Catheter
Market Estimates & Forecast, by Region, 2018–2023
Market Estimates & Forecast, by Country, 2018–2023
6.2.1 Antimicrobial catheter
Market Estimates & Forecast, by Region, 2018–2023
Market Estimates & Forecast, by Country, 2018–2023
6.2.2 Urological catheters
Market Estimates & Forecast, by Region, 2018–2023
Market Estimates & Forecast, by Country, 2018–2023
6.2.3 Cardiovascular catheters
Market Estimates & Forecast, by Region, 2018–2023
Market Estimates & Forecast, by Country, 2018–2023
6.2.4 Oximetry catheters
Market Estimates & Forecast, by Region, 2018–2023
Market Estimates & Forecast, by Country, 2018–2023
6.2.5 Thermodilution catheters
Market Estimates & Forecast, by Region, 2018–2023
Market Estimates & Forecast, by Country, 2018–2023
6.2.6 Wound drainage catheter
Market Estimates & Forecast, by Region, 2018–2023
Market Estimates & Forecast, by Country, 2018–2023
6.2.7 Others
6.3 Advanced Wound Care Products
Market Estimates & Forecast, by Region, 2018–2023
Market Estimates & Forecast, by Country, 2018–2023
6.3.1 Antibiotic wound care
Market Estimates & Forecast, by Region, 2018–2023
Market Estimates & Forecast, by Country, 2018–2023
6.3.2 Bone Graft Substitutes
Market Estimates & Forecast, by Region, 2018–2023
Market Estimates & Forecast, by Country, 2018–2023
6.3.2.1 Ceramic based bone graft substitute
Market Estimates & Forecast, by Region, 2018–2023
Market Estimates & Forecast, by Country, 2018–2023
6.3.2.2 Allograft based bone graft substitutes
Market Estimates & Forecast, by Region, 2018–2023
Market Estimates & Forecast, by Country, 2018–2023
6.3.2.3 Cell based bone graft substitutes
Market Estimates & Forecast, by Region, 2018–2023
Market Estimates & Forecast, by Country, 2018–2023
6.3.2.4 others
Market Estimates & Forecast, by Region, 2018–2023
Market Estimates & Forecast, by Country, 2018–2023
6.3.3 Antibiotic Bone Cements
Market Estimates & Forecast, by Region, 2018–2023
Market Estimates & Forecast, by Country, 2018–2023
6.3.4 Drug Eluting Stents
Market Estimates & Forecast, by Region, 2018–2023
Market Estimates & Forecast, by Country, 2018–2023
6.3.5 Photodynamic Therapy
Market Estimates & Forecast, by Region, 2018–2023
Market Estimates & Forecast, by Country, 2018–2023
6.3.6 Others
Chapter 7. Global Drug Device Combination Market, by Application
7.1 Introduction
7.2 Coronary angioplasty
Market Estimates & Forecast, by Region, 2018–2023
Market Estimates & Forecast, by Country, 2018–2023
7.2.1 Tachycardia management
Market Estimates & Forecast, by Region, 2018–2023
Market Estimates & Forecast, by Country, 2018–2023
7.2.2 Non-Cardiovascular Treatments
Market Estimates & Forecast, by Region, 2018–2023
Market Estimates & Forecast, by Country, 2018–2023
7.2.3 Peripheral arterial disease (PAD)
Market Estimates & Forecast, by Region, 2018–2023
Market Estimates & Forecast, by Country, 2018–2023
7.3 Bone Treatment
Market Estimates & Forecast, by Region, 2018–2023
Market Estimates & Forecast, by Country, 2018–2023
7.4 Antimicrobial Applications
Market Estimates & Forecast, by Region, 2018–2023
Market Estimates & Forecast, by Country, 2018–2023
7.5 Wound Care
Market Estimates & Forecast, by Region, 2018–2023
Market Estimates & Forecast, by Country, 2018–2023
7.6 Ophthalmic Treatment
Market Estimates & Forecast, by Region, 2018–2023
Market Estimates & Forecast, by Country, 2018–2023
7.7 Other
Chapter 8. Global Drug Device Combination Market, by End User
8.1 Introduction
8.2 Hospitals & Clinics
Market Estimates & Forecast, by Region, 2018–2023
Market Estimates & Forecast, by Country, 2018–2023
8.3 Ambulatory Centres
Market Estimates & Forecast, by Region, 2018–2023
Market Estimates & Forecast, by Country, 2018–2023
8.4 Academic & Research Organization
Market Estimates & Forecast, by Region, 2018–2023
Market Estimates & Forecast, by Country, 2018–2023
Chapter 9. Global Drug Device Combination Market, by Region
9.1 Introduction
9.2 Americas
9.2.1 North America
9.2.1.1 U.S.
9.2.1.2 Canada
9.2.2 South America
9.3 Europe
9.3.1 Western Europe
9.3.1.1 Germany
9.3.1.2 France
9.3.1.3 Italy
9.3.1.4 Spain
9.3.1.5 UK
9.3.1.6 Rest of Western Europe
9.3.2 Eastern Europe
9.4 Asia-Pacific
9.4.1 Japan
9.4.2 China
9.4.3 India
9.4.4 Australia
9.4.5 South Korea
9.4.6 Rest of Asia-Pacific
9.5 Middle East & Africa
9.5.1 Middle East
9.5.2 Africa
Chapter 10. Company Landscape
10.1 Introduction
10.2 Market Share Analysis
10.3 Key Development & Strategies
Chapter 11. Company Profiles
11.1 3M
11.1.1 Company Overview
11.1.2 Product Overview
11.1.3 Financials Overview
11.1.4 Key Developments
11.1.5 SWOT Analysis
11.2 Abbott Laboratories
11.2.1 Company Overview
11.2.2 Product Overview
11.2.3 Financial Overview
11.2.4 Key Developments
11.2.5 SWOT Analysis
11.3 AlloSource
11.3.1 Company Overview
11.3.2 Product Overview
11.3.3 Financial Overview
11.3.4 Key Development
11.3.5 SWOT Analysis
11.4 Biomet Orthopedics, Inc.
11.4.1 Company Overview
11.4.2 Technologys/Business Segment Overview
11.4.3 Financial Overview
11.4.4 Key Development
11.4.5 SWOT Analysis
11.5 Biometrix Medical
11.5.1 Company Overview
11.5.2 Product Overview
11.5.3 Financial overview
11.5.4 Key Developments
11.5.5 SWOT Analysis
11.6 Biotronik
11.6.1 Company Overview
11.6.2 Product Overview
11.6.3 Financial Overview
11.6.4 Key Developments
11.6.5 SWOT Analysis
11.7 Boston Scientific Corporation
11.7.1 Overview
11.7.2 Product Overview
11.7.3 Financial Overview
11.7.4 Key Developments
11.7.5 SWOT Analysis
11.8 C.R. BARD, Inc.
11.8.1 Overview
11.8.2 Product/ Technology Overview
11.8.3 Financials
11.8.4 Key Developments
11.8.5 SWOT Analysis
11.9 Cook Critical Care, Inc.
11.9.1 Overview
11.9.2 Product Overview
11.9.3 Financials
11.9.4 Key Developments
11.9.5 SWOT Analysis
11.10 Covidien Ltd
11.10.1 Overview
11.10.2 Product Overview
11.10.3 Financials
11.10.4 Key Developments
11.10.5 SWOT Analysis
11.11 Smith & Nephew Plc
11.11.1 Overview
11.11.2 Product Overview
11.11.3 Financials
11.11.4 Key Developments
11.11.5 SWOT Analysis
11.12 St. Jude Medical Inc
11.12.1 Overview
11.12.2 Product Overview
11.12.3 Financials
11.12.4 Key Developments
11.12.5 SWOT Analysis
11.13 Stryker Corporation
11.13.1 Overview
11.13.2 Product Overview
11.13.3 Financials
11.13.4 Key Developments
11.13.5 SWOT Analysis
11.14 Wright Medical Group, Inc.
11.14.1 Overview
11.14.2 Product Overview
11.14.3 Financials
11.14.4 Key Developments
11.14.5 SWOT Analysis
11.15 Zimmer Holding, Inc.
11.15.1 Overview
11.15.2 Product Overview
11.15.3 Financials
11.15.4 Key Developments
11.15.5 SWOT Analysis
11.16 OtherS
Chapter 12 MRFR Conclusion
12.1 Key Findings
12.1.1 From CEO’s Viewpoint
12.1.2 Unmet Needs of the Market
12.2 Key Companies to Watch
12.3 Predictions for the Global Drug Device Combination Market
Chapter 13. Appendix
LIST OF TABLES
Table 1 Global Drug Device Combination Market Synopsis, 2018–2023
Table 2 Global Drug Device Combination Market Estimates and Forecast, 2018–2023 (USD Million)
Table 3 Global Drug Device Combination Market, by Region, 2018–2023 (USD Million)
Table 4 Global Drug Device Combination Market, by Product, 2018–2023 (USD Million)
Table 5 Global Drug Device Combination Market, by Application, 2018–2023 (USD Million)
Table 6 Global Drug Device Combination Market, End User, 2018–2023 (USD Million)
Table 7 North America: Drug Device Combination, by Product, 2018–2023 (USD Million)
Table 8 North America: Drug Device Combination, by Application, 2018–2023 (USD Million)
Table 9 North America: Drug Device Combination, End User, 2018–2023 (USD Million)
Table 10 US: Drug Device Combination, by Product, 2018–2023 (USD Million)
Table 11 US: Drug Device Combination , by Application, 2018–2023 (USD Million)
Table 12 US: Drug Device Combination, End User, 2018–2023 (USD Million)
Table 13 Canada: Drug Device Combination,by Product, 2018–2023 (USD Million)
Table 14 Canada: Drug Device Combination, by Application, 2018–2023 (USD Million)
Table 15 Canada: Drug Device Combination, End User, 2018–2023 (USD Million)
Table 16 South America: Drug Device Combination, by Product, 2018–2023 (USD Million)
Table 17 South America: Drug Device Combination, by Application, 2018–2023 (USD Million)
Table 18 South America: Drug Device Combination, End User, 2018–2023 (USD Million)
Table 19 Europe: Drug Device Combination, by Product, 2018–2023 (USD Million)
Table 20 Europe: Drug Device Combination, by Application, 2018–2023 (USD Million)
Table 21 Europe: Drug Device Combination, End User, 2018–2023 (USD Million)
Table 22 Western Europe: Drug Device Combination, by Product, 2018–2023 (USD Million)
Table 23 Western Europe: Drug Device Combination, by Application, 2018–2023 (USD Million)
Table 24 Western Europe: Drug Device Combination, by End User, 2018–2023 (USD Million)
Table 25 Eastern Europe: Drug Device Combination, by Product, 2018–2023 (USD Million)
Table 26 Eastern Europe: Drug Device Combination , by Application, 2018–2023 (USD Million)
Table 27 Eastern Europe: Drug Device Combination, End User, 2018–2023 (USD Million)
Table 28 Asia-Pacific: Drug Device Combination, by Product, 2018–2023 (USD Million)
Table 29 Asia-Pacific: Drug Device Combination , by Application, 2018–2023 (USD Million)
Table 30 Asia-Pacific: Drug Device Combination, End User, 2018–2023 (USD Million)
Table 31 Middle East & Africa: Drug Device Combination, by Product, 2018–2023 (USD Million)
Table 32 Middle East & Africa: Drug Device Combination , by Application, 2018–2023 (USD Million)
Table 33 Middle East & Africa: Drug Device Combination, End User, 2018–2023 (USD Million)
LIST OF FIGURES
Figure 1 Research Process
Figure 2 Segmentation for Global Drug Device Combination Market
Figure 3 Market Dynamics for Global Drug Device Combination Market
Figure 4 Global Drug Device Combination Market Share, by Product, 2017
Figure 5 Global Drug Device Combination Market Share, by Application, 2017
Figure 6 Global Drug Device Combination Market Share, End User, 2017
Figure 7 Global Drug Device Combination Market Share, by Region, 2017
Figure 8 North America: Drug Device Combination Market Share, by Country, 2017
Figure 9 Europe: Drug Device Combination MarketShare, by Country, 2017
Figure 10 Asia-Pacific: Drug Device Combination Market Share, by Country, 2017
Figure 11 Middle East & Africa: Drug Device Combination Market Share, by Region, 2017
Figure 12 Global Drug Device Combination Market: Company Share Analysis, 2017 (%)
Figure 13 3M: Key Financials
Figure 14 3M: Segmental Revenue
Figure 15 3M: Geographical Revenue
Figure 16 Abbott Laboratories: Key Financials
Figure 17 Abbott Laboratories: Segmental Revenue
Figure 18 Abbott Laboratories: Geographical Revenue
Figure 19 AlloSource: Key Financials
Figure 20 AlloSource: Segmental Revenue
Figure 21 AlloSource: Geographical Revenue
Figure 22 Biomet Orthopedics, Inc.: Key Financials
Figure 23 Biomet Orthopedics, Inc.: Segmental Revenue
Figure 24 Biomet Orthopedics, Inc.: Geographical Revenue
Figure 25 Biotronik: Key Financials
Figure 26 Biotronik: Segmental Revenue
Figure 27 Biotronik: Geographical Revenue
Figure 28 Boston Scientific Corporation: Key Financials
Figure 29 Boston Scientific Corporation: Segmental Revenue
Figure 30 Boston Scientific Corporation: Geographical Revenue
Figure 31 C.R. BARD, Inc.: Key Financials
Figure 32 C.R. BARD, Inc.: Segmental Revenue
Figure 33 C.R. BARD, Inc.: Geographical Revenue
Figure 34 Cook Critical Care, Inc.: Key Financials
Figure 35 Cook Critical Care, Inc.: Segmental Revenue
Figure 36 Cook Critical Care, Inc.: Geographical Revenue
Figure 37 Covidien Ltd: Key Financials
Figure 38 Covidien Ltd: Segmental Revenue
Figure 39 Covidien Ltd: Geographical Revenue
Figure 40 Smith & Nephew Plc: Key Financials
Figure 41 Smith & Nephew Plc: Segmental Revenue
Figure 42 Smith & Nephew Plc: Geographical Revenue
Figure 43 St. Jude Medical Inc: Key Financials
Figure 44 St. Jude Medical Inc: Segmental Revenue
Figure 45 St. Jude Medical Inc: Geographical Revenue
Figure 46 Stryker Corporation: Key Financials
Figure 47 Stryker Corporation: Segmental Revenue
Figure 48 Stryker Corporation: Geographical Revenue
Figure 49 Wright Medical Group, Inc.: Key Financials
Figure 50 Wright Medical Group, Inc.: Segmental Revenue
Figure 51 Wright Medical Group, Inc.: Geographical Revenue