Drones Energy Industry Market Segmentation
Drones Energy Industry Market By Application (USD Billion, 2022-2035)
- Energy Infrastructure Inspection
- Drones Energy Industry Market Monitoring
- Power Line Maintenance
- Wind Turbine Inspection
Drones Energy Industry Market By End Use (USD Billion, 2022-2035)
- Utility Companies
- Drones Energy Industry Market Providers
- Telecommunication Companies
- Government Agencies
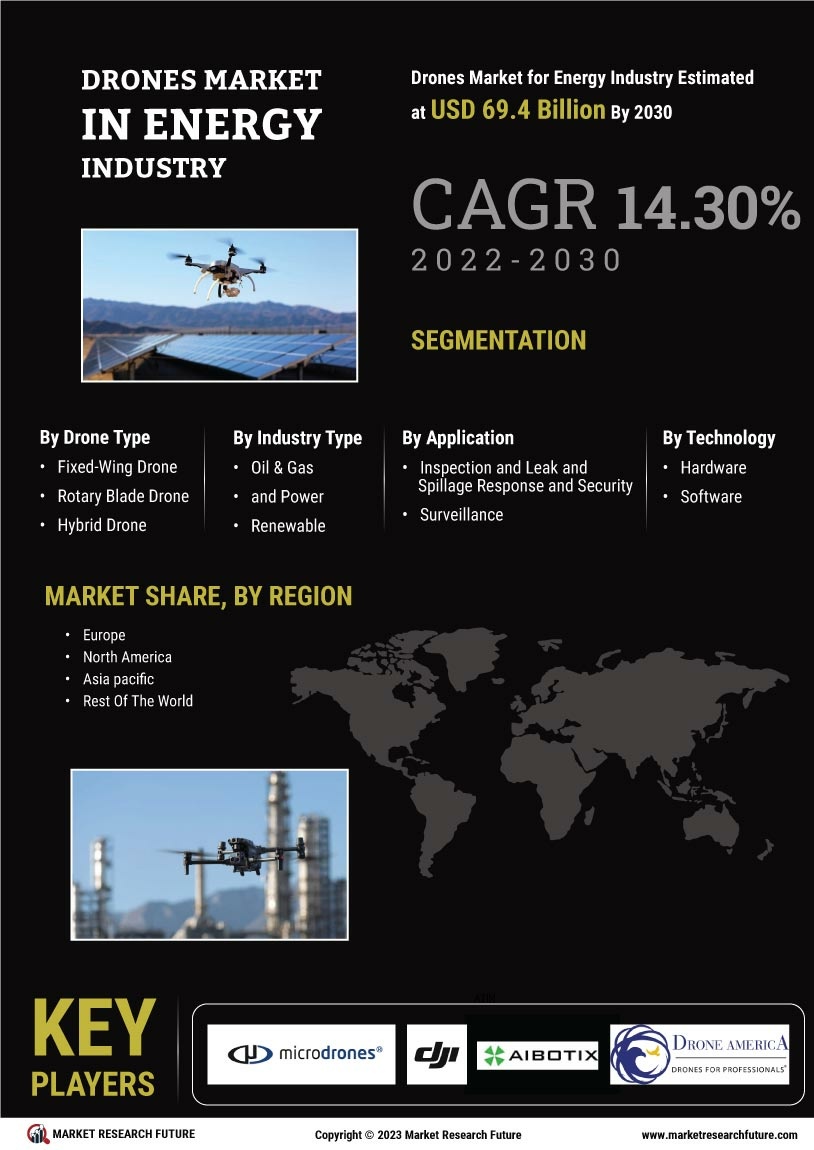
Drones Energy Industry Market By Drone Type (USD Billion, 2022-2035)
- Fixed Wing Drones
- Multirotor Drones
- Hybrid Drones
- Solar Powered Drones
Drones Energy Industry Market By Energy Source (USD Billion, 2022-2035)
- Battery Powered
- Solar Powered
- Hybrid Energy Systems
- Fuel Cell Powered