×
Hero Background
English
Chinese
French
Japanese
Korean
German
Spanish

DIY Smart Home Market Share

ID: MRFR/SEM/2101-HCR
100 Pages
Aarti Dhapte
October 2025

DIY Smart Home Market Research Report Information By Technology (Network Technology and Wireless Communication Technology), By Product (Entertainment Control, Security & Access Control and Smart Kitchen) And By Region (North America, Europe, Asia-Pacific, And Rest Of The World) –Market Forecast Till 2035

Share:
Download PDF ×

We do not share your information with anyone. However, we may send you emails based on your report interest from time to time. You may contact us at any time to opt-out.

DIY Smart Home Market Infographic
Purchase Options

Market Share

DIY Smart Home Market Share Analysis

Effective market share positioning strategies are essential for businesses to establish a firm footing and prosper in the highly competitive DIY smart home sector. Differentiation via innovation is one main tactic. Businesses differentiate themselves from rivals by investing in cutting-edge features, special features, and distinctive design aspects. By consistently pushing the limits of what smart home technology can do, these trailblazers draw in tech-savvy customers looking for the newest and most cutting-edge solutions, which helps them capture a sizable portion of the market. Within the DIY smart home industry, pricing methods are also crucial for determining market share positioning. Some businesses take a cost leadership stance, catering to price-conscious clients by providing smart home solutions that are reasonably priced. These businesses use economies of scale and effective production techniques to maintain competitive costs without sacrificing the quality and dependability of their products. Premium positioning, on the other hand, aims to provide high-end, premium smart home appliances with cutting-edge capabilities, appealing to customers who value quality and are prepared to shell out more money for an improved user experience. In the DIY smart home sector, strategic alliances and partnerships are becoming more and more common. To construct complete and integrated smart home ecosystems, companies collaborate with other businesses, such as technology suppliers, service providers, and even house builders. Through these partnerships, businesses may make use of one another's advantages, increase the range of products they provide, and improve the smart home experience as a whole. Businesses may increase their market share and give customers more value by presenting themselves as a component of a wider, linked ecosystem. In the DIY smart home sector, market share positioning is heavily influenced by brand reputation and trust. Customers are more likely to trust businesses that put a high priority on customer happiness, make quality assurance investments, and cultivate a favorable brand image. Having a solid reputation for dependability and customer service may make a big difference in the eyes of customers and encourage brand loyalty. A company's market share is greatly impacted by creating and sustaining a favorable brand image since happy consumers are more inclined to refer to and repurchase products.

Author
Aarti Dhapte
Team Lead - Research

She holds an experience of about 6+ years in Market Research and Business Consulting, working under the spectrum of Information Communication Technology, Telecommunications and Semiconductor domains. Aarti conceptualizes and implements a scalable business strategy and provides strategic leadership to the clients. Her expertise lies in market estimation, competitive intelligence, pipeline analysis, customer assessment, etc.

Leave a Comment

FAQs

What is the current valuation of the DIY Smart Home Market?

The DIY Smart Home Market was valued at 7.38 USD Billion in 2024.

What is the projected market size for the DIY Smart Home Market by 2035?

The market is projected to reach 93.72 USD Billion by 2035.

What is the expected CAGR for the DIY Smart Home Market from 2025 to 2035?

The expected CAGR for the DIY Smart Home Market during the forecast period 2025 - 2035 is 25.99%.

Which technology segments are leading in the DIY Smart Home Market?

The leading technology segments include Wireless Communication Technology, valued at 65.47 USD Billion, and Network Technology, valued at 28.25 USD Billion.

What are the key product segments in the DIY Smart Home Market?

Key product segments include Smart Kitchen, valued at 46.04 USD Billion, and Security & Access Control, valued at 28.56 USD Billion.

Who are the major players in the DIY Smart Home Market?

Major players include Amazon, Google, Apple, Samsung, Philips, Lutron, Ecobee, Ring, and August.

Market Summary

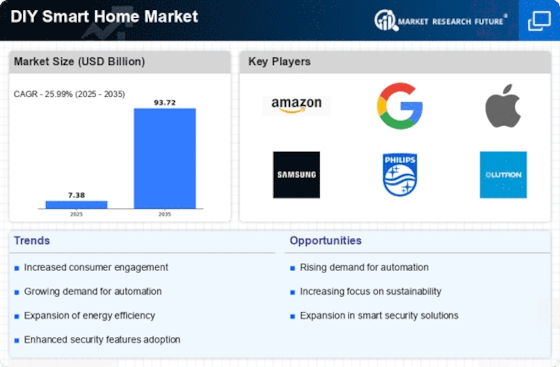
As per MRFR analysis, the DIY Smart Home Market Size was estimated at 7.38 USD Billion in 2024. The DIY Smart Home industry is projected to grow from 9.298 USD Billion in 2025 to 93.72 USD Billion by 2035, exhibiting a compound annual growth rate (CAGR) of 25.99 during the forecast period 2025 - 2035.

Key Market Trends & Highlights

The DIY Smart Home Market is experiencing robust growth driven by technological advancements and consumer demand for automation.

  • North America remains the largest market for DIY smart home solutions, reflecting a strong consumer base and established infrastructure. The Asia-Pacific region is emerging as the fastest-growing market, fueled by increasing urbanization and rising disposable incomes. Wireless communication technology dominates the market, while network technology is rapidly gaining traction as consumers seek enhanced connectivity. Growing consumer interest in home automation and advancements in smart technology are key drivers propelling the market forward.

Market Size & Forecast

2024 Market Size 7.38 (USD Billion)
2035 Market Size 93.72 (USD Billion)
CAGR (2025 - 2035) 25.99%
Largest Regional Market Share in 2024 North America

Major Players

<p>Amazon (US), Google (US), Apple (US), Samsung (KR), Philips (NL), Lutron (US), Ecobee (CA), Ring (US), August (US)</p>

Market Trends

The DIY Smart Home Market is currently experiencing a notable transformation, driven by advancements in technology and a growing consumer interest in home automation. This market encompasses a wide range of products, including smart lighting, security systems, and energy management solutions, which empower homeowners to take control of their living environments. As individuals increasingly seek convenience, energy efficiency, and enhanced security, the demand for DIY smart home solutions continues to rise. Furthermore, the proliferation of mobile applications and user-friendly interfaces has made it easier for consumers to integrate these technologies into their homes without requiring professional installation. In addition to technological advancements, the DIY Smart Home Market is influenced by changing consumer preferences. Homeowners are becoming more inclined to personalize their living spaces, leading to a surge in customizable smart home products. This trend reflects a broader desire for individuality and self-expression within the home environment. As the market evolves, it appears that the focus will shift towards creating seamless ecosystems that allow various devices to communicate and work together harmoniously. Overall, the DIY Smart Home Market is poised for continued growth as it adapts to the needs and desires of modern consumers, fostering a more connected and efficient living experience.

Increased Focus on Energy Efficiency

The DIY Smart Home Market is witnessing a heightened emphasis on energy-efficient solutions. Homeowners are increasingly motivated to reduce their energy consumption and lower utility bills. Smart thermostats, energy monitoring systems, and automated lighting are becoming popular choices, as they allow users to optimize their energy usage. This trend not only benefits the environment but also aligns with the growing consumer awareness of sustainability.

Integration of Artificial Intelligence

Artificial intelligence is making significant inroads into the DIY Smart Home Market. Smart devices equipped with AI capabilities can learn user preferences and adapt their functions accordingly. This integration enhances user experience by providing personalized automation and predictive analytics. As AI technology continues to advance, it is likely to play a crucial role in shaping the future of smart home solutions.

Rise of Voice-Activated Systems

Voice-activated systems are gaining traction within the DIY Smart Home Market. Consumers are increasingly adopting smart speakers and voice assistants to control their home devices. This trend simplifies user interaction and enhances accessibility, making it easier for individuals to manage their smart home environments. As voice recognition technology improves, the reliance on voice commands is expected to grow, further embedding these systems into daily life.

DIY Smart Home Market Market Drivers

Advancements in Smart Technology

Technological advancements play a pivotal role in shaping the DIY Smart Home Market. Innovations in smart devices, such as improved connectivity and enhanced user interfaces, facilitate seamless integration into everyday life. The proliferation of Internet of Things (IoT) devices has led to a significant increase in the number of smart home products available to consumers. Data indicates that the market for smart home devices is projected to reach USD 174 billion by 2025, underscoring the rapid growth and adoption of these technologies. As manufacturers continue to invest in research and development, the DIY Smart Home Market is expected to benefit from a wider array of user-friendly products that empower consumers to create customized smart home ecosystems.

Growing Awareness of Home Security Concerns

Concerns regarding home security are increasingly influencing consumer behavior within the DIY Smart Home Market. As crime rates fluctuate and homeowners seek peace of mind, the demand for smart security solutions is on the rise. Products such as smart cameras, doorbell cameras, and motion sensors are becoming essential components of modern home security systems. Recent surveys indicate that nearly 60% of homeowners prioritize security features when considering smart home devices. This heightened awareness of security needs is likely to drive innovation and product development within the DIY Smart Home Market, as companies strive to offer comprehensive solutions that address the evolving concerns of consumers.

Growing Consumer Interest in Home Automation

The DIY Smart Home Market experiences a notable surge in consumer interest as individuals increasingly seek to enhance their living environments through automation. This trend is driven by the desire for convenience, security, and energy efficiency. According to recent data, approximately 70% of homeowners express a preference for smart home devices that can be easily installed without professional assistance. This growing inclination towards self-installation reflects a shift in consumer behavior, where individuals prioritize personalized solutions that align with their specific needs. As a result, the DIY Smart Home Market is likely to witness a continuous influx of innovative products designed for easy integration into existing home systems, catering to the evolving preferences of tech-savvy consumers.

Rising Demand for Energy Management Solutions

The emphasis on energy management is becoming increasingly pronounced within the DIY Smart Home Market. Consumers are more aware of their energy consumption patterns and are actively seeking solutions to reduce costs and environmental impact. Smart thermostats, energy-efficient lighting, and automated energy management systems are gaining traction as homeowners look for ways to optimize their energy usage. Recent statistics suggest that energy management solutions can lead to savings of up to 30% on energy bills. This growing demand for energy-efficient products is likely to drive innovation and competition within the DIY Smart Home Market, as companies strive to offer solutions that not only enhance convenience but also promote sustainability.

Increased Availability of Affordable Smart Devices

The DIY Smart Home Market is witnessing a significant increase in the availability of affordable smart devices, making home automation accessible to a broader audience. As technology advances and production costs decrease, manufacturers are introducing a range of budget-friendly options that do not compromise on quality or functionality. This democratization of smart home technology is likely to attract a diverse consumer base, including those who may have previously considered such devices to be prohibitively expensive. Market data indicates that the average price of smart home devices has decreased by approximately 20% over the past few years, further encouraging adoption. Consequently, the DIY Smart Home Market is poised for growth as more consumers embrace the benefits of smart technology.

Market Segment Insights

DIY Smart Home Market Technology Insights

<p>The DIY Smart Home Market segmentation, based on technology includes network technology and wireless communication technology. The wireless communication technology segment dominated the market. Due to its dependability and sturdy architecture, wireless telephony is the most often utilized networking infrastructure in contemporary alarm control systems. A house used to need to be rebuilt or renovated to be "automated," but thanks to wireless technology, this is now easily avoided. Wireless systems employ smart technology-based models to make implementation straightforward and self-contained while also aiming to prevent restoration.</p>

DIY Smart Home Market Product Insights

<p>The DIY Smart Home Market segmentation, based on product, includes entertainment control, security &amp; access control and smart kitchen. The security &amp; access control category generated the most income. This is because customers demand more connectivity and convenience for safety and security. Installing a wireless security camera and access control system, as well as lighting control systems with professionally created systems, is costly since professionals are required to install the system, and long-term contracts and ongoing costs are required to keep the system operational.</p>

<p>There are currently many sensors and devices for phones and other portable devices that are DIY-friendly on the market. These systems don't require contracts and, in many cases, don't charge monthly fees.</p>

<p>Figure 1: DIY Smart Home Market, by Product, 2022 &amp; 2032 (USD Billion)</p>

Get more detailed insights about Global DIY Smart Home Market Research Report- Forecast 2035

Regional Insights

North America : Innovation and Adoption Leader

North America is the largest market for DIY smart home products, accounting for approximately 45% of the global market share. The region's growth is driven by increasing consumer demand for home automation, energy efficiency, and security solutions. Regulatory support, such as incentives for energy-efficient devices, further catalyzes market expansion. The U.S. leads this market, followed closely by Canada, which holds about 10% of the share. The competitive landscape in North America is dominated by major players like Amazon, Google, and Apple, who are continuously innovating to enhance user experience. The presence of established brands and a tech-savvy consumer base fosters a robust environment for smart home technology. Additionally, partnerships between tech companies and home improvement retailers are enhancing product accessibility, further driving market growth.

Europe : Emerging Market with Regulations

Europe is witnessing significant growth in the DIY smart home market, holding approximately 30% of the global share. The region's expansion is fueled by increasing awareness of energy efficiency and sustainability, alongside supportive regulations promoting smart technology adoption. Countries like Germany and the UK are leading this market, with Germany accounting for about 12% of the share, driven by strong consumer interest and government initiatives. The competitive landscape in Europe features key players such as Philips and Samsung, who are investing in innovative solutions tailored to local preferences. The market is characterized by a mix of established brands and emerging startups, fostering a dynamic environment. Regulatory frameworks, such as the EU's Green Deal, are encouraging the integration of smart technologies in homes, further propelling market growth.

Asia-Pacific : Rapid Growth and Adoption

The Asia-Pacific region is rapidly emerging as a significant player in the DIY smart home market, holding around 20% of the global share. The growth is driven by rising disposable incomes, urbanization, and increasing consumer awareness of smart home technologies. China and Japan are the largest markets in this region, with China alone accounting for approximately 15% of the market share, supported by government initiatives promoting smart city developments. The competitive landscape is vibrant, with local and international players like Samsung and Ecobee vying for market share. The presence of a tech-savvy population and increasing smartphone penetration are key factors driving adoption. Additionally, collaborations between tech companies and local manufacturers are enhancing product offerings, making smart home solutions more accessible to consumers across the region.

Middle East and Africa : Emerging Market with Potential

The Middle East and Africa region is gradually emerging in the DIY smart home market, currently holding about 5% of the global share. The growth is primarily driven by increasing urbanization, rising disposable incomes, and a growing interest in home automation solutions. Countries like South Africa and the UAE are leading this market, with the UAE showing a strong inclination towards smart technologies, supported by government initiatives promoting innovation and sustainability. The competitive landscape is still developing, with a mix of local and international players entering the market. Key players are focusing on creating affordable and user-friendly smart home solutions to cater to the diverse consumer base. As awareness of smart home benefits increases, the market is expected to grow significantly in the coming years, driven by technological advancements and improved infrastructure.

Key Players and Competitive Insights

Leading market players are investing heavily in research and development in order to expand their product lines, which will help the DIY smart home market, grow even more. Market participants are also undertaking a variety of strategic activities to expand their global footprint, with important market developments including new product launches, contractual agreements, mergers and acquisitions, higher investments, and collaboration with other organizations. To expand and survive in a more competitive and rising market climate, DIY smart home industry must offer cost-effective items.

Manufacturing locally to minimize operational costs is one of the key business tactics used by manufacturers in the global DIY smart home industry to benefit clients and increase the market sector. In recent years, the DIY smart home industry has offered some of the most significant advantages to market. Major players in the DIY smart home market attempting to increase market demand by investing in research and development operations include Nest Labs Inc. (U.S.), Honeywell International Inc. (U.S.), Assa Abloy Group (Sweden), Acuity Brands Inc. (U.S.), Johnson Controls Inc. (U.S.), Schneider Electric SE (France), United Technologies Corporation (U.S.), Samsung Electronics Co.

Ltd. (South Korea), and Crestron Electronics Inc. (U.S.).

Providing networking products is Nest Labs, Inc. The Company creates and produces a sensor-driven, Wi-Fi-enabled, programmable learning thermostat. In the US, Nest Labs is in business. In 2015, Google purchased Nest Labs. Google's home electronics devices are now sold under the Google Nest brand. Thermostats, smoke and carbon monoxide detectors, and security cameras were added in 2013, followed by the acquisition of Dropcam in June 2014.

Schneider Electric SE, formerly known as Schneider Electric SA, develops associated technologies and solutions for power distribution. Its main products include essential power, cooling, and racks, low voltage goods and systems, solar power and energy storage, medium voltage distribution and grid automation, and automation and control solutions for automation and control. The business also provides cloud, consulting, training, field and automation, energy, and sustainability services.

Key Companies in the DIY Smart Home Market market include

Industry Developments

December 2019: To advance the development of a new, sovereignty-free network standard and increase compatibility across smart home products, Apple, Amazon, Google, and the Zigbee Alliance joined together. Security was a key design principle.

May 2019: The Echo Show 5 is Amazon's newest addition to the line of Echo Show products, in addition to its compact design, 5.5-inch display, high-quality audio, HD camera, and built-in camera screen.

Future Outlook

DIY Smart Home Market Future Outlook

<p>The DIY Smart Home Market is projected to grow at a 25.99% CAGR from 2024 to 2035, driven by technological advancements, consumer demand for automation, and energy efficiency.</p>

New opportunities lie in:

  • <p>Integration of AI-driven home automation systems</p><p>Expansion of subscription-based smart home services</p><p>Development of energy-efficient smart appliances</p>

<p>By 2035, the DIY Smart Home Market is poised for substantial growth and innovation.</p>

Market Segmentation

DIY Smart Home Market Product Outlook

  • Entertainment Control
  • Security & Access Control
  • Smart Kitchen

DIY Smart Home Market Technology Outlook

  • Network Technology
  • Wireless Communication Technology

Report Scope

MARKET SIZE 20247.38(USD Billion)
MARKET SIZE 20259.298(USD Billion)
MARKET SIZE 203593.72(USD Billion)
COMPOUND ANNUAL GROWTH RATE (CAGR)25.99% (2024 - 2035)
REPORT COVERAGERevenue Forecast, Competitive Landscape, Growth Factors, and Trends
BASE YEAR2024
Market Forecast Period2025 - 2035
Historical Data2019 - 2024
Market Forecast UnitsUSD Billion
Key Companies ProfiledMarket analysis in progress
Segments CoveredMarket segmentation analysis in progress
Key Market OpportunitiesIntegration of artificial intelligence in DIY Smart Home systems enhances user experience and automation capabilities.
Key Market DynamicsRising consumer interest in automation drives innovation and competition in the DIY Smart Home Market.
Countries CoveredNorth America, Europe, APAC, South America, MEA

FAQs

What is the current valuation of the DIY Smart Home Market?

The DIY Smart Home Market was valued at 7.38 USD Billion in 2024.

What is the projected market size for the DIY Smart Home Market by 2035?

The market is projected to reach 93.72 USD Billion by 2035.

What is the expected CAGR for the DIY Smart Home Market from 2025 to 2035?

The expected CAGR for the DIY Smart Home Market during the forecast period 2025 - 2035 is 25.99%.

Which technology segments are leading in the DIY Smart Home Market?

The leading technology segments include Wireless Communication Technology, valued at 65.47 USD Billion, and Network Technology, valued at 28.25 USD Billion.

What are the key product segments in the DIY Smart Home Market?

Key product segments include Smart Kitchen, valued at 46.04 USD Billion, and Security &amp; Access Control, valued at 28.56 USD Billion.

Who are the major players in the DIY Smart Home Market?

Major players include Amazon, Google, Apple, Samsung, Philips, Lutron, Ecobee, Ring, and August.

  1. SECTION I: EXECUTIVE SUMMARY AND KEY HIGHLIGHTS
    1. EXECUTIVE SUMMARY
      1. Market Overview
      2. Key Findings
      3. Market Segmentation
      4. Competitive Landscape
      5. Challenges and Opportunities
      6. Future Outlook 2
  2. SECTION II: SCOPING, METHODOLOGY AND MARKET STRUCTURE
    1. MARKET INTRODUCTION
      1. Definition
      2. Scope of the study
    2. RESEARCH METHODOLOGY
      1. Overview
      2. Data Mining
      3. Secondary Research
      4. Primary Research
      5. Forecasting Model
      6. Market Size Estimation
      7. Data Triangulation
      8. Validation 3
  3. SECTION III: QUALITATIVE ANALYSIS
    1. MARKET DYNAMICS
      1. Overview
      2. Drivers
      3. Restraints
      4. Opportunities
    2. MARKET FACTOR ANALYSIS
      1. Value chain Analysis
      2. Porter's Five Forces Analysis
      3. COVID-19 Impact Analysis
  4. SECTION IV: QUANTITATIVE ANALYSIS
    1. Semiconductor & Electronics, BY Technology (USD Billion)
      1. Network Technology
      2. Wireless Communication Technology
    2. Semiconductor & Electronics, BY Product (USD Billion)
      1. Entertainment Control
      2. Security & Access Control
      3. Smart Kitchen
    3. Semiconductor & Electronics, BY Region (USD Billion)
      1. North America
      2. Europe
      3. APAC
      4. South America
      5. MEA
  5. SECTION V: COMPETITIVE ANALYSIS
    1. Competitive Landscape
      1. Overview
      2. Competitive Analysis
      3. Market share Analysis
      4. Major Growth Strategy in the Semiconductor & Electronics
      5. Competitive Benchmarking
      6. Leading Players in Terms of Number of Developments in the Semiconductor & Electronics
      7. Key developments and growth strategies
      8. Major Players Financial Matrix
    2. Company Profiles
      1. Amazon (US)
      2. Google (US)
      3. Apple (US)
      4. Samsung (KR)
      5. Philips (NL)
      6. Lutron (US)
      7. Ecobee (CA)
      8. Ring (US)
      9. August (US)
    3. Appendix
      1. References
      2. Related Reports 6 LIST OF FIGURES
    4. MARKET SYNOPSIS
    5. NORTH AMERICA MARKET ANALYSIS
    6. US MARKET ANALYSIS BY TECHNOLOGY
    7. US MARKET ANALYSIS BY PRODUCT
    8. CANADA MARKET ANALYSIS BY TECHNOLOGY
    9. CANADA MARKET ANALYSIS BY PRODUCT
    10. EUROPE MARKET ANALYSIS
    11. GERMANY MARKET ANALYSIS BY TECHNOLOGY
    12. GERMANY MARKET ANALYSIS BY PRODUCT
    13. UK MARKET ANALYSIS BY TECHNOLOGY
    14. UK MARKET ANALYSIS BY PRODUCT
    15. FRANCE MARKET ANALYSIS BY TECHNOLOGY
    16. FRANCE MARKET ANALYSIS BY PRODUCT
    17. RUSSIA MARKET ANALYSIS BY TECHNOLOGY
    18. RUSSIA MARKET ANALYSIS BY PRODUCT
    19. ITALY MARKET ANALYSIS BY TECHNOLOGY
    20. ITALY MARKET ANALYSIS BY PRODUCT
    21. SPAIN MARKET ANALYSIS BY TECHNOLOGY
    22. SPAIN MARKET ANALYSIS BY PRODUCT
    23. REST OF EUROPE MARKET ANALYSIS BY TECHNOLOGY
    24. REST OF EUROPE MARKET ANALYSIS BY PRODUCT
    25. APAC MARKET ANALYSIS
    26. CHINA MARKET ANALYSIS BY TECHNOLOGY
    27. CHINA MARKET ANALYSIS BY PRODUCT
    28. INDIA MARKET ANALYSIS BY TECHNOLOGY
    29. INDIA MARKET ANALYSIS BY PRODUCT
    30. JAPAN MARKET ANALYSIS BY TECHNOLOGY
    31. JAPAN MARKET ANALYSIS BY PRODUCT
    32. SOUTH KOREA MARKET ANALYSIS BY TECHNOLOGY
    33. SOUTH KOREA MARKET ANALYSIS BY PRODUCT
    34. MALAYSIA MARKET ANALYSIS BY TECHNOLOGY
    35. MALAYSIA MARKET ANALYSIS BY PRODUCT
    36. THAILAND MARKET ANALYSIS BY TECHNOLOGY
    37. THAILAND MARKET ANALYSIS BY PRODUCT
    38. INDONESIA MARKET ANALYSIS BY TECHNOLOGY
    39. INDONESIA MARKET ANALYSIS BY PRODUCT
    40. REST OF APAC MARKET ANALYSIS BY TECHNOLOGY
    41. REST OF APAC MARKET ANALYSIS BY PRODUCT
    42. SOUTH AMERICA MARKET ANALYSIS
    43. BRAZIL MARKET ANALYSIS BY TECHNOLOGY
    44. BRAZIL MARKET ANALYSIS BY PRODUCT
    45. MEXICO MARKET ANALYSIS BY TECHNOLOGY
    46. MEXICO MARKET ANALYSIS BY PRODUCT
    47. ARGENTINA MARKET ANALYSIS BY TECHNOLOGY
    48. ARGENTINA MARKET ANALYSIS BY PRODUCT
    49. REST OF SOUTH AMERICA MARKET ANALYSIS BY TECHNOLOGY
    50. REST OF SOUTH AMERICA MARKET ANALYSIS BY PRODUCT
    51. MEA MARKET ANALYSIS
    52. GCC COUNTRIES MARKET ANALYSIS BY TECHNOLOGY
    53. GCC COUNTRIES MARKET ANALYSIS BY PRODUCT
    54. SOUTH AFRICA MARKET ANALYSIS BY TECHNOLOGY
    55. SOUTH AFRICA MARKET ANALYSIS BY PRODUCT
    56. REST OF MEA MARKET ANALYSIS BY TECHNOLOGY
    57. REST OF MEA MARKET ANALYSIS BY PRODUCT
    58. KEY BUYING CRITERIA OF SEMICONDUCTOR & ELECTRONICS
    59. RESEARCH PROCESS OF MRFR
    60. DRO ANALYSIS OF SEMICONDUCTOR & ELECTRONICS
    61. DRIVERS IMPACT ANALYSIS: SEMICONDUCTOR & ELECTRONICS
    62. RESTRAINTS IMPACT ANALYSIS: SEMICONDUCTOR & ELECTRONICS
    63. SUPPLY / VALUE CHAIN: SEMICONDUCTOR & ELECTRONICS
    64. SEMICONDUCTOR & ELECTRONICS, BY TECHNOLOGY, 2024 (% SHARE)
    65. SEMICONDUCTOR & ELECTRONICS, BY TECHNOLOGY, 2024 TO 2035 (USD Billion)
    66. SEMICONDUCTOR & ELECTRONICS, BY PRODUCT, 2024 (% SHARE)
    67. SEMICONDUCTOR & ELECTRONICS, BY PRODUCT, 2024 TO 2035 (USD Billion)
    68. BENCHMARKING OF MAJOR COMPETITORS 7 LIST OF TABLES
    69. LIST OF ASSUMPTIONS
    70. North America MARKET SIZE ESTIMATES; FORECAST
      1. BY TECHNOLOGY, 2025-2035 (USD Billion)
      2. BY PRODUCT, 2025-2035 (USD Billion)
    71. US MARKET SIZE ESTIMATES; FORECAST
      1. BY TECHNOLOGY, 2025-2035 (USD Billion)
      2. BY PRODUCT, 2025-2035 (USD Billion)
    72. Canada MARKET SIZE ESTIMATES; FORECAST
      1. BY TECHNOLOGY, 2025-2035 (USD Billion)
      2. BY PRODUCT, 2025-2035 (USD Billion)
    73. Europe MARKET SIZE ESTIMATES; FORECAST
      1. BY TECHNOLOGY, 2025-2035 (USD Billion)
      2. BY PRODUCT, 2025-2035 (USD Billion)
    74. Germany MARKET SIZE ESTIMATES; FORECAST
      1. BY TECHNOLOGY, 2025-2035 (USD Billion)
      2. BY PRODUCT, 2025-2035 (USD Billion)
    75. UK MARKET SIZE ESTIMATES; FORECAST
      1. BY TECHNOLOGY, 2025-2035 (USD Billion)
      2. BY PRODUCT, 2025-2035 (USD Billion)
    76. France MARKET SIZE ESTIMATES; FORECAST
      1. BY TECHNOLOGY, 2025-2035 (USD Billion)
      2. BY PRODUCT, 2025-2035 (USD Billion)
    77. Russia MARKET SIZE ESTIMATES; FORECAST
      1. BY TECHNOLOGY, 2025-2035 (USD Billion)
      2. BY PRODUCT, 2025-2035 (USD Billion)
    78. Italy MARKET SIZE ESTIMATES; FORECAST
      1. BY TECHNOLOGY, 2025-2035 (USD Billion)
      2. BY PRODUCT, 2025-2035 (USD Billion)
    79. Spain MARKET SIZE ESTIMATES; FORECAST
      1. BY TECHNOLOGY, 2025-2035 (USD Billion)
      2. BY PRODUCT, 2025-2035 (USD Billion)
    80. Rest of Europe MARKET SIZE ESTIMATES; FORECAST
      1. BY TECHNOLOGY, 2025-2035 (USD Billion)
      2. BY PRODUCT, 2025-2035 (USD Billion)
    81. APAC MARKET SIZE ESTIMATES; FORECAST
      1. BY TECHNOLOGY, 2025-2035 (USD Billion)
      2. BY PRODUCT, 2025-2035 (USD Billion)
    82. China MARKET SIZE ESTIMATES; FORECAST
      1. BY TECHNOLOGY, 2025-2035 (USD Billion)
      2. BY PRODUCT, 2025-2035 (USD Billion)
    83. India MARKET SIZE ESTIMATES; FORECAST
      1. BY TECHNOLOGY, 2025-2035 (USD Billion)
      2. BY PRODUCT, 2025-2035 (USD Billion)
    84. Japan MARKET SIZE ESTIMATES; FORECAST
      1. BY TECHNOLOGY, 2025-2035 (USD Billion)
      2. BY PRODUCT, 2025-2035 (USD Billion)
    85. South Korea MARKET SIZE ESTIMATES; FORECAST
      1. BY TECHNOLOGY, 2025-2035 (USD Billion)
      2. BY PRODUCT, 2025-2035 (USD Billion)
    86. Malaysia MARKET SIZE ESTIMATES; FORECAST
      1. BY TECHNOLOGY, 2025-2035 (USD Billion)
      2. BY PRODUCT, 2025-2035 (USD Billion)
    87. Thailand MARKET SIZE ESTIMATES; FORECAST
      1. BY TECHNOLOGY, 2025-2035 (USD Billion)
      2. BY PRODUCT, 2025-2035 (USD Billion)
    88. Indonesia MARKET SIZE ESTIMATES; FORECAST
      1. BY TECHNOLOGY, 2025-2035 (USD Billion)
      2. BY PRODUCT, 2025-2035 (USD Billion)
    89. Rest of APAC MARKET SIZE ESTIMATES; FORECAST
      1. BY TECHNOLOGY, 2025-2035 (USD Billion)
      2. BY PRODUCT, 2025-2035 (USD Billion)
    90. South America MARKET SIZE ESTIMATES; FORECAST
      1. BY TECHNOLOGY, 2025-2035 (USD Billion)
      2. BY PRODUCT, 2025-2035 (USD Billion)
    91. Brazil MARKET SIZE ESTIMATES; FORECAST
      1. BY TECHNOLOGY, 2025-2035 (USD Billion)
      2. BY PRODUCT, 2025-2035 (USD Billion)
    92. Mexico MARKET SIZE ESTIMATES; FORECAST
      1. BY TECHNOLOGY, 2025-2035 (USD Billion)
      2. BY PRODUCT, 2025-2035 (USD Billion)
    93. Argentina MARKET SIZE ESTIMATES; FORECAST
      1. BY TECHNOLOGY, 2025-2035 (USD Billion)
      2. BY PRODUCT, 2025-2035 (USD Billion)
    94. Rest of South America MARKET SIZE ESTIMATES; FORECAST
      1. BY TECHNOLOGY, 2025-2035 (USD Billion)
      2. BY PRODUCT, 2025-2035 (USD Billion)
    95. MEA MARKET SIZE ESTIMATES; FORECAST
      1. BY TECHNOLOGY, 2025-2035 (USD Billion)
      2. BY PRODUCT, 2025-2035 (USD Billion)
    96. GCC Countries MARKET SIZE ESTIMATES; FORECAST
      1. BY TECHNOLOGY, 2025-2035 (USD Billion)
      2. BY PRODUCT, 2025-2035 (USD Billion)
    97. South Africa MARKET SIZE ESTIMATES; FORECAST
      1. BY TECHNOLOGY, 2025-2035 (USD Billion)
      2. BY PRODUCT, 2025-2035 (USD Billion)
    98. Rest of MEA MARKET SIZE ESTIMATES; FORECAST
      1. BY TECHNOLOGY, 2025-2035 (USD Billion)
      2. BY PRODUCT, 2025-2035 (USD Billion)
    99. PRODUCT LAUNCH/PRODUCT DEVELOPMENT/APPROVAL
    100. ACQUISITION/PARTNERSHIP

DIY Smart Home Market Segmentation

DIY Smart Home Technology Outlook (USD Billion, 2018-2032)

Network Technology

Wireless Communication Technology

DIY Smart Home Product Outlook (USD Billion, 2018-2032)

Entertainment Control

Security & Access Control

Smart Kitchen

DIY Smart Home Regional Outlook (USD Billion, 2018-2032)

North America Outlook (USD Billion, 2018-2032)

North America DIY Smart Home by Technology

Network Technology

Wireless Communication Technology

North America DIY Smart Home by Product

Entertainment Control

Security & Access Control

Smart Kitchen

US Outlook (USD Billion, 2018-2032)

US DIY Smart Home by Technology

Fluorescence In Situ Hybridization (FISH)

Wireless Communication Technology

US DIY Smart Home by Product

Entertainment Control

Security & Access Control

Smart Kitchen

CANADA Outlook (USD Billion, 2018-2032)

CANADA DIY Smart Home by Technology

Network Technology

Wireless Communication Technology

CANADA DIY Smart Home by Product

Entertainment Control

Security & Access Control

Smart Kitchen

Europe Outlook (USD Billion, 2018-2032)

Europe DIY Smart Home by Technology

Network Technology

Wireless Communication Technology

Europe DIY Smart Home by Product

Entertainment Control

Security & Access Control

Smart Kitchen

Germany Outlook (USD Billion, 2018-2032)

Germany DIY Smart Home by Technology

Network Technology

Wireless Communication Technology

Germany DIY Smart Home by Product

Entertainment Control

Security & Access Control

Smart Kitchen

France Outlook (USD Billion, 2018-2032)

France DIY Smart Home by Technology

Network Technology

Wireless Communication Technology

France DIY Smart Home by Product

Entertainment Control

Security & Access Control

Smart Kitchen

UK Outlook (USD Billion, 2018-2032)

UK DIY Smart Home by Technology

Network Technology

Wireless Communication Technology

UK DIY Smart Home by Product

Entertainment Control

Security & Access Control

Smart Kitchen

ITALY Outlook (USD Billion, 2018-2032)

ITALY DIY Smart Home by Technology

Network Technology

Wireless Communication Technology

ITALY DIY Smart Home by Product

Entertainment Control

Security & Access Control

Smart Kitchen

SPAIN Outlook (USD Billion, 2018-2032)

Spain DIY Smart Home by Technology

Network Technology

Wireless Communication Technology

Spain DIY Smart Home by Product

Entertainment Control

Security & Access Control

Smart Kitchen

Rest Of Europe Outlook (USD Billion, 2018-2032)

Rest Of Europe DIY Smart Home by Technology

Network Technology

Wireless Communication Technology

REST OF EUROPE DIY Smart Home by Product

Entertainment Control

Security & Access Control

Smart Kitchen

Asia-Pacific Outlook (USD Billion, 2018-2032)

Asia-Pacific DIY Smart Home by Technology

Network Technology

Wireless Communication Technology

Asia-Pacific DIY Smart Home by Product

Entertainment Control

Security & Access Control

Smart Kitchen

China Outlook (USD Billion, 2018-2032)

China DIY Smart Home by Technology

Network Technology

Wireless Communication Technology

China DIY Smart Home by Product

Entertainment Control

Security & Access Control

Smart Kitchen

Japan Outlook (USD Billion, 2018-2032)

Japan DIY Smart Home by Technology

Network Technology

Wireless Communication Technology

Japan DIY Smart Home by Product

Entertainment Control

Security & Access Control

Smart Kitchen

India Outlook (USD Billion, 2018-2032)

India DIY Smart Home by Technology

Network Technology

Wireless Communication Technology

India DIY Smart Home by Product

Entertainment Control

Security & Access Control

Smart Kitchen

Australia Outlook (USD Billion, 2018-2032)

Australia DIY Smart Home by Technology

Network Technology

Wireless Communication Technology

Australia DIY Smart Home by Product

Entertainment Control

Security & Access Control

Smart Kitchen

Rest of Asia-Pacific Outlook (USD Billion, 2018-2032)

Rest of Asia-Pacific DIY Smart Home by Technology

Network Technology

Wireless Communication Technology

Rest of Asia-Pacific DIY Smart Home by Product

Entertainment Control

Security & Access Control

Smart Kitchen

Rest of the World Outlook (USD Billion, 2018-2032)

Rest of the World DIY Smart Home by Technology

Network Technology

Wireless Communication Technology

Rest of the World DIY Smart Home by Product

Entertainment Control

Security & Access Control

Smart Kitchen

Middle East Outlook (USD Billion, 2018-2032)

Middle East DIY Smart Home by Technology

Network Technology

Wireless Communication Technology

Middle East DIY Smart Home by Product

Entertainment Control

Security & Access Control

Smart Kitchen

Africa Outlook (USD Billion, 2018-2032)

Africa DIY Smart Home by Technology

Network Technology

Wireless Communication Technology

Africa DIY Smart Home by Product

Entertainment Control

Security & Access Control

Smart Kitchen

Latin America Outlook (USD Billion, 2018-2032)

Latin America DIY Smart Home by Technology

Network Technology

Wireless Communication Technology

Latin America DIY Smart Home by Product

Entertainment Control

Security & Access Control

Smart Kitchen

Infographic

Free Sample Request

Kindly complete the form below to receive a free sample of this Report

Get Free Sample

Customer Strories

“I am very pleased with how market segments have been defined in a relevant way for my purposes (such as "Portable Freezers & refrigerators" and "last-mile"). In general the report is well structured. Thanks very much for your efforts.”

Victoria Milne

Founder

Compare Licence

×
Features License Type
Single User Multiuser License Enterprise User
Price $4,950 $5,950 $7,250
Maximum User Access Limit 1 User Upto 10 Users Unrestricted Access Throughout the Organization
Free Customization
Direct Access to Analyst
Deliverable Format
Platform Access
Discount on Next Purchase 10% 15% 15%
Printable Versions