ID: MRFR/SEM/2958-CR
111 Pages
Ankit Gupta
Last Updated: April 15, 2026
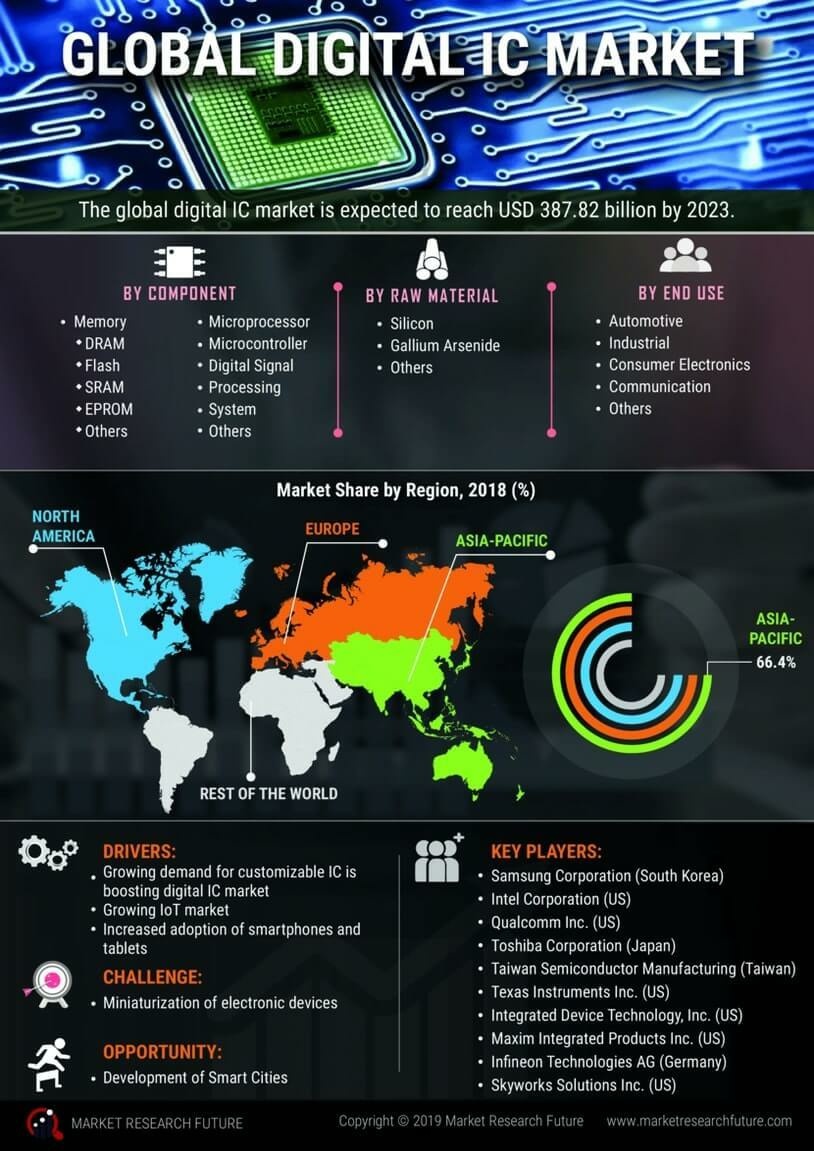
Digital IC Market Size, Share aResearch Report By Technology (Microcontrollers, Digital Signal Processors, Field-Programmable Gate Arrays, Application-Specific Integrated Circuits, System on Chip), By Component Type (Logic ICs, Memory ICs, Mixed-Signal ICs, Radio-Frequency ICs), By Application (Consumer Electronics, Telecommunication, Automotive, Industrial, Healthcare), By End Use (Personal Devices, Commercial Devices, Industrial Equipment) and By Regional (North America, Europe, South America, Asia Pacific, Middle East and Africa) - Industry Forecast Till 2035