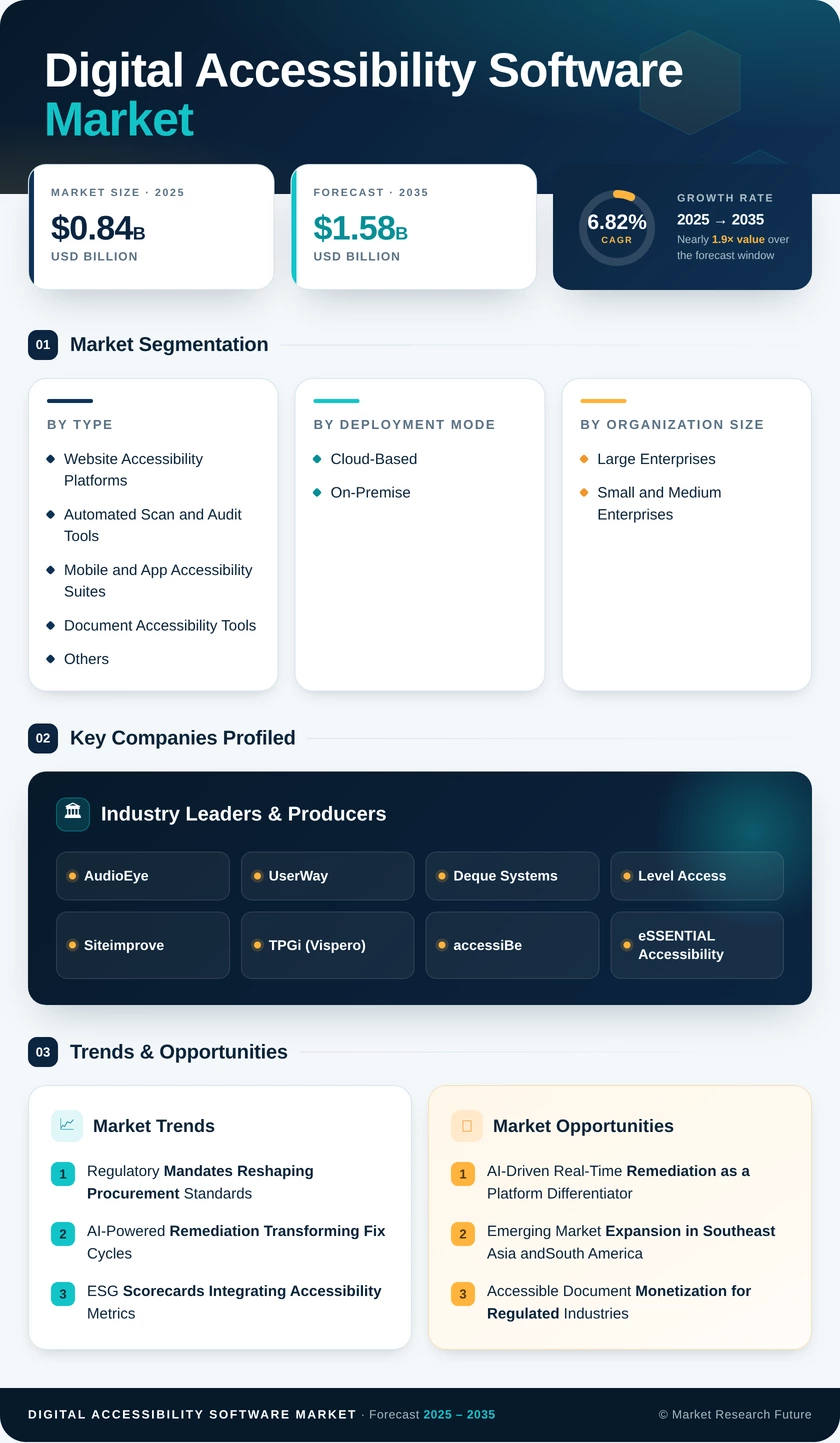
Digital Accessibility Software Market (2026 – 2035)

ID: MRFR/ICT/27537-HCR 100 Pages Nirmit Biswas Last Updated: October 20, 2026
Digital Accessibility Software Market Size, Share and Research Report By Type (Website Accessibility Platforms, Automated Scan and Audit Tools, Mobile and App Accessibility Suites, Document Accessibility Tools, Others), By Deployment Mode (Cloud-Based, On-Premise), By Organization Size (Large Enterprises, Small and Medium Enterprises), By End-User Industry (E-Commerce and Retail, BFSI, Government and Public Sector, Healthcare, Education, Others) and By Regional (North America, Europe, South America, Asia Pacific, Middle East and Africa) - Industry Forecast to 2035
Digital Accessibility Software Market
Market Size
Forecast Period2026-2035
CAGR (2026-2035)6.82%
2025 Market SizeUSD 0.84 Billion
2035 Market SizeUSD 1.58 Billion
Key Players
AudioEye
UserWay
Deque Systems
Level Access
Siteimprove
TPGi
Opportunities
  • AI-Driven Real-Time Remediation as a Platform Differentiator
  • Emerging Market Expansion in Southeast Asia andSouth America
  • Accessible Document Monetization for Regulated Industries
  1. 1 Market Overview |
    1. 1.1 Study Assumptions & Market Definition |
    2. 1.2 Scope of the Study |
    3. 1.3 Research Methodology
  2. 2 Market Summary & Key Takeaways
  3. 3 Market Dynamics |
    1. 3.1 Market Drivers Analysis | |
      1. 3.1.1 Regulatory Mandate Expansion (EAA, Section 508 Refresh) | |
      2. 3.1.2 AI-Powered Auto-Remediation Adoption | |
      3. 3.1.3 ESG & Sustainability Reporting Requirements | |
      4. 3.1.4 Mobile-First Accessibility Mandates | |
      5. 3.1.5 Litigation & Legal Liability Pressure |
    2. 3.2 Market Restraints Analysis | |
      1. 3.2.1 High Implementation Cost for SMEs | |
      2. 3.2.2 Fragmented Regulatory Standards Across Jurisdictions | |
      3. 3.2.3 Shortage of Certified Accessibility Auditors | |
      4. 3.2.4 AI False-Positive Remediation Risk |
    3. 3.3 Market Opportunity Analysis | |
      1. 3.3.1 Embedded Accessibility in Low-Code/No-Code Platforms | |
      2. 3.3.2 Asia-Pacific Public-Sector Digitization | |
      3. 3.3.3 Accessibility-as-a-Service Revenue Models | |
      4. 3.3.4 Data Monetization Through Accessibility Analytics | |
      5. 3.3.5 Emerging-Market Localization |
    4. 3.4 Industry Value Chain Analysis |
    5. 3.5 Porter’s Five Forces Analysis
  4. 4 Global Digital Accessibility Software Market Size & Forecast (2021–2035) |
    1. 4.1 Historical Market Size (2021–2025) |
    2. 4.2 Current & Forecast Market Size (2026–2035) |
    3. 4.3 Market Size by Revenue (USD Billion) |
    4. 4.4 Year-over-Year Growth Analysis
  5. 5 Segmentation Analysis |
    1. 5.1 By Type | |
      1. 5.1.1 Website Accessibility Platforms | |
      2. 5.1.2 Automated Scan and Audit Tools | |
      3. 5.1.3 Mobile and App Accessibility Suites | |
      4. 5.1.4 Document Accessibility Tools | |
      5. 5.1.5 Others |
    2. 5.2 By Deployment Mode | |
      1. 5.2.1 Cloud-Based | |
      2. 5.2.2 On-Premise |
    3. 5.3 By Organization Size | |
      1. 5.3.1 Large Enterprises | |
      2. 5.3.2 Small and Medium Enterprises |
    4. 5.4 By End-User Industry | |
      1. 5.4.1 E-Commerce and Retail | |
      2. 5.4.2 BFSI | |
      3. 5.4.3 Government and Public Sector | |
      4. 5.4.4 Healthcare | |
      5. 5.4.5 Education | |
      6. 5.4.6 Others
  6. 6 Regional Analysis |
    1. 6.1 North America | |
      1. 6.1.1 United States | |
      2. 6.1.2 Canada | |
      3. 6.1.3 Mexico |
    2. 6.2 Europe | |
      1. 6.2.1 Germany | |
      2. 6.2.2 United Kingdom | |
      3. 6.2.3 France | |
      4. 6.2.4 Italy | |
      5. 6.2.5 Spain | |
      6. 6.2.6 Nordic Countries | |
      7. 6.2.7 Russia | |
      8. 6.2.8 Rest of Europe |
    3. 6.3 Asia-Pacific | |
      1. 6.3.1 China | |
      2. 6.3.2 India | |
      3. 6.3.3 Japan | |
      4. 6.3.4 South Korea | |
      5. 6.3.5 ASEAN | |
      6. 6.3.6 Rest of Asia-Pacific |
    4. 6.4 South America | |
      1. 6.4.1 Brazil | |
      2. 6.4.2 Argentina | |
      3. 6.4.3 Rest of South America |
    5. 6.5 Middle East & Africa | |
      1. 6.5.1 Saudi Arabia | |
      2. 6.5.2 UAE | |
      3. 6.5.3 South Africa | |
      4. 6.5.4 Egypt | |
      5. 6.5.5 Rest of MEA
  7. 7 Competitive Landscape |
    1. 7.1 Market Share Analysis (2026) |
    2. 7.2 Competitive Benchmarking Matrix |
    3. 7.3 Company Profiles | |
      1. 7.3.1 Deque Systems | |
      2. 7.3.2 Level Access | |
      3. 7.3.3 AudioEye | |
      4. 7.3.4 accessiBe | |
      5. 7.3.5 Siteimprove | |
      6. 7.3.6 UserWay | |
      7. 7.3.7 TPGi (Vispero) | |
      8. 7.3.8 Monsido (Acquia) | |
      9. 7.3.9 eSSENTIAL Accessibility | |
      10. 7.3.10 Tenon.io
  8. 8 Future Outlook & Strategic Recommendations (2026–2035) |
    1. 8.1 Near-Term Outlook (2026–2028) |
    2. 8.2 Medium-Term Outlook (2029–2031) |
    3. 8.3 Long-Term Outlook (2032–2035)
  9. 9 Recent Developments & News
  10. 10 Frequently Asked Questions (FAQs)
  11. 11 Report Scope & Methodology |
    1. 11.1 Study Period & Base Year |
    2. 11.2 Data Sources & Citations |
    3. 11.3 Abbreviations
  12. 12 LIST OF TABLES |
  13. TABLE 1 Global Digital Accessibility Software Market Size & Forecast, by Revenue (USD Billion), 2021–2035 |
  14. TABLE 2 Global Digital Accessibility Software Market – Year-over-Year Growth Analysis, 2021–2035 |
  15. TABLE 3 Global Digital Accessibility Software Market Size, By Type, 2021–2035 (USD Billion) |
  16. TABLE 4 Global Digital Accessibility Software Market Size, By Deployment Mode, 2021–2035 (USD Billion) |
  17. TABLE 5 Global Digital Accessibility Software Market Size, By Organization Size, 2021–2035 (USD Billion) |
  18. TABLE 6 Global Digital Accessibility Software Market Size, By End-User Industry, 2021–2035 (USD Billion) |
  19. TABLE 7 Global Digital Accessibility Software Market Size, by Region, 2021–2035 (USD Billion) |
  20. TABLE 8 North America Digital Accessibility Software Market Size, by Country, 2021–2035 (USD Billion) |
  21. TABLE 9 Europe Digital Accessibility Software Market Size, by Country, 2021–2035 (USD Billion) |
  22. TABLE 10 Asia-Pacific Digital Accessibility Software Market Size, by Country, 2021–2035 (USD Billion) |
  23. TABLE 11 South America Digital Accessibility Software Market Size, by Country, 2021–2035 (USD Billion) |
  24. TABLE 12 Middle East & Africa Digital Accessibility Software Market Size, by Country, 2021–2035 (USD Billion) |
  25. TABLE 13 Competitive Benchmarking Matrix – Global Digital Accessibility Software Market, 2026 |
  26. TABLE 14 Company Profiles – Key Players, Global Digital Accessibility Software Market |
  27. TABLE 15 Recent Developments & Strategic Announcements, 2023–2025 |
  28. TABLE 16 North America Digital Accessibility Software Market Size, By Type, 2021–2035 (USD Billion) |
  29. TABLE 17 North America Digital Accessibility Software Market Size, By Deployment Mode, 2021–2035 (USD Billion) |
  30. TABLE 18 North America Digital Accessibility Software Market Size, By Organization Size, 2021–2035 (USD Billion) |
  31. TABLE 19 North America Digital Accessibility Software Market Size, By End-User Industry, 2021–2035 (USD Billion) |
  32. TABLE 20 Europe Digital Accessibility Software Market Size, By Type, 2021–2035 (USD Billion) |
  33. TABLE 21 Europe Digital Accessibility Software Market Size, By Deployment Mode, 2021–2035 (USD Billion) |
  34. TABLE 22 Europe Digital Accessibility Software Market Size, By Organization Size, 2021–2035 (USD Billion) |
  35. TABLE 23 Europe Digital Accessibility Software Market Size, By End-User Industry, 2021–2035 (USD Billion) |
  36. TABLE 24 Asia-Pacific Digital Accessibility Software Market Size, By Type, 2021–2035 (USD Billion) |
  37. TABLE 25 Asia-Pacific Digital Accessibility Software Market Size, By Deployment Mode, 2021–2035 (USD Billion) |
  38. TABLE 26 Asia-Pacific Digital Accessibility Software Market Size, By Organization Size, 2021–2035 (USD Billion) |
  39. TABLE 27 Asia-Pacific Digital Accessibility Software Market Size, By End-User Industry, 2021–2035 (USD Billion) |
  40. TABLE 28 South America Digital Accessibility Software Market Size, By Type, 2021–2035 (USD Billion) |
  41. TABLE 29 South America Digital Accessibility Software Market Size, By Deployment Mode, 2021–2035 (USD Billion) |
  42. TABLE 30 South America Digital Accessibility Software Market Size, By Organization Size, 2021–2035 (USD Billion) |
  43. TABLE 31 South America Digital Accessibility Software Market Size, By End-User Industry, 2021–2035 (USD Billion) |
  44. TABLE 32 Middle East & Africa Digital Accessibility Software Market Size, By Type, 2021–2035 (USD Billion) |
  45. TABLE 33 Middle East & Africa Digital Accessibility Software Market Size, By Deployment Mode, 2021–2035 (USD Billion) |
  46. TABLE 34 Middle East & Africa Digital Accessibility Software Market Size, By Organization Size, 2021–2035 (USD Billion) |
  47. TABLE 35 Middle East & Africa Digital Accessibility Software Market Size, By End-User Industry, 2021–2035 (USD Billion) |
  48. TABLE 36 United States Digital Accessibility Software Market Size, By Type, 2021–2035 (USD Billion) |
  49. TABLE 37 United States Digital Accessibility Software Market Size, By Deployment Mode, 2021–2035 (USD Billion) |
  50. TABLE 38 United States Digital Accessibility Software Market Size, By Organization Size, 2021–2035 (USD Billion) |
  51. TABLE 39 United States Digital Accessibility Software Market Size, By End-User Industry, 2021–2035 (USD Billion) |
  52. TABLE 40 Canada Digital Accessibility Software Market Size, By Type, 2021–2035 (USD Billion) |
  53. TABLE 41 Canada Digital Accessibility Software Market Size, By Deployment Mode, 2021–2035 (USD Billion) |
  54. TABLE 42 Canada Digital Accessibility Software Market Size, By Organization Size, 2021–2035 (USD Billion) |
  55. TABLE 43 Canada Digital Accessibility Software Market Size, By End-User Industry, 2021–2035 (USD Billion) |
  56. TABLE 44 Mexico Digital Accessibility Software Market Size, By Type, 2021–2035 (USD Billion) |
  57. TABLE 45 Mexico Digital Accessibility Software Market Size, By Deployment Mode, 2021–2035 (USD Billion) |
  58. TABLE 46 Mexico Digital Accessibility Software Market Size, By Organization Size, 2021–2035 (USD Billion) |
  59. TABLE 47 Mexico Digital Accessibility Software Market Size, By End-User Industry, 2021–2035 (USD Billion) |
  60. TABLE 48 Germany Digital Accessibility Software Market Size, By Type, 2021–2035 (USD Billion) |
  61. TABLE 49 Germany Digital Accessibility Software Market Size, By Deployment Mode, 2021–2035 (USD Billion) |
  62. TABLE 50 Germany Digital Accessibility Software Market Size, By Organization Size, 2021–2035 (USD Billion) |
  63. TABLE 51 Germany Digital Accessibility Software Market Size, By End-User Industry, 2021–2035 (USD Billion) |
  64. TABLE 52 United Kingdom Digital Accessibility Software Market Size, By Type, 2021–2035 (USD Billion) |
  65. TABLE 53 United Kingdom Digital Accessibility Software Market Size, By Deployment Mode, 2021–2035 (USD Billion) |
  66. TABLE 54 United Kingdom Digital Accessibility Software Market Size, By Organization Size, 2021–2035 (USD Billion) |
  67. TABLE 55 United Kingdom Digital Accessibility Software Market Size, By End-User Industry, 2021–2035 (USD Billion) |
  68. TABLE 56 France Digital Accessibility Software Market Size, By Type, 2021–2035 (USD Billion) |
  69. TABLE 57 France Digital Accessibility Software Market Size, By Deployment Mode, 2021–2035 (USD Billion) |
  70. TABLE 58 France Digital Accessibility Software Market Size, By Organization Size, 2021–2035 (USD Billion) |
  71. TABLE 59 France Digital Accessibility Software Market Size, By End-User Industry, 2021–2035 (USD Billion) |
  72. TABLE 60 Italy Digital Accessibility Software Market Size, By Type, 2021–2035 (USD Billion) |
  73. TABLE 61 Italy Digital Accessibility Software Market Size, By Deployment Mode, 2021–2035 (USD Billion) |
  74. TABLE 62 Italy Digital Accessibility Software Market Size, By Organization Size, 2021–2035 (USD Billion) |
  75. TABLE 63 Italy Digital Accessibility Software Market Size, By End-User Industry, 2021–2035 (USD Billion) |
  76. TABLE 64 Spain Digital Accessibility Software Market Size, By Type, 2021–2035 (USD Billion) |
  77. TABLE 65 Spain Digital Accessibility Software Market Size, By Deployment Mode, 2021–2035 (USD Billion) |
  78. TABLE 66 Spain Digital Accessibility Software Market Size, By Organization Size, 2021–2035 (USD Billion) |
  79. TABLE 67 Spain Digital Accessibility Software Market Size, By End-User Industry, 2021–2035 (USD Billion) |
  80. TABLE 68 Nordic Countries Digital Accessibility Software Market Size, By Type, 2021–2035 (USD Billion) |
  81. TABLE 69 Nordic Countries Digital Accessibility Software Market Size, By Deployment Mode, 2021–2035 (USD Billion) |
  82. TABLE 70 Nordic Countries Digital Accessibility Software Market Size, By Organization Size, 2021–2035 (USD Billion) |
  83. TABLE 71 Nordic Countries Digital Accessibility Software Market Size, By End-User Industry, 2021–2035 (USD Billion) |
  84. TABLE 72 Russia Digital Accessibility Software Market Size, By Type, 2021–2035 (USD Billion) |
  85. TABLE 73 Russia Digital Accessibility Software Market Size, By Deployment Mode, 2021–2035 (USD Billion) |
  86. TABLE 74 Russia Digital Accessibility Software Market Size, By Organization Size, 2021–2035 (USD Billion) |
  87. TABLE 75 Russia Digital Accessibility Software Market Size, By End-User Industry, 2021–2035 (USD Billion) |
  88. TABLE 76 Rest of Europe Digital Accessibility Software Market Size, By Type, 2021–2035 (USD Billion) |
  89. TABLE 77 Rest of Europe Digital Accessibility Software Market Size, By Deployment Mode, 2021–2035 (USD Billion) |
  90. TABLE 78 Rest of Europe Digital Accessibility Software Market Size, By Organization Size, 2021–2035 (USD Billion) |
  91. TABLE 79 Rest of Europe Digital Accessibility Software Market Size, By End-User Industry, 2021–2035 (USD Billion) |
  92. TABLE 80 China Digital Accessibility Software Market Size, By Type, 2021–2035 (USD Billion) |
  93. TABLE 81 China Digital Accessibility Software Market Size, By Deployment Mode, 2021–2035 (USD Billion) |
  94. TABLE 82 China Digital Accessibility Software Market Size, By Organization Size, 2021–2035 (USD Billion) |
  95. TABLE 83 China Digital Accessibility Software Market Size, By End-User Industry, 2021–2035 (USD Billion) |
  96. TABLE 84 India Digital Accessibility Software Market Size, By Type, 2021–2035 (USD Billion) |
  97. TABLE 85 India Digital Accessibility Software Market Size, By Deployment Mode, 2021–2035 (USD Billion) |
  98. TABLE 86 India Digital Accessibility Software Market Size, By Organization Size, 2021–2035 (USD Billion) |
  99. TABLE 87 India Digital Accessibility Software Market Size, By End-User Industry, 2021–2035 (USD Billion) |
  100. TABLE 88 Japan Digital Accessibility Software Market Size, By Type, 2021–2035 (USD Billion) |
  101. TABLE 89 Japan Digital Accessibility Software Market Size, By Deployment Mode, 2021–2035 (USD Billion) |
  102. TABLE 90 Japan Digital Accessibility Software Market Size, By Organization Size, 2021–2035 (USD Billion) |
  103. TABLE 91 Japan Digital Accessibility Software Market Size, By End-User Industry, 2021–2035 (USD Billion) |
  104. TABLE 92 South Korea Digital Accessibility Software Market Size, By Type, 2021–2035 (USD Billion) |
  105. TABLE 93 South Korea Digital Accessibility Software Market Size, By Deployment Mode, 2021–2035 (USD Billion) |
  106. TABLE 94 South Korea Digital Accessibility Software Market Size, By Organization Size, 2021–2035 (USD Billion) |
  107. TABLE 95 South Korea Digital Accessibility Software Market Size, By End-User Industry, 2021–2035 (USD Billion) |
  108. TABLE 96 ASEAN Digital Accessibility Software Market Size, By Type, 2021–2035 (USD Billion) |
  109. TABLE 97 ASEAN Digital Accessibility Software Market Size, By Deployment Mode, 2021–2035 (USD Billion) |
  110. TABLE 98 ASEAN Digital Accessibility Software Market Size, By Organization Size, 2021–2035 (USD Billion) |
  111. TABLE 99 ASEAN Digital Accessibility Software Market Size, By End-User Industry, 2021–2035 (USD Billion) |
  112. TABLE 100 Rest of Asia-Pacific Digital Accessibility Software Market Size, By Type, 2021–2035 (USD Billion) |
  113. TABLE 101 Rest of Asia-Pacific Digital Accessibility Software Market Size, By Deployment Mode, 2021–2035 (USD Billion) |
  114. TABLE 102 Rest of Asia-Pacific Digital Accessibility Software Market Size, By Organization Size, 2021–2035 (USD Billion) |
  115. TABLE 103 Rest of Asia-Pacific Digital Accessibility Software Market Size, By End-User Industry, 2021–2035 (USD Billion) |
  116. TABLE 104 Brazil Digital Accessibility Software Market Size, By Type, 2021–2035 (USD Billion) |
  117. TABLE 105 Brazil Digital Accessibility Software Market Size, By Deployment Mode, 2021–2035 (USD Billion) |
  118. TABLE 106 Brazil Digital Accessibility Software Market Size, By Organization Size, 2021–2035 (USD Billion) |
  119. TABLE 107 Brazil Digital Accessibility Software Market Size, By End-User Industry, 2021–2035 (USD Billion) |
  120. TABLE 108 Argentina Digital Accessibility Software Market Size, By Type, 2021–2035 (USD Billion) |
  121. TABLE 109 Argentina Digital Accessibility Software Market Size, By Deployment Mode, 2021–2035 (USD Billion) |
  122. TABLE 110 Argentina Digital Accessibility Software Market Size, By Organization Size, 2021–2035 (USD Billion) |
  123. TABLE 111 Argentina Digital Accessibility Software Market Size, By End-User Industry, 2021–2035 (USD Billion) |
  124. TABLE 112 Rest of South America Digital Accessibility Software Market Size, By Type, 2021–2035 (USD Billion) |
  125. TABLE 113 Rest of South America Digital Accessibility Software Market Size, By Deployment Mode, 2021–2035 (USD Billion) |
  126. TABLE 114 Rest of South America Digital Accessibility Software Market Size, By Organization Size, 2021–2035 (USD Billion) |
  127. TABLE 115 Rest of South America Digital Accessibility Software Market Size, By End-User Industry, 2021–2035 (USD Billion) |
  128. TABLE 116 Saudi Arabia Digital Accessibility Software Market Size, By Type, 2021–2035 (USD Billion) |
  129. TABLE 117 Saudi Arabia Digital Accessibility Software Market Size, By Deployment Mode, 2021–2035 (USD Billion) |
  130. TABLE 118 Saudi Arabia Digital Accessibility Software Market Size, By Organization Size, 2021–2035 (USD Billion) |
  131. TABLE 119 Saudi Arabia Digital Accessibility Software Market Size, By End-User Industry, 2021–2035 (USD Billion) |
  132. TABLE 120 UAE Digital Accessibility Software Market Size, By Type, 2021–2035 (USD Billion) |
  133. TABLE 121 UAE Digital Accessibility Software Market Size, By Deployment Mode, 2021–2035 (USD Billion) |
  134. TABLE 122 UAE Digital Accessibility Software Market Size, By Organization Size, 2021–2035 (USD Billion) |
  135. TABLE 123 UAE Digital Accessibility Software Market Size, By End-User Industry, 2021–2035 (USD Billion) |
  136. TABLE 124 South Africa Digital Accessibility Software Market Size, By Type, 2021–2035 (USD Billion) |
  137. TABLE 125 South Africa Digital Accessibility Software Market Size, By Deployment Mode, 2021–2035 (USD Billion) |
  138. TABLE 126 South Africa Digital Accessibility Software Market Size, By Organization Size, 2021–2035 (USD Billion) |
  139. TABLE 127 South Africa Digital Accessibility Software Market Size, By End-User Industry, 2021–2035 (USD Billion) |
  140. TABLE 128 Egypt Digital Accessibility Software Market Size, By Type, 2021–2035 (USD Billion) |
  141. TABLE 129 Egypt Digital Accessibility Software Market Size, By Deployment Mode, 2021–2035 (USD Billion) |
  142. TABLE 130 Egypt Digital Accessibility Software Market Size, By Organization Size, 2021–2035 (USD Billion) |
  143. TABLE 131 Egypt Digital Accessibility Software Market Size, By End-User Industry, 2021–2035 (USD Billion) |
  144. TABLE 132 Rest of MEA Digital Accessibility Software Market Size, By Type, 2021–2035 (USD Billion) |
  145. TABLE 133 Rest of MEA Digital Accessibility Software Market Size, By Deployment Mode, 2021–2035 (USD Billion) |
  146. TABLE 134 Rest of MEA Digital Accessibility Software Market Size, By Organization Size, 2021–2035 (USD Billion) |
  147. TABLE 135 Rest of MEA Digital Accessibility Software Market Size, By End-User Industry, 2021–2035 (USD Billion)
  148. 13 LIST OF FIGURES |
  149. FIGURE 1 Global Digital Accessibility Software Market – Market Dynamics Framework |
  150. FIGURE 2 Global Digital Accessibility Software Market – Porter’s Five Forces Analysis |
  151. FIGURE 3 Global Digital Accessibility Software Market – Industry Value Chain Analysis |
  152. FIGURE 4 Global Digital Accessibility Software Market Size (USD Billion), 2021–2035 |
  153. FIGURE 5 Global Digital Accessibility Software Market – Revenue Share By Type, 2026 |
  154. FIGURE 6 Global Digital Accessibility Software Market – Revenue Share By Deployment Mode, 2026 |
  155. FIGURE 7 Global Digital Accessibility Software Market – Revenue Share By Organization Size, 2026 |
  156. FIGURE 8 Global Digital Accessibility Software Market – Revenue Share By End-User Industry, 2026 |
  157. FIGURE 9 Global Digital Accessibility Software Market – Revenue Share by Region, 2026 |
  158. FIGURE 10 North America Digital Accessibility Software Market – Revenue Share by Country, 2026 |
  159. FIGURE 11 Europe Digital Accessibility Software Market – Revenue Share by Country, 2026 |
  160. FIGURE 12 Asia-Pacific Digital Accessibility Software Market – Revenue Share by Country, 2026 |
  161. FIGURE 13 South America Digital Accessibility Software Market – Revenue Share by Country, 2026 |
  162. FIGURE 14 Middle East & Africa Digital Accessibility Software Market – Revenue Share by Country, 2026 |
  163. FIGURE 15 Global Digital Accessibility Software Market – Competitive Market Share Analysis, 2026 |
  164. FIGURE 16 North America Digital Accessibility Software Market – Revenue Share By Type, 2026 |
  165. FIGURE 17 North America Digital Accessibility Software Market – Revenue Share By Deployment Mode, 2026 |
  166. FIGURE 18 North America Digital Accessibility Software Market – Revenue Share By Organization Size, 2026 |
  167. FIGURE 19 North America Digital Accessibility Software Market – Revenue Share By End-User Industry, 2026 |
  168. FIGURE 20 Europe Digital Accessibility Software Market – Revenue Share By Type, 2026 |
  169. FIGURE 21 Europe Digital Accessibility Software Market – Revenue Share By Deployment Mode, 2026 |
  170. FIGURE 22 Europe Digital Accessibility Software Market – Revenue Share By Organization Size, 2026 |
  171. FIGURE 23 Europe Digital Accessibility Software Market – Revenue Share By End-User Industry, 2026 |
  172. FIGURE 24 Asia-Pacific Digital Accessibility Software Market – Revenue Share By Type, 2026 |
  173. FIGURE 25 Asia-Pacific Digital Accessibility Software Market – Revenue Share By Deployment Mode, 2026 |
  174. FIGURE 26 Asia-Pacific Digital Accessibility Software Market – Revenue Share By Organization Size, 2026 |
  175. FIGURE 27 Asia-Pacific Digital Accessibility Software Market – Revenue Share By End-User Industry, 2026 |
  176. FIGURE 28 South America Digital Accessibility Software Market – Revenue Share By Type, 2026 |
  177. FIGURE 29 South America Digital Accessibility Software Market – Revenue Share By Deployment Mode, 2026 |
  178. FIGURE 30 South America Digital Accessibility Software Market – Revenue Share By Organization Size, 2026 |
  179. FIGURE 31 South America Digital Accessibility Software Market – Revenue Share By End-User Industry, 2026 |
  180. FIGURE 32 Middle East & Africa Digital Accessibility Software Market – Revenue Share By Type, 2026 |
  181. FIGURE 33 Middle East & Africa Digital Accessibility Software Market – Revenue Share By Deployment Mode, 2026 |
  182. FIGURE 34 Middle East & Africa Digital Accessibility Software Market – Revenue Share By Organization Size, 2026 |
  183. FIGURE 35 Middle East & Africa Digital Accessibility Software Market – Revenue Share By End-User Industry, 2026 |
  184. FIGURE 36 United States Digital Accessibility Software Market – Revenue Share By Type, 2026 |
  185. FIGURE 37 United States Digital Accessibility Software Market – Revenue Share By Deployment Mode, 2026 |
  186. FIGURE 38 United States Digital Accessibility Software Market – Revenue Share By Organization Size, 2026 |
  187. FIGURE 39 United States Digital Accessibility Software Market – Revenue Share By End-User Industry, 2026 |
  188. FIGURE 40 Canada Digital Accessibility Software Market – Revenue Share By Type, 2026 |
  189. FIGURE 41 Canada Digital Accessibility Software Market – Revenue Share By Deployment Mode, 2026 |
  190. FIGURE 42 Canada Digital Accessibility Software Market – Revenue Share By Organization Size, 2026 |
  191. FIGURE 43 Canada Digital Accessibility Software Market – Revenue Share By End-User Industry, 2026 |
  192. FIGURE 44 Mexico Digital Accessibility Software Market – Revenue Share By Type, 2026 |
  193. FIGURE 45 Mexico Digital Accessibility Software Market – Revenue Share By Deployment Mode, 2026 |
  194. FIGURE 46 Mexico Digital Accessibility Software Market – Revenue Share By Organization Size, 2026 |
  195. FIGURE 47 Mexico Digital Accessibility Software Market – Revenue Share By End-User Industry, 2026 |
  196. FIGURE 48 Germany Digital Accessibility Software Market – Revenue Share By Type, 2026 |
  197. FIGURE 49 Germany Digital Accessibility Software Market – Revenue Share By Deployment Mode, 2026 |
  198. FIGURE 50 Germany Digital Accessibility Software Market – Revenue Share By Organization Size, 2026 |
  199. FIGURE 51 Germany Digital Accessibility Software Market – Revenue Share By End-User Industry, 2026 |
  200. FIGURE 52 United Kingdom Digital Accessibility Software Market – Revenue Share By Type, 2026 |
  201. FIGURE 53 United Kingdom Digital Accessibility Software Market – Revenue Share By Deployment Mode, 2026 |
  202. FIGURE 54 United Kingdom Digital Accessibility Software Market – Revenue Share By Organization Size, 2026 |
  203. FIGURE 55 United Kingdom Digital Accessibility Software Market – Revenue Share By End-User Industry, 2026 |
  204. FIGURE 56 France Digital Accessibility Software Market – Revenue Share By Type, 2026 |
  205. FIGURE 57 France Digital Accessibility Software Market – Revenue Share By Deployment Mode, 2026 |
  206. FIGURE 58 France Digital Accessibility Software Market – Revenue Share By Organization Size, 2026 |
  207. FIGURE 59 France Digital Accessibility Software Market – Revenue Share By End-User Industry, 2026 |
  208. FIGURE 60 Italy Digital Accessibility Software Market – Revenue Share By Type, 2026 |
  209. FIGURE 61 Italy Digital Accessibility Software Market – Revenue Share By Deployment Mode, 2026 |
  210. FIGURE 62 Italy Digital Accessibility Software Market – Revenue Share By Organization Size, 2026 |
  211. FIGURE 63 Italy Digital Accessibility Software Market – Revenue Share By End-User Industry, 2026 |
  212. FIGURE 64 Spain Digital Accessibility Software Market – Revenue Share By Type, 2026 |
  213. FIGURE 65 Spain Digital Accessibility Software Market – Revenue Share By Deployment Mode, 2026 |
  214. FIGURE 66 Spain Digital Accessibility Software Market – Revenue Share By Organization Size, 2026 |
  215. FIGURE 67 Spain Digital Accessibility Software Market – Revenue Share By End-User Industry, 2026 |
  216. FIGURE 68 Nordic Countries Digital Accessibility Software Market – Revenue Share By Type, 2026 |
  217. FIGURE 69 Nordic Countries Digital Accessibility Software Market – Revenue Share By Deployment Mode, 2026 |
  218. FIGURE 70 Nordic Countries Digital Accessibility Software Market – Revenue Share By Organization Size, 2026 |
  219. FIGURE 71 Nordic Countries Digital Accessibility Software Market – Revenue Share By End-User Industry, 2026 |
  220. FIGURE 72 Russia Digital Accessibility Software Market – Revenue Share By Type, 2026 |
  221. FIGURE 73 Russia Digital Accessibility Software Market – Revenue Share By Deployment Mode, 2026 |
  222. FIGURE 74 Russia Digital Accessibility Software Market – Revenue Share By Organization Size, 2026 |
  223. FIGURE 75 Russia Digital Accessibility Software Market – Revenue Share By End-User Industry, 2026 |
  224. FIGURE 76 Rest of Europe Digital Accessibility Software Market – Revenue Share By Type, 2026 |
  225. FIGURE 77 Rest of Europe Digital Accessibility Software Market – Revenue Share By Deployment Mode, 2026 |
  226. FIGURE 78 Rest of Europe Digital Accessibility Software Market – Revenue Share By Organization Size, 2026 |
  227. FIGURE 79 Rest of Europe Digital Accessibility Software Market – Revenue Share By End-User Industry, 2026 |
  228. FIGURE 80 China Digital Accessibility Software Market – Revenue Share By Type, 2026 |
  229. FIGURE 81 China Digital Accessibility Software Market – Revenue Share By Deployment Mode, 2026 |
  230. FIGURE 82 China Digital Accessibility Software Market – Revenue Share By Organization Size, 2026 |
  231. FIGURE 83 China Digital Accessibility Software Market – Revenue Share By End-User Industry, 2026 |
  232. FIGURE 84 India Digital Accessibility Software Market – Revenue Share By Type, 2026 |
  233. FIGURE 85 India Digital Accessibility Software Market – Revenue Share By Deployment Mode, 2026 |
  234. FIGURE 86 India Digital Accessibility Software Market – Revenue Share By Organization Size, 2026 |
  235. FIGURE 87 India Digital Accessibility Software Market – Revenue Share By End-User Industry, 2026 |
  236. FIGURE 88 Japan Digital Accessibility Software Market – Revenue Share By Type, 2026 |
  237. FIGURE 89 Japan Digital Accessibility Software Market – Revenue Share By Deployment Mode, 2026 |
  238. FIGURE 90 Japan Digital Accessibility Software Market – Revenue Share By Organization Size, 2026 |
  239. FIGURE 91 Japan Digital Accessibility Software Market – Revenue Share By End-User Industry, 2026 |
  240. FIGURE 92 South Korea Digital Accessibility Software Market – Revenue Share By Type, 2026 |
  241. FIGURE 93 South Korea Digital Accessibility Software Market – Revenue Share By Deployment Mode, 2026 |
  242. FIGURE 94 South Korea Digital Accessibility Software Market – Revenue Share By Organization Size, 2026 |
  243. FIGURE 95 South Korea Digital Accessibility Software Market – Revenue Share By End-User Industry, 2026 |
  244. FIGURE 96 ASEAN Digital Accessibility Software Market – Revenue Share By Type, 2026 |
  245. FIGURE 97 ASEAN Digital Accessibility Software Market – Revenue Share By Deployment Mode, 2026 |
  246. FIGURE 98 ASEAN Digital Accessibility Software Market – Revenue Share By Organization Size, 2026 |
  247. FIGURE 99 ASEAN Digital Accessibility Software Market – Revenue Share By End-User Industry, 2026 |
  248. FIGURE 100 Rest of Asia-Pacific Digital Accessibility Software Market – Revenue Share By Type, 2026 |
  249. FIGURE 101 Rest of Asia-Pacific Digital Accessibility Software Market – Revenue Share By Deployment Mode, 2026 |
  250. FIGURE 102 Rest of Asia-Pacific Digital Accessibility Software Market – Revenue Share By Organization Size, 2026 |
  251. FIGURE 103 Rest of Asia-Pacific Digital Accessibility Software Market – Revenue Share By End-User Industry, 2026 |
  252. FIGURE 104 Brazil Digital Accessibility Software Market – Revenue Share By Type, 2026 |
  253. FIGURE 105 Brazil Digital Accessibility Software Market – Revenue Share By Deployment Mode, 2026 |
  254. FIGURE 106 Brazil Digital Accessibility Software Market – Revenue Share By Organization Size, 2026 |
  255. FIGURE 107 Brazil Digital Accessibility Software Market – Revenue Share By End-User Industry, 2026 |
  256. FIGURE 108 Argentina Digital Accessibility Software Market – Revenue Share By Type, 2026 |
  257. FIGURE 109 Argentina Digital Accessibility Software Market – Revenue Share By Deployment Mode, 2026 |
  258. FIGURE 110 Argentina Digital Accessibility Software Market – Revenue Share By Organization Size, 2026 |
  259. FIGURE 111 Argentina Digital Accessibility Software Market – Revenue Share By End-User Industry, 2026 |
  260. FIGURE 112 Rest of South America Digital Accessibility Software Market – Revenue Share By Type, 2026 |
  261. FIGURE 113 Rest of South America Digital Accessibility Software Market – Revenue Share By Deployment Mode, 2026 |
  262. FIGURE 114 Rest of South America Digital Accessibility Software Market – Revenue Share By Organization Size, 2026 |
  263. FIGURE 115 Rest of South America Digital Accessibility Software Market – Revenue Share By End-User Industry, 2026 |
  264. FIGURE 116 Saudi Arabia Digital Accessibility Software Market – Revenue Share By Type, 2026 |
  265. FIGURE 117 Saudi Arabia Digital Accessibility Software Market – Revenue Share By Deployment Mode, 2026 |
  266. FIGURE 118 Saudi Arabia Digital Accessibility Software Market – Revenue Share By Organization Size, 2026 |
  267. FIGURE 119 Saudi Arabia Digital Accessibility Software Market – Revenue Share By End-User Industry, 2026 |
  268. FIGURE 120 UAE Digital Accessibility Software Market – Revenue Share By Type, 2026 |
  269. FIGURE 121 UAE Digital Accessibility Software Market – Revenue Share By Deployment Mode, 2026 |
  270. FIGURE 122 UAE Digital Accessibility Software Market – Revenue Share By Organization Size, 2026 |
  271. FIGURE 123 UAE Digital Accessibility Software Market – Revenue Share By End-User Industry, 2026 |
  272. FIGURE 124 South Africa Digital Accessibility Software Market – Revenue Share By Type, 2026 |
  273. FIGURE 125 South Africa Digital Accessibility Software Market – Revenue Share By Deployment Mode, 2026 |
  274. FIGURE 126 South Africa Digital Accessibility Software Market – Revenue Share By Organization Size, 2026 |
  275. FIGURE 127 South Africa Digital Accessibility Software Market – Revenue Share By End-User Industry, 2026 |
  276. FIGURE 128 Egypt Digital Accessibility Software Market – Revenue Share By Type, 2026 |
  277. FIGURE 129 Egypt Digital Accessibility Software Market – Revenue Share By Deployment Mode, 2026 |
  278. FIGURE 130 Egypt Digital Accessibility Software Market – Revenue Share By Organization Size, 2026 |
  279. FIGURE 131 Egypt Digital Accessibility Software Market – Revenue Share By End-User Industry, 2026 |
  280. FIGURE 132 Rest of MEA Digital Accessibility Software Market – Revenue Share By Type, 2026 |
  281. FIGURE 133 Rest of MEA Digital Accessibility Software Market – Revenue Share By Deployment Mode, 2026 |
  282. FIGURE 134 Rest of MEA Digital Accessibility Software Market – Revenue Share By Organization Size, 2026 |
  283. FIGURE 135 Rest of MEA Digital Accessibility Software Market – Revenue Share By End-User Industry, 2026

MARKET SEGMENTATION OVERVIEW

The global digital accessibility software market is analyzed across four primary segmentation dimensions. Each dimension reflects distinct demand drivers, regulatory treatment, and end-user requirements, enabling granular revenue forecasting and strategic positioning for market participants.

By Type

Sub-SegmentKey Trend
Website Accessibility PlatformsCore compliance layer; WCAG 2.2 overlay + code-level scanning
Automated Scan and Audit ToolsCI/CD pipeline integration; AI-driven violation detection
Mobile and App Accessibility SuitesMobile-first mandates; EAA & GIGW app coverage
Document Accessibility ToolsPDF/A remediation; enterprise document compliance
OthersVideo captioning, kiosk accessibility, IoT interfaces

Dominant Segment (2026): Website Accessibility Platforms (~38%) | Fastest Growing: Mobile & App Suites (7.92% CAGR)

By Deployment Mode

Sub-SegmentKey Trend
Cloud-BasedSaaS delivery; real-time updates; lower upfront cost
On-PremiseData sovereignty; defense/healthcare air-gapped networks

Dominant Segment (2026): Cloud-Based (~68%) | Fastest Growing: Cloud-Based (7.08% CAGR)

By Organization Size

Sub-SegmentKey Trend
Large EnterprisesBroadest regulatory surface; ESG reporting obligations
Small and Medium EnterprisesConsumption-based pricing; litigation risk awareness

Dominant Segment (2026): Large Enterprises (~57%) | Fastest Growing: SMEs (7.08% CAGR)

By End-User Industry

Sub-SegmentKey Trend
E-Commerce and RetailADA litigation volume; checkout flow accessibility
BFSIFinancial services accessibility regulations; WCAG mandates
Government and Public SectorSection 508; EU Accessibility Act; GIGW
Digital Accessibility Software MarketPatient portal compliance; HIPAA intersection
EducationSection 504; accessible courseware & LMS platforms
OthersMedia, telecom, travel, hospitality

Dominant Segment (2026): E-Commerce & Retail (~24%) | Fastest Growing: Govt. & Public Sector (7.94% CAGR)

SEGMENTATION QUICK REFERENCE

DimensionSub-SegmentsDominant Segment (2026)Fastest Growing
TypeWebsite Platforms · Scan & Audit · Mobile & App Suites · Document Tools · OthersWebsite Platforms (~38%)Mobile & App Suites (7.92%)
Deployment ModeCloud-Based · On-PremiseCloud-Based (~68%)Cloud-Based (7.08%)
Organization SizeLarge Enterprises · SMEsLarge Enterprises (~57%)SMEs (7.08%)
End-User IndustryE-Commerce & Retail · BFSI · Govt. & Public Sector · Digital Accessibility Software Market · Education · OthersE-Commerce & Retail (~24%)Govt. & Public Sector (7.94%)


Download PDF ×

We do not share your information with anyone. However, we may send you emails based on your report interest from time to time. You may contact us at any time to opt-out.