Dehydrated fruits & vegetables market Market Segmentation
Dehydrated fruits & vegetables market By Application (USD Billion, 2025-2035)
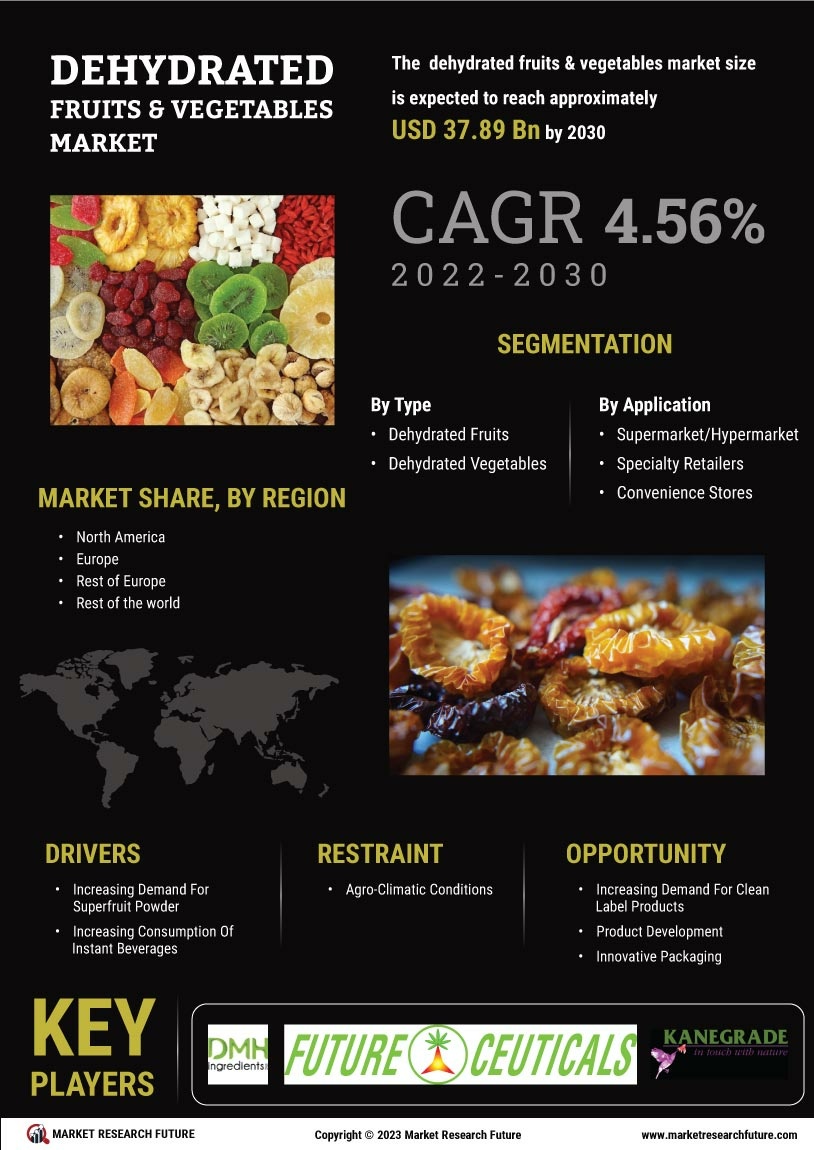
- Supermarket/Hypermarket
- Specialty Retailers
- Convenience Stores
- E-Commerce
- Others
Dehydrated fruits & vegetables market By Type (USD Billion, 2025-2035)
- Dehydrated Fruits
- Dehydrated Vegetables