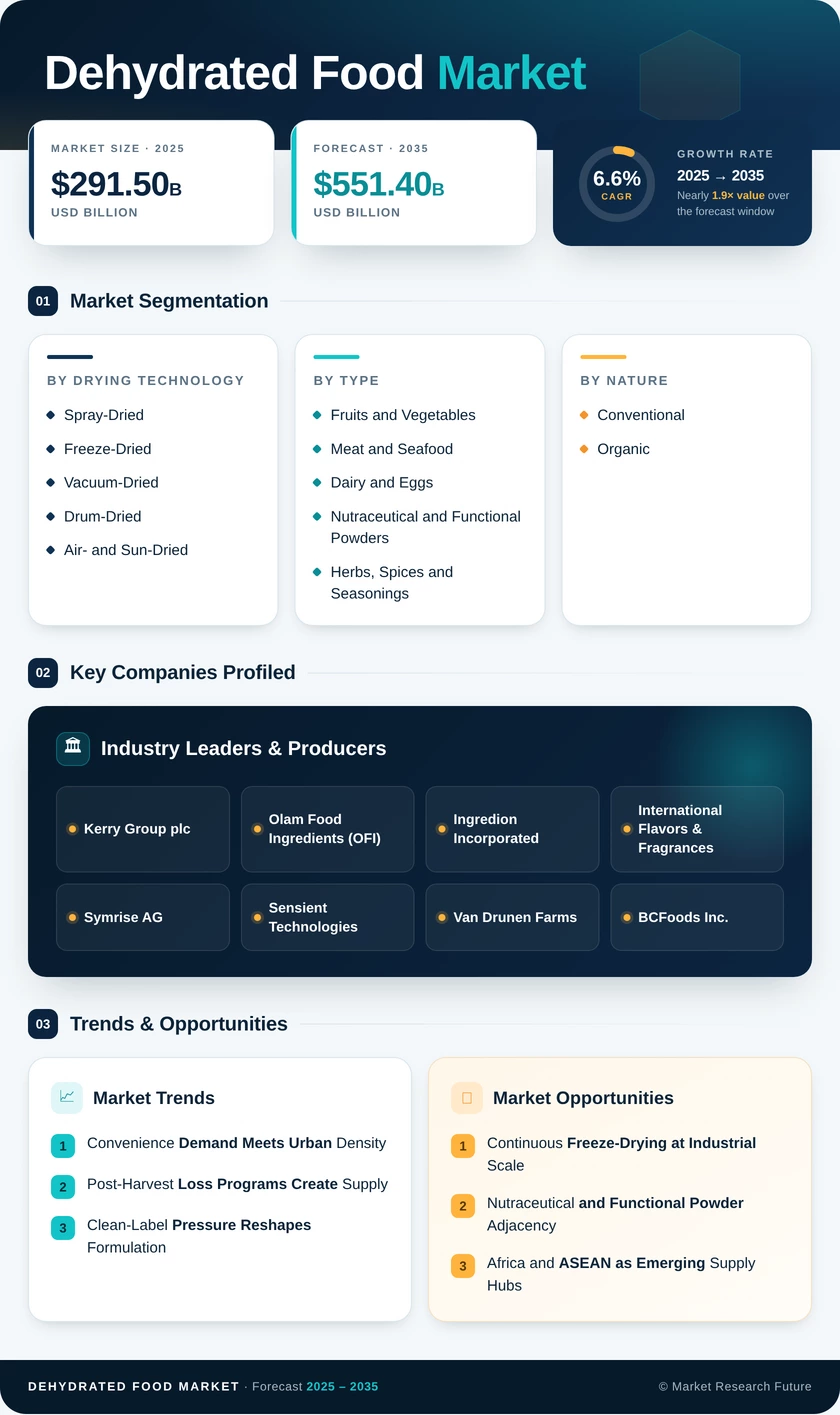
Dehydrated Food Market (2026 - 2035)

ID: MRFR/FnB/39836-HCR 100 Pages Sakshi Gupta Last Updated: September 17, 2026
Dehydrated Food Market Size, Share, Industry Trend & Analysis Research Report: By Drying Technology (Spray-Dried, Freeze-Dried, Vacuum-Dried, Drum-Dried, Air- and Sun-Dried), By Product Category (Fruits and Vegetables, Meat and Seafood, Dairy and Eggs, Nutraceutical and Functional Powders, Herbs, Spices and Seasonings), By Nature (Conventional, Organic), By End Use Application (Industrial Packaged Food, Foodservice, Retail), By Geography (North America, Europe, Asia-Pacific, South America, Middle East & Africa) - Forecast to 2035
Dehydrated Food Market
Market Size
Forecast Period2026-2035
CAGR (2026-2035)6.6%
2025 Market SizeUSD 291.5 Billion
2035 Market SizeUSD 551.4 Billion
Key Players
Kerry Group plc
Olam Food Ingredients
Ingredion Incorporated
International Flavors & Fragrances
Symrise AG
Sensient Technologies
Opportunities
  • Continuous Freeze-Drying at Industrial Scale
  • Nutraceutical and Functional Powder Adjacency
  • Africa and ASEAN as Emerging Supply Hubs
  1. 1 Market Overview |
    1. 1.1 Study Assumptions & Market Definition |
    2. 1.2 Scope of the Study |
    3. 1.3 Research Methodology
  2. 2 Market Summary & Key Report Takeaways |
    1. 2.1 By Technology |
    2. 2.2 By Sector |
    3. 2.3 By Geography
  3. 3 Market Size & Forecast (2021–2035) |
    1. 3.1 Historical Market Size (2021–2025) |
    2. 3.2 Current & Forecast Market Size (2026–2035) |
    3. 3.3 Market Size by Revenue (USD Billion) |
    4. 3.4 Year-over-Year Growth Analysis
  4. 4 Driver Impact Analysis |
    1. 4.1 Convenience Demand Meets Urban Density |
    2. 4.2 Post-Harvest Loss Programs Create Supply |
    3. 4.3 Clean-Label Pressure Reshapes Formulation
  5. 5 Restraints Impact Analysis |
    1. 5.1 Energy Costs Squeeze Thin Margins |
    2. 5.2 Harvest Volatility Passes Straight Through
  6. 6 Market Opportunity Analysis |
    1. 6.1 Continuous Freeze-Drying at Industrial Scale |
    2. 6.2 Nutraceutical and Functional Powder Adjacency |
    3. 6.3 Africa and ASEAN as Emerging Supply Hubs |
    4. 6.4 Traceability Data as a Monetisable Asset |
    5. 6.5 Retail-Ready Premium Formats |
    6. 6.6 Industry Value Chain Analysis |
    7. 6.7 Porter's Five Forces Analysis
  7. 7 Regional Market Share & Country-Level Analysis |
    1. 7.1 North America | |
      1. 7.1.1 US | |
      2. 7.1.2 Canada | |
      3. 7.1.3 Mexico |
    2. 7.2 Europe | |
      1. 7.2.1 Germany | |
      2. 7.2.2 UK | |
      3. 7.2.3 France | |
      4. 7.2.4 Italy | |
      5. 7.2.5 Spain | |
      6. 7.2.6 Nordic Countries | |
      7. 7.2.7 Russia | |
      8. 7.2.8 Rest of Europe |
    3. 7.3 Asia-Pacific | |
      1. 7.3.1 China | |
      2. 7.3.2 India | |
      3. 7.3.3 Japan | |
      4. 7.3.4 South Korea | |
      5. 7.3.5 ASEAN | |
      6. 7.3.6 Rest of Asia-Pacific |
    4. 7.4 South America | |
      1. 7.4.1 Brazil | |
      2. 7.4.2 Argentina | |
      3. 7.4.3 Rest of South America |
    5. 7.5 Middle East & Africa | |
      1. 7.5.1 Saudi Arabia | |
      2. 7.5.2 UAE | |
      3. 7.5.3 South Africa | |
      4. 7.5.4 Egypt | |
      5. 7.5.5 Rest of Middle East & Africa
  8. 8 Future Outlook (2026–2035) |
    1. 8.1 Process Intelligence and Autonomous Drying Control |
    2. 8.2 Energy Transition Reshapes Cost Curves |
    3. 8.3 Consolidation Around Certified Supply |
    4. 8.4 Scope 3 Reporting Enters Procurement Contracts
  9. 9 Market Segmentation Analysis |
    1. 9.1 By Drying Technology | |
      1. 9.1.1 Spray-Dried | |
      2. 9.1.2 Freeze-Dried | |
      3. 9.1.3 Vacuum-Dried | |
      4. 9.1.4 Drum-Dried | |
      5. 9.1.5 Air- and Sun-Dried |
    2. 9.2 By Product Category | |
      1. 9.2.1 Fruits and Vegetables | |
      2. 9.2.2 Meat and Seafood | |
      3. 9.2.3 Dairy and Eggs | |
      4. 9.2.4 Nutraceutical and Functional Powders | |
      5. 9.2.5 Herbs, Spices and Seasonings |
    3. 9.3 By Nature | |
      1. 9.3.1 Conventional | |
      2. 9.3.2 Organic |
    4. 9.4 By End Use Application | |
      1. 9.4.1 Industrial Packaged Food | |
      2. 9.4.2 Foodservice | |
      3. 9.4.3 Retail
  10. 10 Competitive Landscape |
    1. 10.1 Market Concentration Analysis (2026) |
    2. 10.2 Competitive Benchmarking Matrix |
    3. 10.3 Company Profiles | |
      1. 10.3.1 Kerry Group plc | |
      2. 10.3.2 Olam Food Ingredients (OFI) | |
      3. 10.3.3 Ingredion Incorporated | |
      4. 10.3.4 International Flavors & Fragrances | |
      5. 10.3.5 Symrise AG | |
      6. 10.3.6 Sensient Technologies | |
      7. 10.3.7 Van Drunen Farms | |
      8. 10.3.8 BCFoods Inc. | |
      9. 10.3.9 Silva International | |
      10. 10.3.10 Mercer Foods | |
      11. 10.3.11 Harmony House Foods
  11. 11 Recent Developments & News
  12. 12 Report Scope & Methodology |
    1. 12.1 Study Period & Base Year |
    2. 12.2 Valuation Currency & Units |
    3. 12.3 CAGR Driver Disclaimer
  13. 13 Detailed Sources & Citations
  14. 14 Frequently Asked Questions
  15. 15 LIST OF TABLES |
  16. TABLE 1 Global Dehydrated Food Market Size & Forecast, by Revenue (USD Billion), 2021–2035 |
  17. TABLE 2 Global Dehydrated Food Market — Year-over-Year Growth Analysis, 2021–2035 |
  18. TABLE 3 Driver Impact Analysis Matrix, 2026–2035 |
  19. TABLE 4 Restraint Impact Analysis Matrix, 2026–2035 |
  20. TABLE 5 Global Dehydrated Food Market Size, by Region, 2021–2035 (USD Billion) |
  21. TABLE 6 North America Dehydrated Food Market Size, by Country, 2021–2035 (USD Billion) |
  22. TABLE 7 Europe Dehydrated Food Market Size, by Country, 2021–2035 (USD Billion) |
  23. TABLE 8 Asia-Pacific Dehydrated Food Market Size, by Country, 2021–2035 (USD Billion) |
  24. TABLE 9 South America Dehydrated Food Market Size, by Country, 2021–2035 (USD Billion) |
  25. TABLE 10 Middle East & Africa Dehydrated Food Market Size, by Country, 2021–2035 (USD Billion) |
  26. TABLE 11 Global Dehydrated Food Market Size, by Drying Technology, 2021–2035 (USD Billion) |
  27. TABLE 12 Global Dehydrated Food Market Size, by Product Category, 2021–2035 (USD Billion) |
  28. TABLE 13 Global Dehydrated Food Market Size, by Nature, 2021–2035 (USD Billion) |
  29. TABLE 14 Global Dehydrated Food Market Size, by End Use Application, 2021–2035 (USD Billion) |
  30. TABLE 15 North America Dehydrated Food Market Size, by Drying Technology, 2021–2035 (USD Billion) |
  31. TABLE 16 North America Dehydrated Food Market Size, by Product Category, 2021–2035 (USD Billion) |
  32. TABLE 17 Europe Dehydrated Food Market Size, by Drying Technology, 2021–2035 (USD Billion) |
  33. TABLE 18 Europe Dehydrated Food Market Size, by Product Category, 2021–2035 (USD Billion) |
  34. TABLE 19 Asia-Pacific Dehydrated Food Market Size, by Drying Technology, 2021–2035 (USD Billion) |
  35. TABLE 20 Asia-Pacific Dehydrated Food Market Size, by Product Category, 2021–2035 (USD Billion) |
  36. TABLE 21 South America Dehydrated Food Market Size, by End Use Application, 2021–2035 (USD Billion) |
  37. TABLE 22 Middle East & Africa Dehydrated Food Market Size, by End Use Application, 2021–2035 (USD Billion) |
  38. TABLE 23 Competitive Benchmarking Matrix — Global Dehydrated Food Market, 2026 |
  39. TABLE 24 Company Profiles — Key Players, Global Dehydrated Food Market |
  40. TABLE 25 Recent Developments & Strategic Announcements, 2023–2025 |
  41. TABLE 26 Report Scope & Methodology Summary |
  42. TABLE 27 Detailed Sources & Citations Register
  43. 16 LIST OF FIGURES |
  44. FIGURE 1 Market Dynamics Overview — Drivers, Restraints and Opportunities |
  45. FIGURE 2 Industry Value Chain Analysis |
  46. FIGURE 3 Porter's Five Forces Analysis |
  47. FIGURE 4 Global Market Size Trend and Forecast, 2021–2035 (USD Billion) |
  48. FIGURE 5 Year-over-Year Growth Trajectory, 2022–2035 (%) |
  49. FIGURE 6 Market Share by Drying Technology, 2025 vs 2035 (%) |
  50. FIGURE 7 Market Share by Product Category, 2025 (%) |
  51. FIGURE 8 Market Share by Nature — Conventional vs Organic, 2025 vs 2035 (%) |
  52. FIGURE 9 Market Share by End Use Application, 2025 (%) |
  53. FIGURE 10 Regional Market Share Distribution, 2025 (%) |
  54. FIGURE 11 Regional CAGR Comparison, 2026–2035 (%) |
  55. FIGURE 12 North America Country-Level Share Breakdown, 2025 (%) |
  56. FIGURE 13 Europe Country-Level Share Breakdown, 2025 (%) |
  57. FIGURE 14 Asia-Pacific Country-Level Share Breakdown, 2025 (%) |
  58. FIGURE 15 Competitive Landscape — Estimated Revenue Share Bands, 2026 |
  59. FIGURE 16 Strategic Positioning Map — Scale vs Specialisation |
  60. FIGURE 17 Driver Impact Weighting Chart |
  61. FIGURE 18 Restraint Impact Weighting Chart

Segmentation Quick Reference

DimensionSub-SegmentsDominant SegmentFastest Growing Segment
Drying TechnologySpray-Dried, Freeze-Dried, Vacuum-Dried, Drum-Dried, Air- and Sun-DriedSpray-DriedFreeze-Dried
Product CategoryFruits and Vegetables, Meat and Seafood, Dairy and Eggs, Nutraceutical and Functional Powders, Herbs, Spices and SeasoningsFruits and VegetablesNutraceutical and Functional Powders
NatureConventional, OrganicConventionalOrganic
End Use ApplicationIndustrial Packaged Food, Foodservice, RetailIndustrial Packaged FoodRetail
GeographyNorth America, Europe, Asia-Pacific, South America, Middle East & AfricaAsia-PacificAsia-Pacific


Market Segmentation Overview

By Drying Technology

Sub-SegmentKey Trend
Spray-DriedHeat-recovery retrofits lower energy cost per tonne on existing installed base.
Freeze-DriedContinuous tray-transfer systems compress cycle times and widen addressable applications.
Vacuum-DriedPreferred route for heat-sensitive fruit pieces and botanical actives
Drum-DriedSteady demand from starch, cereal and infant nutrition formulators
Air- and Sun-DriedCost-led processing in spice and herb origins, increasingly hybridised with mechanical assist.


Technology choice is fundamentally an economics decision disguised as a quality decision. Processors are converging on portfolios rather than single methods — spray-drying for volume, freeze-drying for premium, vacuum for the middle — because a single-technology asset base cannot serve both industrial and retail buyers profitably.

By Product Category

Sub-SegmentKey Trend
Fruits and VegetablesDual-channel demand from retail snacking and industrial ingredient formulation
Meat and SeafoodGrowth increasingly driven by premium pet nutrition alongside human shelf-stable protein.
Dairy and EggsBakery, confectionery and infant formula demand keeps volumes stable.
Nutraceutical and Functional PowdersSupplement industry expansion pulls pharmaceutical-grade drying capacity.
Herbs, Spices and SeasoningsOrigin-based processing consolidates as export certification requirements tighten.


Category economics differ sharply. Fruits and vegetables deliver volume and channel flexibility; nutraceutical powders deliver margin and growth. Processors with assets qualified for both are positioned best, since the capital investment overlaps considerably even where the customer base does not.

By Nature

Sub-SegmentKey Trend
ConventionalRemains the volume default for cost-sensitive industrial formulation
OrganicCertified acreage expansion in Europe supports sustained double-digit growth.


The conventional-to-organic transition is supply-constrained rather than demand-constrained. Certified raw material, not processing capacity, is the binding limitation, which is why acquisitions in this space increasingly target grower relationships rather than plants.

By End Use Application

Sub-SegmentKey Trend
Industrial Packaged FoodReformulation toward powder inputs sustains baseline volume demand
FoodserviceKitchen labour scarcity drives adoption of pre-dried preparation inputs.
RetailConsumer packs deliver three to four times the per-kilogram realisation of bulk supply.


End use determines margin structure more than any other dimension. Industrial supply is high-volume and price-transparent; retail is lower-volume and brand-mediated. The strategic question facing most processors this decade is how much capacity to reallocate from the first toward the second.




Download PDF ×

We do not share your information with anyone. However, we may send you emails based on your report interest from time to time. You may contact us at any time to opt-out.