Data Exfiltration Market

ID: MRFR/ICT/26418-HCR
100 Pages
Ankit Gupta
Last Updated: June 23, 2026
Data Exfiltration Market Size, Share and Research Report By Organization Size (Small- and Medium-sized Enterprises (SMEs), Large Enterprise), By Component (Solutions (Encryption, Antivirus, Firewall, Intrusion Detection System, Data Loss Prevention, and Other Solutions), Services (Penetration Testing Services, Support and Maintenance, Integration Services)), By End-User Vertical (Banking, Financial Services, and Insurance (BFSI), IT and Telecom, Healthcare and Life Sciences, Government and Defense, Retail and E-commerce, Manufacturing, Other End-User Verticals) and By Regional (North America, Europe, South America, Asia Pacific, Middle East and Africa) - Industry Forecast to 2035.
Download PDF ×

We do not share your information with anyone. However, we may send you emails based on your report interest from time to time. You may contact us at any time to opt-out.

Data Exfiltration Market

Market Size

Forecast Period2025-2035
CAGR (2025-2035)10.12%
2025 Market SizeUSD 102.87 Billion
2035 Market SizeUSD 257.34 Billion

Key Players

Palo Alto Networks
Fortinet
McAfee LLC
NortonLifeLock
Google LLC
Cisco Systems Inc.
Opportunities
  • AI-Native Data Loss Prevention Platforms
  • SME-Focused Cloud-Delivered Security
  • Emerging Market Digital Transformation
  1. 1 Market Summary; Key Takeaways |
    1. 1.1 Market Summary |
    2. 1.2 Key Report Takeaways – By Component |
    3. 1.3 Key Report Takeaways – By Organization Size |
    4. 1.4 Key Report Takeaways – By Geography
  2. 2 Market Overview |
    1. 2.1 Study Assumptions; Market Definition |
    2. 2.2 Scope of the Study |
    3. 2.3 Research Methodology
  3. 3 Market Size; Forecast (2021–2035) |
    1. 3.1 Historical Market Size (2021–2025) |
    2. 3.2 Current; Forecast Market Size (2026–2035) |
    3. 3.3 Market Size by Revenue (USD Billion) |
    4. 3.4 Year-over-Year Growth Analysis
  4. 4 Market Dynamics – Driver Impact Analysis |
    1. 4.1 Exponential Enterprise Data Growth; Data Protection Demand |
    2. 4.2 Stringent Regulatory Compliance Requirements (GDPR, CCPA, NIS2) |
    3. 4.3 Escalating Ransomware; Insider Threat Landscape |
    4. 4.4 Cloud Migration; Hybrid IT Complexity |
    5. 4.5 AI-Powered Detection; Automated Response
  5. 5 Market Dynamics – Restraints Impact Analysis |
    1. 5.1 Hybrid Cloud Compatibility Challenges |
    2. 5.2 Cybersecurity Talent Shortage |
    3. 5.3 High Implementation; Integration Costs |
    4. 5.4 Alert Fatigue; False Positive Overload |
    5. 5.5 Privacy-Compliance Conflicts in Monitoring
  6. 6 Market Opportunities |
    1. 6.1 AI-Native Data Loss Prevention Platforms |
    2. 6.2 SME-Focused Cloud-Delivered Security |
    3. 6.3 Emerging Market Digital Transformation |
    4. 6.4 Zero-Trust Ecosystem Integration |
    5. 6.5 Cyber Insurance Alignment
  7. 7 Regional Market Share; Country-Level Analysis |
    1. 7.1 North America | |
      1. 7.1.1 United States | |
      2. 7.1.2 Canada | |
      3. 7.1.3 Mexico |
    2. 7.2 Europe | |
      1. 7.2.1 Germany | |
      2. 7.2.2 United Kingdom | |
      3. 7.2.3 France | |
      4. 7.2.4 Italy | |
      5. 7.2.5 Spain | |
      6. 7.2.6 Nordic Countries | |
      7. 7.2.7 Russia | |
      8. 7.2.8 Rest of Europe |
    3. 7.3 Asia-Pacific | |
      1. 7.3.1 China | |
      2. 7.3.2 India | |
      3. 7.3.3 Japan | |
      4. 7.3.4 South Korea | |
      5. 7.3.5 ASEAN | |
      6. 7.3.6 Rest of Asia-Pacific |
    4. 7.4 South America | |
      1. 7.4.1 Brazil | |
      2. 7.4.2 Argentina | |
      3. 7.4.3 Rest of South America |
    5. 7.5 Middle East; Africa | |
      1. 7.5.1 Saudi Arabia | |
      2. 7.5.2 United Arab Emirates | |
      3. 7.5.3 South Africa | |
      4. 7.5.4 Egypt | |
      5. 7.5.5 Rest of Middle East; Africa
  8. 8 Future Outlook; Strategic Recommendations (2026–2035) |
    1. 8.1 AI-Driven Autonomous Security Operations |
    2. 8.2 Regulatory Convergence; Cross-Border Enforcement |
    3. 8.3 Quantum-Computing Preparedness |
    4. 8.4 Data Sovereignty; Localization Requirements
  9. 9 Segmentation Analysis |
    1. 9.1 By Organization Size | |
      1. 9.1.1 Small- and Medium-sized Enterprises (SMEs) | |
      2. 9.1.2 Large Enterprise |
    2. 9.2 By Component | |
      1. 9.2.1 Solutions (Encryption, Antivirus, Firewall, Intrusion Detection System, Data Loss Prevention, and Other Solutions) | |
      2. 9.2.2 Services (Penetration Testing Services, Support and Maintenance, Integration Services) |
    3. 9.3 By End-User Vertical | |
      1. 9.3.1 Banking, Financial Services, and Insurance (BFSI) | |
      2. 9.3.2 IT and Telecom | |
      3. 9.3.3 Healthcare and Life Sciences | |
      4. 9.3.4 Government and Defense | |
      5. 9.3.5 Retail and E-commerce | |
      6. 9.3.6 Manufacturing | |
      7. 9.3.7 Other End-User Verticals
  10. 10 Competitive Landscape |
    1. 10.1 Market Share Analysis (2026) |
    2. 10.2 Competitive Benchmarking Matrix |
    3. 10.3 Company Profiles | |
      1. 10.3.1 Palo Alto Networks | |
      2. 10.3.2 Fortinet | |
      3. 10.3.3 McAfee LLC | |
      4. 10.3.4 NortonLifeLock | |
      5. 10.3.5 Google LLC | |
      6. 10.3.6 Cisco Systems Inc. | |
      7. 10.3.7 Check Point Software Technologies | |
      8. 10.3.8 Zscaler | |
      9. 10.3.9 Sophos Group plc | |
      10. 10.3.10 Barracuda Networks
  11. 11 Recent Developments; News
  12. 12 Report Scope; Methodology |
    1. 12.1 Study Period; Base Year |
    2. 12.2 Data Sources; Citations |
    3. 12.3 Abbreviations
  13. 13 Detailed Sources; Citations
  14. 14 Frequently Asked Questions (FAQs)
  15. 15 LIST OF TABLES |
  16. TABLE 1 Global Data Exfiltration Market Size; Forecast, by Revenue (USD Billion), 2021–2035 |
  17. TABLE 2 Global Data Exfiltration Market – Year-over-Year Growth Analysis, 2021–2035 |
  18. TABLE 3 Global Data Exfiltration Market Size, by Organization Size, 2021–2035 (USD Billion) |
  19. TABLE 4 Global Data Exfiltration Market Size, by Component, 2021–2035 (USD Billion) |
  20. TABLE 5 Global Data Exfiltration Market Size, by End-User Vertical, 2021–2035 (USD Billion) |
  21. TABLE 6 Global Data Exfiltration Market Size, by Region, 2021–2035 (USD Billion) |
  22. TABLE 7 North America Data Exfiltration Market Size, by Country, 2021–2035 (USD Billion) |
  23. TABLE 8 Europe Data Exfiltration Market Size, by Country, 2021–2035 (USD Billion) |
  24. TABLE 9 Asia-Pacific Data Exfiltration Market Size, by Country, 2021–2035 (USD Billion) |
  25. TABLE 10 South America Data Exfiltration Market Size, by Country, 2021–2035 (USD Billion) |
  26. TABLE 11 Middle East & Africa Data Exfiltration Market Size, by Country, 2021–2035 (USD Billion) |
  27. TABLE 12 Driver Impact Analysis – Global Data Exfiltration Market |
  28. TABLE 13 Restraints Impact Analysis – Global Data Exfiltration Market |
  29. TABLE 14 Competitive Benchmarking Matrix – Global Data Exfiltration Market, 2026 |
  30. TABLE 15 Company Profiles – Key Players, Global Data Exfiltration Market |
  31. TABLE 16 Recent Developments; Strategic Announcements, 2023–2025 |
  32. TABLE 17 Report Scope; Methodology Summary |
  33. TABLE 18 Detailed Sources & Citations |
  34. TABLE 19 North America Data Exfiltration Market Size, by Organization Size, 2021–2035 (USD Billion) |
  35. TABLE 20 North America Data Exfiltration Market Size, by Component, 2021–2035 (USD Billion) |
  36. TABLE 21 North America Data Exfiltration Market Size, by End-User Vertical, 2021–2035 (USD Billion) |
  37. TABLE 22 Europe Data Exfiltration Market Size, by Organization Size, 2021–2035 (USD Billion) |
  38. TABLE 23 Europe Data Exfiltration Market Size, by Component, 2021–2035 (USD Billion) |
  39. TABLE 24 Europe Data Exfiltration Market Size, by End-User Vertical, 2021–2035 (USD Billion) |
  40. TABLE 25 Asia-Pacific Data Exfiltration Market Size, by Organization Size, 2021–2035 (USD Billion) |
  41. TABLE 26 Asia-Pacific Data Exfiltration Market Size, by Component, 2021–2035 (USD Billion) |
  42. TABLE 27 Asia-Pacific Data Exfiltration Market Size, by End-User Vertical, 2021–2035 (USD Billion) |
  43. TABLE 28 South America Data Exfiltration Market Size, by Organization Size, 2021–2035 (USD Billion) |
  44. TABLE 29 South America Data Exfiltration Market Size, by Component, 2021–2035 (USD Billion) |
  45. TABLE 30 South America Data Exfiltration Market Size, by End-User Vertical, 2021–2035 (USD Billion) |
  46. TABLE 31 Middle East & Africa Data Exfiltration Market Size, by Organization Size, 2021–2035 (USD Billion) |
  47. TABLE 32 Middle East & Africa Data Exfiltration Market Size, by Component, 2021–2035 (USD Billion) |
  48. TABLE 33 Middle East & Africa Data Exfiltration Market Size, by End-User Vertical, 2021–2035 (USD Billion) |
  49. TABLE 34 United States Data Exfiltration Market Size, by Organization Size, 2021–2035 (USD Billion) |
  50. TABLE 35 United States Data Exfiltration Market Size, by Component, 2021–2035 (USD Billion) |
  51. TABLE 36 United States Data Exfiltration Market Size, by End-User Vertical, 2021–2035 (USD Billion) |
  52. TABLE 37 Canada Data Exfiltration Market Size, by Organization Size, 2021–2035 (USD Billion) |
  53. TABLE 38 Canada Data Exfiltration Market Size, by Component, 2021–2035 (USD Billion) |
  54. TABLE 39 Canada Data Exfiltration Market Size, by End-User Vertical, 2021–2035 (USD Billion) |
  55. TABLE 40 Mexico Data Exfiltration Market Size, by Organization Size, 2021–2035 (USD Billion) |
  56. TABLE 41 Mexico Data Exfiltration Market Size, by Component, 2021–2035 (USD Billion) |
  57. TABLE 42 Mexico Data Exfiltration Market Size, by End-User Vertical, 2021–2035 (USD Billion) |
  58. TABLE 43 Germany Data Exfiltration Market Size, by Organization Size, 2021–2035 (USD Billion) |
  59. TABLE 44 Germany Data Exfiltration Market Size, by Component, 2021–2035 (USD Billion) |
  60. TABLE 45 Germany Data Exfiltration Market Size, by End-User Vertical, 2021–2035 (USD Billion) |
  61. TABLE 46 United Kingdom Data Exfiltration Market Size, by Organization Size, 2021–2035 (USD Billion) |
  62. TABLE 47 United Kingdom Data Exfiltration Market Size, by Component, 2021–2035 (USD Billion) |
  63. TABLE 48 United Kingdom Data Exfiltration Market Size, by End-User Vertical, 2021–2035 (USD Billion) |
  64. TABLE 49 France Data Exfiltration Market Size, by Organization Size, 2021–2035 (USD Billion) |
  65. TABLE 50 France Data Exfiltration Market Size, by Component, 2021–2035 (USD Billion) |
  66. TABLE 51 France Data Exfiltration Market Size, by End-User Vertical, 2021–2035 (USD Billion) |
  67. TABLE 52 Italy Data Exfiltration Market Size, by Organization Size, 2021–2035 (USD Billion) |
  68. TABLE 53 Italy Data Exfiltration Market Size, by Component, 2021–2035 (USD Billion) |
  69. TABLE 54 Italy Data Exfiltration Market Size, by End-User Vertical, 2021–2035 (USD Billion) |
  70. TABLE 55 Spain Data Exfiltration Market Size, by Organization Size, 2021–2035 (USD Billion) |
  71. TABLE 56 Spain Data Exfiltration Market Size, by Component, 2021–2035 (USD Billion) |
  72. TABLE 57 Spain Data Exfiltration Market Size, by End-User Vertical, 2021–2035 (USD Billion) |
  73. TABLE 58 Nordic Countries Data Exfiltration Market Size, by Organization Size, 2021–2035 (USD Billion) |
  74. TABLE 59 Nordic Countries Data Exfiltration Market Size, by Component, 2021–2035 (USD Billion) |
  75. TABLE 60 Nordic Countries Data Exfiltration Market Size, by End-User Vertical, 2021–2035 (USD Billion) |
  76. TABLE 61 Russia Data Exfiltration Market Size, by Organization Size, 2021–2035 (USD Billion) |
  77. TABLE 62 Russia Data Exfiltration Market Size, by Component, 2021–2035 (USD Billion) |
  78. TABLE 63 Russia Data Exfiltration Market Size, by End-User Vertical, 2021–2035 (USD Billion) |
  79. TABLE 64 China Data Exfiltration Market Size, by Organization Size, 2021–2035 (USD Billion) |
  80. TABLE 65 China Data Exfiltration Market Size, by Component, 2021–2035 (USD Billion) |
  81. TABLE 66 China Data Exfiltration Market Size, by End-User Vertical, 2021–2035 (USD Billion) |
  82. TABLE 67 India Data Exfiltration Market Size, by Organization Size, 2021–2035 (USD Billion) |
  83. TABLE 68 India Data Exfiltration Market Size, by Component, 2021–2035 (USD Billion) |
  84. TABLE 69 India Data Exfiltration Market Size, by End-User Vertical, 2021–2035 (USD Billion) |
  85. TABLE 70 Japan Data Exfiltration Market Size, by Organization Size, 2021–2035 (USD Billion) |
  86. TABLE 71 Japan Data Exfiltration Market Size, by Component, 2021–2035 (USD Billion) |
  87. TABLE 72 Japan Data Exfiltration Market Size, by End-User Vertical, 2021–2035 (USD Billion) |
  88. TABLE 73 South Korea Data Exfiltration Market Size, by Organization Size, 2021–2035 (USD Billion) |
  89. TABLE 74 South Korea Data Exfiltration Market Size, by Component, 2021–2035 (USD Billion) |
  90. TABLE 75 South Korea Data Exfiltration Market Size, by End-User Vertical, 2021–2035 (USD Billion) |
  91. TABLE 76 ASEAN Data Exfiltration Market Size, by Organization Size, 2021–2035 (USD Billion) |
  92. TABLE 77 ASEAN Data Exfiltration Market Size, by Component, 2021–2035 (USD Billion) |
  93. TABLE 78 ASEAN Data Exfiltration Market Size, by End-User Vertical, 2021–2035 (USD Billion) |
  94. TABLE 79 Brazil Data Exfiltration Market Size, by Organization Size, 2021–2035 (USD Billion) |
  95. TABLE 80 Brazil Data Exfiltration Market Size, by Component, 2021–2035 (USD Billion) |
  96. TABLE 81 Brazil Data Exfiltration Market Size, by End-User Vertical, 2021–2035 (USD Billion) |
  97. TABLE 82 Argentina Data Exfiltration Market Size, by Organization Size, 2021–2035 (USD Billion) |
  98. TABLE 83 Argentina Data Exfiltration Market Size, by Component, 2021–2035 (USD Billion) |
  99. TABLE 84 Argentina Data Exfiltration Market Size, by End-User Vertical, 2021–2035 (USD Billion) |
  100. TABLE 85 Saudi Arabia Data Exfiltration Market Size, by Organization Size, 2021–2035 (USD Billion) |
  101. TABLE 86 Saudi Arabia Data Exfiltration Market Size, by Component, 2021–2035 (USD Billion) |
  102. TABLE 87 Saudi Arabia Data Exfiltration Market Size, by End-User Vertical, 2021–2035 (USD Billion) |
  103. TABLE 88 United Arab Emirates Data Exfiltration Market Size, by Organization Size, 2021–2035 (USD Billion) |
  104. TABLE 89 United Arab Emirates Data Exfiltration Market Size, by Component, 2021–2035 (USD Billion) |
  105. TABLE 90 United Arab Emirates Data Exfiltration Market Size, by End-User Vertical, 2021–2035 (USD Billion) |
  106. TABLE 91 South Africa Data Exfiltration Market Size, by Organization Size, 2021–2035 (USD Billion) |
  107. TABLE 92 South Africa Data Exfiltration Market Size, by Component, 2021–2035 (USD Billion) |
  108. TABLE 93 South Africa Data Exfiltration Market Size, by End-User Vertical, 2021–2035 (USD Billion) |
  109. TABLE 94 Egypt Data Exfiltration Market Size, by Organization Size, 2021–2035 (USD Billion) |
  110. TABLE 95 Egypt Data Exfiltration Market Size, by Component, 2021–2035 (USD Billion) |
  111. TABLE 96 Egypt Data Exfiltration Market Size, by End-User Vertical, 2021–2035 (USD Billion)
  112. 16 LIST OF FIGURES |
  113. FIGURE 1 Global Data Exfiltration Market – Market Dynamics Framework |
  114. FIGURE 2 Global Data Exfiltration Market – Porter's Five Forces Analysis |
  115. FIGURE 3 Global Data Exfiltration Market – Industry Value Chain Analysis |
  116. FIGURE 4 Global Data Exfiltration Market Size (USD Billion), 2021–2035 |
  117. FIGURE 5 Global Data Exfiltration Market – Year-over-Year Growth Rate (%), 2021–2035 |
  118. FIGURE 6 Global Data Exfiltration Market – Revenue Share by Organization Size, 2026 |
  119. FIGURE 7 Global Data Exfiltration Market – Revenue Share by Component, 2026 |
  120. FIGURE 8 Global Data Exfiltration Market – Revenue Share by End-User Vertical, 2026 |
  121. FIGURE 9 Global Data Exfiltration Market – Revenue Share by Region, 2026 |
  122. FIGURE 10 North America Data Exfiltration Market – Revenue Share by Country, 2026 |
  123. FIGURE 11 Europe Data Exfiltration Market – Revenue Share by Country, 2026 |
  124. FIGURE 12 Asia-Pacific Data Exfiltration Market – Revenue Share by Country, 2026 |
  125. FIGURE 13 South America Data Exfiltration Market – Revenue Share by Country, 2026 |
  126. FIGURE 14 Middle East & Africa Data Exfiltration Market – Revenue Share by Country, 2026 |
  127. FIGURE 15 Global Data Exfiltration Market – Competitive Market Share Analysis, 2026 |
  128. FIGURE 16 Global Data Exfiltration Market – Driver Impact Analysis Heat Map |
  129. FIGURE 17 Global Data Exfiltration Market – Restraints Impact Analysis Heat Map |
  130. FIGURE 18 Global Data Exfiltration Market – Forecast Outlook (2026–2035) |
  131. FIGURE 19 North America Data Exfiltration Market – Revenue Share by Organization Size, 2026 |
  132. FIGURE 20 North America Data Exfiltration Market – Revenue Share by Component, 2026 |
  133. FIGURE 21 North America Data Exfiltration Market – Revenue Share by End-User Vertical, 2026 |
  134. FIGURE 22 Europe Data Exfiltration Market – Revenue Share by Organization Size, 2026 |
  135. FIGURE 23 Europe Data Exfiltration Market – Revenue Share by Component, 2026 |
  136. FIGURE 24 Europe Data Exfiltration Market – Revenue Share by End-User Vertical, 2026 |
  137. FIGURE 25 Asia-Pacific Data Exfiltration Market – Revenue Share by Organization Size, 2026 |
  138. FIGURE 26 Asia-Pacific Data Exfiltration Market – Revenue Share by Component, 2026 |
  139. FIGURE 27 Asia-Pacific Data Exfiltration Market – Revenue Share by End-User Vertical, 2026 |
  140. FIGURE 28 South America Data Exfiltration Market – Revenue Share by Organization Size, 2026 |
  141. FIGURE 29 South America Data Exfiltration Market – Revenue Share by Component, 2026 |
  142. FIGURE 30 South America Data Exfiltration Market – Revenue Share by End-User Vertical, 2026 |
  143. FIGURE 31 Middle East & Africa Data Exfiltration Market – Revenue Share by Organization Size, 2026 |
  144. FIGURE 32 Middle East & Africa Data Exfiltration Market – Revenue Share by Component, 2026 |
  145. FIGURE 33 Middle East & Africa Data Exfiltration Market – Revenue Share by End-User Vertical, 2026 |
  146. FIGURE 34 United States Data Exfiltration Market – Revenue Share by Organization Size, 2026 |
  147. FIGURE 35 United States Data Exfiltration Market – Revenue Share by Component, 2026 |
  148. FIGURE 36 United States Data Exfiltration Market – Revenue Share by End-User Vertical, 2026 |
  149. FIGURE 37 Canada Data Exfiltration Market – Revenue Share by Organization Size, 2026 |
  150. FIGURE 38 Canada Data Exfiltration Market – Revenue Share by Component, 2026 |
  151. FIGURE 39 Canada Data Exfiltration Market – Revenue Share by End-User Vertical, 2026 |
  152. FIGURE 40 Mexico Data Exfiltration Market – Revenue Share by Organization Size, 2026 |
  153. FIGURE 41 Mexico Data Exfiltration Market – Revenue Share by Component, 2026 |
  154. FIGURE 42 Mexico Data Exfiltration Market – Revenue Share by End-User Vertical, 2026 |
  155. FIGURE 43 Germany Data Exfiltration Market – Revenue Share by Organization Size, 2026 |
  156. FIGURE 44 Germany Data Exfiltration Market – Revenue Share by Component, 2026 |
  157. FIGURE 45 Germany Data Exfiltration Market – Revenue Share by End-User Vertical, 2026 |
  158. FIGURE 46 United Kingdom Data Exfiltration Market – Revenue Share by Organization Size, 2026 |
  159. FIGURE 47 United Kingdom Data Exfiltration Market – Revenue Share by Component, 2026 |
  160. FIGURE 48 United Kingdom Data Exfiltration Market – Revenue Share by End-User Vertical, 2026 |
  161. FIGURE 49 France Data Exfiltration Market – Revenue Share by Organization Size, 2026 |
  162. FIGURE 50 France Data Exfiltration Market – Revenue Share by Component, 2026 |
  163. FIGURE 51 France Data Exfiltration Market – Revenue Share by End-User Vertical, 2026 |
  164. FIGURE 52 Italy Data Exfiltration Market – Revenue Share by Organization Size, 2026 |
  165. FIGURE 53 Italy Data Exfiltration Market – Revenue Share by Component, 2026 |
  166. FIGURE 54 Italy Data Exfiltration Market – Revenue Share by End-User Vertical, 2026 |
  167. FIGURE 55 Spain Data Exfiltration Market – Revenue Share by Organization Size, 2026 |
  168. FIGURE 56 Spain Data Exfiltration Market – Revenue Share by Component, 2026 |
  169. FIGURE 57 Spain Data Exfiltration Market – Revenue Share by End-User Vertical, 2026 |
  170. FIGURE 58 Nordic Countries Data Exfiltration Market – Revenue Share by Organization Size, 2026 |
  171. FIGURE 59 Nordic Countries Data Exfiltration Market – Revenue Share by Component, 2026 |
  172. FIGURE 60 Nordic Countries Data Exfiltration Market – Revenue Share by End-User Vertical, 2026 |
  173. FIGURE 61 Russia Data Exfiltration Market – Revenue Share by Organization Size, 2026 |
  174. FIGURE 62 Russia Data Exfiltration Market – Revenue Share by Component, 2026 |
  175. FIGURE 63 Russia Data Exfiltration Market – Revenue Share by End-User Vertical, 2026 |
  176. FIGURE 64 China Data Exfiltration Market – Revenue Share by Organization Size, 2026 |
  177. FIGURE 65 China Data Exfiltration Market – Revenue Share by Component, 2026 |
  178. FIGURE 66 China Data Exfiltration Market – Revenue Share by End-User Vertical, 2026 |
  179. FIGURE 67 India Data Exfiltration Market – Revenue Share by Organization Size, 2026 |
  180. FIGURE 68 India Data Exfiltration Market – Revenue Share by Component, 2026 |
  181. FIGURE 69 India Data Exfiltration Market – Revenue Share by End-User Vertical, 2026 |
  182. FIGURE 70 Japan Data Exfiltration Market – Revenue Share by Organization Size, 2026 |
  183. FIGURE 71 Japan Data Exfiltration Market – Revenue Share by Component, 2026 |
  184. FIGURE 72 Japan Data Exfiltration Market – Revenue Share by End-User Vertical, 2026 |
  185. FIGURE 73 South Korea Data Exfiltration Market – Revenue Share by Organization Size, 2026 |
  186. FIGURE 74 South Korea Data Exfiltration Market – Revenue Share by Component, 2026 |
  187. FIGURE 75 South Korea Data Exfiltration Market – Revenue Share by End-User Vertical, 2026 |
  188. FIGURE 76 ASEAN Data Exfiltration Market – Revenue Share by Organization Size, 2026 |
  189. FIGURE 77 ASEAN Data Exfiltration Market – Revenue Share by Component, 2026 |
  190. FIGURE 78 ASEAN Data Exfiltration Market – Revenue Share by End-User Vertical, 2026 |
  191. FIGURE 79 Brazil Data Exfiltration Market – Revenue Share by Organization Size, 2026 |
  192. FIGURE 80 Brazil Data Exfiltration Market – Revenue Share by Component, 2026 |
  193. FIGURE 81 Brazil Data Exfiltration Market – Revenue Share by End-User Vertical, 2026 |
  194. FIGURE 82 Argentina Data Exfiltration Market – Revenue Share by Organization Size, 2026 |
  195. FIGURE 83 Argentina Data Exfiltration Market – Revenue Share by Component, 2026 |
  196. FIGURE 84 Argentina Data Exfiltration Market – Revenue Share by End-User Vertical, 2026 |
  197. FIGURE 85 Saudi Arabia Data Exfiltration Market – Revenue Share by Organization Size, 2026 |
  198. FIGURE 86 Saudi Arabia Data Exfiltration Market – Revenue Share by Component, 2026 |
  199. FIGURE 87 Saudi Arabia Data Exfiltration Market – Revenue Share by End-User Vertical, 2026 |
  200. FIGURE 88 United Arab Emirates Data Exfiltration Market – Revenue Share by Organization Size, 2026 |
  201. FIGURE 89 United Arab Emirates Data Exfiltration Market – Revenue Share by Component, 2026 |
  202. FIGURE 90 United Arab Emirates Data Exfiltration Market – Revenue Share by End-User Vertical, 2026 |
  203. FIGURE 91 South Africa Data Exfiltration Market – Revenue Share by Organization Size, 2026 |
  204. FIGURE 92 South Africa Data Exfiltration Market – Revenue Share by Component, 2026 |
  205. FIGURE 93 South Africa Data Exfiltration Market – Revenue Share by End-User Vertical, 2026 |
  206. FIGURE 94 Egypt Data Exfiltration Market – Revenue Share by Organization Size, 2026 |
  207. FIGURE 95 Egypt Data Exfiltration Market – Revenue Share by Component, 2026 |
  208. FIGURE 96 Egypt Data Exfiltration Market – Revenue Share by End-User Vertical, 2026

MARKET SEGMENTATION OVERVIEW

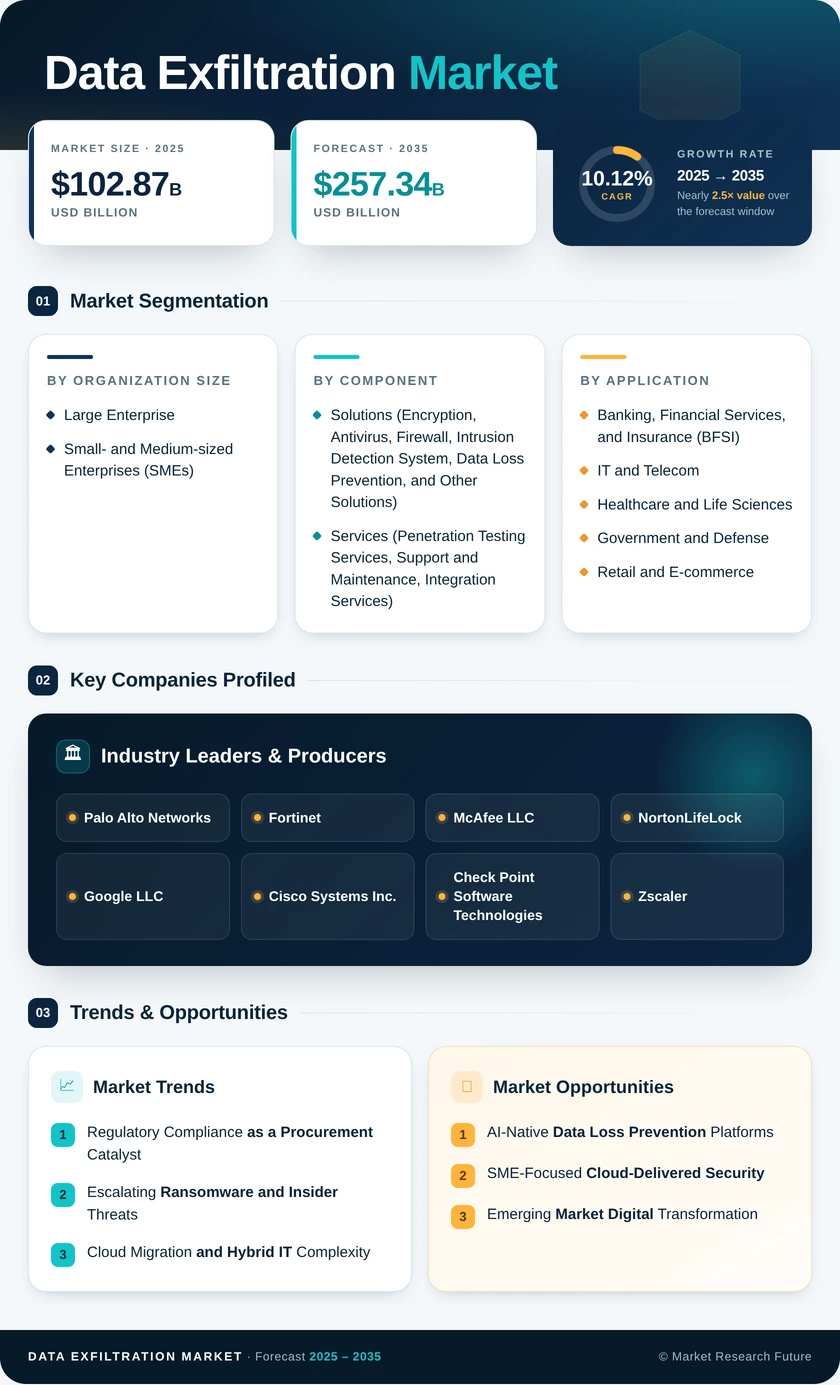
The global data exfiltration market is analyzed across three primary segmentation dimensions. Each dimension reflects distinct demand drivers, regulatory treatment, and end-user requirements, enabling granular revenue forecasting and strategic positioning for market participants.

By Organization Size

Sub-SegmentKey Trend
Large EnterpriseDominant share driven by expansive multi-cloud environments, dedicated SOC teams, and stringent regulatory mandates requiring advanced DLP solutions and insider threat monitoring
Small- and Medium-sized Enterprises (SMEs)Fastest-growing segment as cloud-delivered security bundles lower cost barriers and subscription-based pricing models accelerate adoption of endpoint-level data exfiltration prevention


  • Large enterprises command ~66% of the data exfiltration market in 2026, reflecting their complex IT environments and multi-billion-dollar cybersecurity budgets. Small- and Medium-sized Enterprises (SMEs) represent the fastest-growing sub-segment at 12.5% CAGR, driven by affordable cloud-delivered DLP solutions to prevent data exfiltration and managed security service adoption that eliminates the need for in-house specialist teams.

By Component

Sub-SegmentKey Trend
Solutions (Encryption, Antivirus, Firewall, Intrusion Detection System, Data Loss Prevention, and Other Solutions)Dominant revenue contributor; enterprises prioritize integrated platforms combining encryption, network traffic analysis for data theft detection, and CASB for cloud data exfiltration control
Services (Penetration Testing Services, Support and Maintenance, Integration Services)Fastest-growing component as cybersecurity talent shortages push organizations toward managed detection, consulting, and penetration testing outsourcing


  • Solutions account for USD 63.78 billion in 2025, with data loss prevention and encryption forming the largest revenue sub-components within this segment. Enterprises increasingly demand unified platforms that combine endpoint-level data exfiltration prevention with network-layer detection and cloud access security brokering. Services are expanding at an 11.8% CAGR as organizations outsource penetration testing, integration, and consulting engagements to address the global shortfall of 3.4 million cybersecurity professionals.

By End-User Vertical

Sub-SegmentKey Trend
Banking, Financial Services, and Insurance (BFSI)Largest vertical share; driven by regulatory compliance (OCC, PRA, PCI-DSS), high per-record breach costs, and privileged access risk requiring insider threat monitoring for data leakage
IT and TelecomRapid growth fueled by cloud infrastructure protection needs, massive customer data volumes, and network traffic analysis for data theft detection across service provider environments
Healthcare and Life SciencesHigh sensitivity of patient health information (PHI) and electronic health records (EHRs); HIPAA compliance and rising ransomware targeting accelerate deployment of CASB for cloud data exfiltration control
Government and DefenseNational security mandates, classified data protection requirements, and zero-trust architecture adoption drive sustained procurement of DLP solutions to prevent data exfiltration
Retail and E-commercePCI-DSS compliance obligations, customer PII protection needs, and growing e-commerce transaction volumes expand demand for endpoint-level data exfiltration prevention
ManufacturingIntellectual property theft prevention and OT/IT convergence security; monitoring industrial protocols for unauthorized data transfers is an emerging priority
Other End-User VerticalsEducation, energy, transportation, and media sectors with growing but nascent cybersecurity postures, driving incremental market expansion


  • BFSI commands ~28% of the data exfiltration market in 2026, reflecting the sector's exposure to financial fraud, regulatory scrutiny, and the highest per-record breach costs averaging USD 5.9 million across financial institutions. IT and Telecom follows as the second-largest vertical with an 11.4% CAGR, driven by the sector's role as both a primary target and a critical infrastructure provider requiring robust network traffic analysis for data theft detection. Healthcare and Life Sciences represent USD 13.37 billion in 2025 revenue, with HIPAA breach notification rules and escalating ransomware attacks driving rapid deployment of insider threat monitoring for data leakage and encrypted data transfer controls. Retail and e-commerce are the fastest-growing verticals at 12.1% CAGR, propelled by PCI-DSS compliance and surging online transaction volumes that expand the attack surface for customer data exfiltration.

SEGMENTATION QUICK REFERENCE

DimensionSub-SegmentsDominant Segment (2026)Fastest Growing
Organization SizeLarge Enterprise · SMEsLarge Enterprise (~66%)SMEs (12.5% CAGR)
ComponentSolutions (Encryption, Antivirus, Firewall, IDS, DLP, Other) · Services (Penetration Testing, Support; Maintenance, Integration, Consulting)Solutions (USD 63.78B in 2025)Services (11.8% CAGR)
End-User VerticalBFSI · IT and Telecom · Healthcare and Life Sciences · Government and Defense · Retail and E-commerce · Manufacturing · Other End-User VerticalsBFSI (~28%)Retail and E-commerce (12.1% CAGR)

Â