×
  • Cat-intel
  • MedIntelliX
  • Resources
  • About Us
  • Hero Background
    English
    Chinese
    French
    Japanese
    Korean
    German
    Spanish

    Data Center Structured Cabling Market Analysis

    ID: MRFR/ICT/4997-CR
    144 Pages
    Shubham Munde
    September 2018

    Data Center Structured Cabling Market Research Report Information ByWire Category (Category 5E,Category 6,Category 6A,Category 7, Others), By Product Type(Copper Wire,Fiber Optic), And By Region (North America, Europe, Asia-Pacific, And Rest Of The World) –Market Forecast Till 2035

    Share:
    Download PDF ×

    We do not share your information with anyone. However, we may send you emails based on your report interest from time to time. You may contact us at any time to opt-out.

    Data Center Structured Cabling Market Infographic
    Purchase Options

    Market Analysis

    Data Center Structured Cabling Market (Global, 2023)

    Introduction

    Data Center Structured Cabling Market is a critical part of the telecommunications and IT network, and it serves as the backbone for the transmission of data within the data centers. Consequently, with the increasing digitalization and cloud computing, the demand for robust and scalable data center structured cabling solutions has increased, which has driven the growth of the market. High-speed data transmission, high-performance networks, and high availability are the key drivers for the structured cabling systems. The data center structured cabling market is characterized by a large number of manufacturers, service providers, and system integrators. Moreover, the growing importance of energy efficiency and the need for a sustainable data center has influenced the design and implementation of cabling solutions. This has prompted the industry players to adopt advanced solutions that not only improve the performance but also reduce the energy consumption. The data center structured cabling market is highly dynamic, and therefore, it is essential for businesses to understand the market dynamics to maintain a competitive edge in an interconnected world.

    PESTLE Analysis

    Political
    In 2023 the political situation in the data center structured cabling market will be strongly influenced by government regulations aimed at increasing security and data protection. For example, the European Union’s General Data Protection Regulation (GDPR) imposes strict requirements on the way data is handled, which will affect the way data centers manage their cabling systems. This will require a substantial investment from companies, which could need to allocate up to €1 million per year to ensure compliance with the new regulations.
    Economic
    The market for structured cabling in data centers is characterized by fluctuating prices for raw materials and labor. The average cost of copper, the primary material used in structured cabling, is projected to be about CAD 4.50 per kilogram in 2023, an increase of about 10% over the previous year as a result of supply disruptions. In addition, the labor market for skilled technicians in the cabling sector is tightening, with a reported shortage of 50,000 qualified workers in the United States, pushing up labor costs by an estimated 15%.
    Social
    Social trends are increasingly in favor of sustainable and energy-saving solutions in data centers. In 2023, a survey shows that 72% of consumers prefer companies that show commitment to the environment. This is why operators of data centers are investing in sustainable cabling solutions. In addition, the rise of remote working has led to a 30% increase in data traffic. The cabling is being expanded to meet the higher data rates and to optimize the overall experience.
    Technological
    The development of technology has a strong influence on the market for structured cabling. In 2023, the share of fiber-optic cabling is expected to increase, with the installation of fiber-optic cables expected to represent 60 % of new cabling projects, driven by the need for higher data transfer rates. Also, the integration of smart technology such as automatic monitoring systems is increasing, and an estimated 40 % of data centers will use such systems to improve efficiency and minimize downtime.
    Legal
    Legal factors affecting the data center structured cabling market are the compliance with the telecommunications regulations. In 2023, the Federal Communications Commission (FCC) in the United States has set a new standard for data centers, which is expected to cost about $ 200,000 per data center to comply with. Failure to meet these legal requirements can result in penalties and greater scrutiny by regulatory authorities.
    Environmental
    The market for structured cabling in data centers is becoming more and more concerned with the environment. In 2023, it is estimated that data centers will account for 2% of the world's CO2 emissions. This is why many operators are looking for greener solutions. Energy-saving cabling can reduce energy consumption by up to 30%. Many companies have also set themselves the goal of reducing their carbon footprint by 50% by 2030.

    Porter's Five Forces

    Threat of New Entrants
    The Data Centers Structured Cabling Market has a medium barrier to entry because of the need for special knowledge and technology. However, the increasing demand for data centers is likely to attract new entrants. Brand loyalty and customer recognition of the established companies may hinder new entrants.
    Bargaining Power of Suppliers
    Suppliers in the market for structured cabling have little power to influence prices, as there are many suppliers of cabling components and materials. The standardized nature of the products further reduces the influence of any one supplier.
    Bargaining Power of Buyers
    High - The buyers in the Data Center Structured Cabling market have significant bargaining power as they can choose from a large number of suppliers and products. The increasing competition among the suppliers has led to a higher sensitivity to price. Moreover, buyers often seek to optimize their investment, which further increases their bargaining power.
    Threat of Substitutes
    There are, of course, other systems which can perform the same functions as the structured cabling system, such as wireless communications, but the reliability and performance of structured cabling systems make them the preferred choice for many data centers. The only threat to structured cabling systems may come from advances in substitute technology.
    Competitive Rivalry
    The competition in the data center structured cabling market is high. There are many competitors vying for market share. Price, quality, and technological innovation are the main factors driving competition. The rapid growth of the data center industry has also intensified competition, as competitors strive to differentiate themselves and capture new business opportunities.

    SWOT Analysis

    Strengths

    • High demand for data centers due to increasing data consumption and cloud services.
    • Technological advancements leading to more efficient and reliable cabling solutions.
    • Strong growth in the IT and telecommunications sectors driving market expansion.

    Weaknesses

    • High initial installation costs for structured cabling systems.
    • Complexity in installation and maintenance requiring skilled labor.
    • Rapid technological changes may lead to obsolescence of existing systems.

    Opportunities

    • Growing adoption of IoT and smart technologies increasing cabling needs.
    • Expansion of 5G networks creating demand for advanced cabling solutions.
    • Potential for growth in emerging markets with increasing digital infrastructure investments.

    Threats

    • Intense competition leading to price wars and reduced profit margins.
    • Economic downturns affecting capital expenditure on data center infrastructure.
    • Cybersecurity threats that may impact the reliability of cabling systems.

    Summary

    The Data Center Structured Cabling Market in 2023 is characterized by strong demand, primarily due to technological developments and the growth of cloud services. However, the market is characterized by high installation costs and the need for skilled labor. Opportunities are offered by new technologies such as IoT and 5G, while competition and economic fluctuations can have an impact on the level of profitability. Strategically, innovation and expansion of the market are the main priorities for the market participants.

    Author
    Shubham Munde
    Research Analyst Level II

    With a technical background in information technology & semiconductors, Shubham has 4.5+ years of experience in market research and analytics with the tasks of data mining, analysis, and project execution. He is the POC for our clients, for their consulting projects running under the ICT/Semiconductor domain. Shubham holds a Bachelor’s in Information and Technology and a Master of Business Administration (MBA). Shubham has executed over 150 research projects for our clients under the brand name Market Research Future in the last 2 years. His core skill is building the research respondent relation for gathering the primary information from industry and market estimation for niche markets. He is having expertise in conducting secondary & primary research, market estimations, market projections, competitive analysis, analysing current market trends and market dynamics, deep-dive analysis on market scenarios, consumer behaviour, technological impact analysis, consulting, analytics, etc. He has worked on fortune 500 companies' syndicate and consulting projects along with several government projects. He has worked on the projects of top tech brands such as IBM, Google, Microsoft, AWS, Meta, Oracle, Cisco Systems, Samsung, Accenture, VMware, Schneider Electric, Dell, HP, Ericsson, and so many others. He has worked on Metaverse, Web 3.0, Zero-Trust security, cyber-security, blockchain, quantum computing, robotics, 5G technology, High-Performance computing, data centers, AI, automation, IT equipment, sensors, semiconductors, consumer electronics and so many tech domain projects.

    Leave a Comment

    FAQs

    How much is the Data Center Structured Cabling market?

    The Data Center Structured Cabling Market size was valued at USD3.25 Billion in 2023.

    What is the growth rate of the Data Center Structured Cabling market?

    The global market is projected to grow at a CAGR of 10.70% during the forecast period, 2024-2032.

    Which Region held the largest Data Center Structured Cablingmarket share?

    North America had the largest share of the global market

    Who are the key players in the Data Center Structured Cabling market?

    The key players in the market areR&M Nexans S.A. Furukawa Electric Co Legrand Belden Inc Schneider Electric CommScope Panduit Corp Corning Inc Siemon.

    Which Wire Categoryled the Data Center Structured Cabling Market?

    The Category 6AData Center Structured Cabling category dominated the market in 2023.

    Which Product Typehad the largest market share in the Data Center Structured Cabling market?

    Fiber Optichad is the largest share of the global market.

    Market Summary

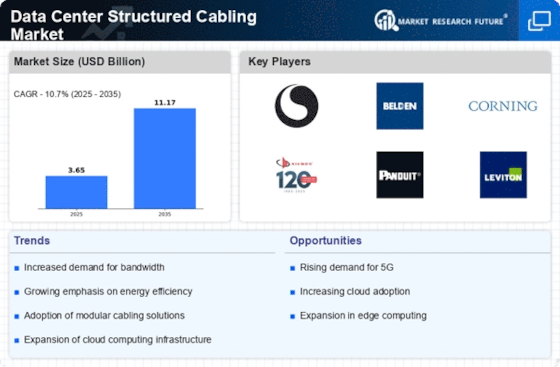
    As per MRFR analysis, the Data Center Structured Cabling Market Size was estimated at 3.65 USD Billion in 2024. The Data Center Structured Cabling industry is projected to grow from 4.041 USD Billion in 2025 to 11.17 USD Billion by 2035, exhibiting a compound annual growth rate (CAGR) of 10.7 during the forecast period 2025 - 2035.

    Key Market Trends & Highlights

    The Data Center Structured Cabling Market is experiencing a transformative shift towards advanced technologies and sustainable practices.

    • The adoption of fiber optic technology is rapidly increasing, driven by the need for higher bandwidth and faster data transmission.
    • Modular cabling solutions are gaining traction, offering flexibility and scalability to meet evolving data center demands.
    • North America remains the largest market, while the Asia-Pacific region is emerging as the fastest-growing area for structured cabling solutions.
    • Rising demand for high-speed connectivity and expansion of data center facilities are key drivers propelling market growth.

    Market Size & Forecast

    2024 Market Size 3.65 (USD Billion)
    2035 Market Size 11.17 (USD Billion)
    CAGR (2025 - 2035) 10.7%
    Largest Regional Market Share in 2024 North America

    Major Players

    <p>CommScope (US), Belden (US), Corning (US), Siemon (US), Panduit (US), Leviton (US), Nexans (FR), Schneider Electric (FR), TE Connectivity (CH)</p>

    Market Trends

    The Data Center Structured Cabling Market is currently experiencing a transformative phase, driven by the increasing demand for high-speed connectivity and efficient data management solutions. As organizations continue to expand their digital infrastructure, the need for robust cabling systems becomes paramount. This market is characterized by rapid technological advancements, with innovations in fiber optic cables and modular designs enhancing performance and scalability. Furthermore, the growing emphasis on energy efficiency and sustainability is influencing the development of cabling solutions that minimize environmental impact while maximizing operational efficiency. In addition, the rise of cloud computing and the Internet of Things (IoT) is reshaping the landscape of data centers, necessitating more sophisticated cabling systems. Companies are increasingly investing in flexible and adaptable cabling architectures that can accommodate future growth and evolving technological requirements. As a result, the Data Center Structured Cabling Market is poised for continued expansion, with stakeholders focusing on integrating advanced technologies and sustainable practices to meet the demands of a dynamic digital environment.

    Adoption of Fiber Optic Technology

    The shift towards fiber optic technology is becoming increasingly prevalent within the Data Center Structured Cabling Market. This trend is driven by the need for higher bandwidth and faster data transmission rates. Fiber optics offer superior performance compared to traditional copper cabling, making them a preferred choice for modern data centers.

    Emphasis on Modular Cabling Solutions

    Modular cabling solutions are gaining traction as organizations seek flexibility and scalability in their data center infrastructure. These systems allow for easier upgrades and modifications, enabling businesses to adapt to changing technological demands without significant overhauls.

    Focus on Sustainability and Energy Efficiency

    Sustainability is emerging as a critical consideration in the Data Center Structured Cabling Market. Companies are increasingly prioritizing energy-efficient cabling solutions that reduce power consumption and environmental impact, aligning with broader corporate sustainability goals.

    Data Center Structured Cabling Market Market Drivers

    Expansion of Data Center Facilities

    The Data Center Structured Cabling Market is significantly influenced by the ongoing expansion of data center facilities. As organizations continue to migrate their operations to digital platforms, the demand for new data centers is escalating. This expansion is not limited to traditional sectors but extends to emerging industries such as artificial intelligence and the Internet of Things. The construction of new data centers necessitates the installation of sophisticated structured cabling systems to ensure optimal performance and scalability. Market analysts suggest that the number of data centers is expected to increase by over 20% in the coming years, further driving the need for advanced cabling solutions that can accommodate growing data traffic.

    Increased Focus on Network Security

    The Data Center Structured Cabling Market is increasingly shaped by the heightened focus on network security. As cyber threats become more sophisticated, organizations are compelled to invest in secure cabling solutions that protect sensitive data. Structured cabling plays a critical role in establishing secure network architectures, enabling better control over data flow and access. This trend is particularly evident in sectors such as finance and healthcare, where data integrity is paramount. Analysts indicate that the demand for secure cabling solutions is likely to rise, as businesses prioritize investments in infrastructure that not only supports operational efficiency but also fortifies security measures.

    Regulatory Compliance and Standards

    The Data Center Structured Cabling Market is also influenced by the need for regulatory compliance and adherence to industry standards. As data protection regulations become more stringent, organizations are required to implement cabling solutions that meet specific compliance criteria. This necessity drives the demand for structured cabling systems that are designed to support regulatory requirements, such as data privacy and security standards. Compliance with these regulations not only mitigates risks but also enhances the credibility of data center operations. Market experts suggest that the increasing complexity of regulatory frameworks will continue to propel investments in compliant cabling solutions, thereby fostering growth in the structured cabling market.

    Rising Demand for High-Speed Connectivity

    The Data Center Structured Cabling Market is experiencing a surge in demand for high-speed connectivity solutions. As businesses increasingly rely on data-intensive applications, the need for faster and more reliable network infrastructure becomes paramount. This trend is underscored by the growing adoption of cloud computing and big data analytics, which necessitate robust cabling systems capable of supporting high bandwidth. According to recent estimates, the market for structured cabling is projected to grow at a compound annual growth rate of approximately 10% over the next few years. This growth is driven by the need for enhanced data transfer rates and reduced latency, compelling data center operators to invest in advanced cabling technologies.

    Technological Advancements in Cabling Solutions

    The Data Center Structured Cabling Market is poised for growth due to rapid technological advancements in cabling solutions. Innovations such as high-density cabling, improved fiber optic technologies, and enhanced connectivity options are transforming the landscape of data center infrastructure. These advancements not only improve performance but also reduce installation time and costs. For instance, the introduction of modular cabling systems allows for easier upgrades and scalability, which is crucial for data centers facing fluctuating demands. As technology continues to evolve, data center operators are likely to seek out the latest cabling solutions to maintain competitive advantages, thereby propelling market growth.

    Market Segment Insights

    Data Center Structured Cabling  MarketSegment Insights

    Data Center Structured Cabling Wire Category Insights

    <p>Based on the wire category, the Data Center Structured Cabling Market segmentationincludes Category 5E category 6, category 6A, category 7,and others. The dominance of the category 6A segment in the Data Center Structured Cabling Market can be attributed to its superior performance and capabilities compared to other wire categories. Category 6A cables provide higher bandwidth, lower crosstalk, and improved transmission performance, making them ideal for high-speed data transfer in <a href="https://www.marketresearchfuture.com/reports/data-centre-market-4721">data center</a> environments.</p>

    <p>The increased demand for high-performance applications, such as cloud computing, virtualization, and big data analytics, necessitates the use of Category 6A cables to ensure reliable and efficient network connectivity.</p>

    Data Center Structured Cabling Product Type Insights

    <p>The Data Center Structured Cabling Market segmentation, based on Product Type, includes copper wire and fiber optic. The Product Type segment dominates the Data Center Structured Cabling Market due to its wide range of offerings that cater to the diverse needs of data centers. This segment includes various components such as copper cables, fiber optic cables, racks, patch panels, connectors, and others that are essential for establishing a robust and efficient cabling infrastructure. The dominance of the Product Type segment can be attributed to the increasing demand for high-speed data transmission, scalability, and flexibility in data centers.</p>

    <p>Copper cables are preferred for shorter distances, while fiber optic cables are chosen for longer distances and higher bandwidth requirements.</p>

    Get more detailed insights about Data Center Structured Cabling Market Research Report - Forecast to 2035

    Regional Insights

    North America : Innovation and Growth Hub

    North America is the largest market for data center structured cabling, holding approximately 45% of the global market share. The region's growth is driven by the increasing demand for high-speed internet, cloud computing, and data storage solutions. Regulatory support for infrastructure development and investments in technology further catalyze market expansion. The U.S. and Canada are the primary contributors, with significant investments in data center facilities and cabling solutions. The competitive landscape in North America is robust, featuring key players such as CommScope, Belden, and Corning. These companies are at the forefront of innovation, providing advanced cabling solutions that meet the growing demands of data centers. The presence of major tech firms and continuous advancements in technology create a dynamic environment for structured cabling solutions, ensuring sustained growth in the region.

    Europe : Emerging Market Dynamics

    Europe is witnessing significant growth in the data center structured cabling market, accounting for approximately 30% of the global share. The region's expansion is fueled by increasing data consumption, the rise of cloud services, and stringent regulations promoting digital infrastructure. Countries like Germany and the UK are leading the market, supported by government initiatives aimed at enhancing connectivity and data security, which are crucial for the digital economy. Leading countries in Europe, such as Germany, the UK, and France, are home to several key players, including Nexans and Schneider Electric. The competitive landscape is characterized by a mix of established companies and innovative startups, all striving to meet the evolving demands of data centers. The focus on sustainability and energy efficiency is also shaping product offerings, making the European market a hub for advanced cabling solutions.

    Asia-Pacific : Rapidly Growing Market

    Asia-Pacific is rapidly emerging as a significant player in the data center structured cabling market, holding around 20% of the global market share. The region's growth is driven by the increasing adoption of cloud computing, big data analytics, and the expansion of data centers in countries like China and India. Government initiatives aimed at enhancing digital infrastructure and connectivity are also key growth drivers, fostering a conducive environment for market expansion. China and India are the leading countries in this region, with substantial investments in data center infrastructure. The competitive landscape features both local and international players, including major companies like TE Connectivity. The demand for high-performance cabling solutions is on the rise, driven by the need for efficient data transmission and storage capabilities, positioning Asia-Pacific as a vital market for structured cabling solutions.

    Middle East and Africa : Emerging Market Potential

    The Middle East and Africa region is gradually emerging in the data center structured cabling market, currently holding about 5% of the global market share. The growth is primarily driven by increasing investments in digital infrastructure and the rising demand for data centers to support the region's expanding economies. Countries like the UAE and South Africa are leading the charge, with government initiatives aimed at enhancing connectivity and technological advancements. In the competitive landscape, local players are increasingly collaborating with international firms to enhance their offerings. The presence of key players is growing, with companies like Panduit and Leviton expanding their operations in the region. The focus on smart city initiatives and digital transformation is expected to further boost the demand for structured cabling solutions, making this region a potential growth market.

    Key Players and Competitive Insights

    Leading market players are investing heavily in research and development to expand their product lines, which will help the Data Center Structured Cabling market grow even more. Market participants are also undertaking various strategic activities to expand their global footprint, with important market developments including new product launches, contractual agreements, mergers and acquisitions, higher investments, and collaboration with other organizations. To expand and survive in a more competitive and rising market climate, Data Center Structured Cabling industry must offer cost-effective items.

    Manufacturing locally to minimize operational costs is one of the key business tactics manufacturers use in the global Data Center Structured Cabling industry to benefit clients and increase the market sector. The Data Center Structured Cabling industry has offered some of the most significant advantages in recent years. Major players in the Data Center Structured Cabling market, including R&M Nexans S.A. Furukawa Electric Co Legrand Belden Inc Schneider Electric CommScope Panduit Corp Corning Inc Siemon and others, are attempting to increase market demand by investing in research and development operations.

    Panduit, a company driven by innovation, introduced its inaugural product, Panduct Wiring Duct, in 1955. This groundbreaking invention revolutionized control panel wiring by providing a unique solution for organizing and adding new wires. Panduit Corp. further expanded its portfolio with the launch of the RapidID Network Mapping System. This advanced software-enabled solution significantly reduces the time and costs associated with patch cord documentation. This system enables smart, scalable, and efficient connectivity solutions.

    Founded by Dr. M. Kara, a highly experienced medical doctor from the renowned Cleveland Clinic, KaraMD and Alternative Health Solutions aim to educate individuals about natural remedies and supplements that can seamlessly be incorporated into daily health routines for enhanced well-being. With a commitment to quality, all supplements are personally formulated by Dr. Kara in the USA at their FDA Registered Facility. Recently, KaraMD introduced Pure Health Apple Cider Vinegar Gummies, a vegan gummy designed to support ketosis, regulate digestion, aid in weight management, and boost energy levels.

    Key Companies in the Data Center Structured Cabling Market market include

    Industry Developments

    • Q2 2024: Data Centers' Staggering 35% Growth Paced Structured Cabling Market in 2024 The worldwide structured cabling market reached $7.6 billion in 2024, marking a 10% increase from the previous year, with fiber sales growing by 27% and singlemode fiber leading the charge, driven by surging data center investments, especially in AI infrastructure.

    Future Outlook

    Data Center Structured Cabling Market Future Outlook

    <p>The Data Center Structured Cabling Market is projected to grow at a 10.7% CAGR from 2024 to 2035, driven by increasing data demands and technological advancements.</p>

    New opportunities lie in:

    • <p>Integration of AI-driven monitoring systems for proactive maintenance.</p>
    • <p>Development of modular cabling solutions for scalable data centers.</p>
    • <p>Expansion into emerging markets with tailored cabling solutions.</p>

    <p>By 2035, the market is expected to be robust, reflecting substantial growth and innovation.</p>

    Market Segmentation

    Data Center Structured Wire Category Outlook

    • Category 5E
    • Category 6
    • Category 6A
    • Category 7
    • Others

    Data Center Structured Cabling Regional Outlook

    North America
    • US
    • Canada

    Data Center Structured CablingProduct Type Outlook

    • Copper Wire
    • Fiber Optic

    Report Scope

    MARKET SIZE 20243.65(USD Billion)
    MARKET SIZE 20254.041(USD Billion)
    MARKET SIZE 203511.17(USD Billion)
    COMPOUND ANNUAL GROWTH RATE (CAGR)10.7% (2024 - 2035)
    REPORT COVERAGERevenue Forecast, Competitive Landscape, Growth Factors, and Trends
    BASE YEAR2024
    Market Forecast Period2025 - 2035
    Historical Data2019 - 2024
    Market Forecast UnitsUSD Billion
    Key Companies ProfiledMarket analysis in progress
    Segments CoveredMarket segmentation analysis in progress
    Key Market OpportunitiesIntegration of advanced fiber optic technologies enhances performance in the Data Center Structured Cabling Market.
    Key Market DynamicsRising demand for high-speed connectivity drives innovation in Data Center Structured Cabling solutions and technologies.
    Countries CoveredNorth America, Europe, APAC, South America, MEA

    FAQs

    How much is the Data Center Structured Cabling market?

    The Data Center Structured Cabling Market size was valued at USD3.25 Billion in 2023.

    What is the growth rate of the Data Center Structured Cabling market?

    The global market is projected to grow at a CAGR of 10.70% during the forecast period, 2024-2032.

    Which Region held the largest Data Center Structured Cablingmarket share?

    North America had the largest share of the global market

    Who are the key players in the Data Center Structured Cabling market?

    The key players in the market areR&amp;M Nexans S.A. Furukawa Electric Co Legrand Belden Inc Schneider Electric CommScope Panduit Corp Corning Inc Siemon.

    Which Wire Categoryled the Data Center Structured Cabling Market?

    The Category 6AData Center Structured Cabling category dominated the market in 2023.

    Which Product Typehad the largest market share in the Data Center Structured Cabling market?

    Fiber Optichad is the largest share of the global market.

    1. SECTION I: EXECUTIVE SUMMARY AND KEY HIGHLIGHTS
      1. | 1.1 EXECUTIVE SUMMARY
      2. | | 1.1.1 Market Overview
      3. | | 1.1.2 Key Findings
      4. | | 1.1.3 Market Segmentation
      5. | | 1.1.4 Competitive Landscape
      6. | | 1.1.5 Challenges and Opportunities
      7. | | 1.1.6 Future Outlook
    2. SECTION II: SCOPING, METHODOLOGY AND MARKET STRUCTURE
      1. | 2.1 MARKET INTRODUCTION
      2. | | 2.1.1 Definition
      3. | | 2.1.2 Scope of the study
      4. | | | 2.1.2.1 Research Objective
      5. | | | 2.1.2.2 Assumption
      6. | | | 2.1.2.3 Limitations
      7. | 2.2 RESEARCH METHODOLOGY
      8. | | 2.2.1 Overview
      9. | | 2.2.2 Data Mining
      10. | | 2.2.3 Secondary Research
      11. | | 2.2.4 Primary Research
      12. | | | 2.2.4.1 Primary Interviews and Information Gathering Process
      13. | | | 2.2.4.2 Breakdown of Primary Respondents
      14. | | 2.2.5 Forecasting Model
      15. | | 2.2.6 Market Size Estimation
      16. | | | 2.2.6.1 Bottom-Up Approach
      17. | | | 2.2.6.2 Top-Down Approach
      18. | | 2.2.7 Data Triangulation
      19. | | 2.2.8 Validation
    3. SECTION III: QUALITATIVE ANALYSIS
      1. | 3.1 MARKET DYNAMICS
      2. | | 3.1.1 Overview
      3. | | 3.1.2 Drivers
      4. | | 3.1.3 Restraints
      5. | | 3.1.4 Opportunities
      6. | 3.2 MARKET FACTOR ANALYSIS
      7. | | 3.2.1 Value chain Analysis
      8. | | 3.2.2 Porter's Five Forces Analysis
      9. | | | 3.2.2.1 Bargaining Power of Suppliers
      10. | | | 3.2.2.2 Bargaining Power of Buyers
      11. | | | 3.2.2.3 Threat of New Entrants
      12. | | | 3.2.2.4 Threat of Substitutes
      13. | | | 3.2.2.5 Intensity of Rivalry
      14. | | 3.2.3 COVID-19 Impact Analysis
      15. | | | 3.2.3.1 Market Impact Analysis
      16. | | | 3.2.3.2 Regional Impact
      17. | | | 3.2.3.3 Opportunity and Threat Analysis
    4. SECTION IV: QUANTITATIVE ANALYSIS
      1. | 4.1 Information and Communications Technology, BY Wire Category (USD Billion)
      2. | | 4.1.1 Category 5E
      3. | | 4.1.2 Category 6
      4. | | 4.1.3 Category 6A
      5. | | 4.1.4 Category 7
      6. | | 4.1.5 Others
      7. | 4.2 Information and Communications Technology, BY Product Type (USD Billion)
      8. | | 4.2.1 Copper Wire
      9. | | 4.2.2 Fiber Optic
      10. | 4.3 Information and Communications Technology, BY Region (USD Billion)
      11. | | 4.3.1 North America
      12. | | | 4.3.1.1 US
      13. | | | 4.3.1.2 Canada
      14. | | 4.3.2 Europe
      15. | | | 4.3.2.1 Germany
      16. | | | 4.3.2.2 UK
      17. | | | 4.3.2.3 France
      18. | | | 4.3.2.4 Russia
      19. | | | 4.3.2.5 Italy
      20. | | | 4.3.2.6 Spain
      21. | | | 4.3.2.7 Rest of Europe
      22. | | 4.3.3 APAC
      23. | | | 4.3.3.1 China
      24. | | | 4.3.3.2 India
      25. | | | 4.3.3.3 Japan
      26. | | | 4.3.3.4 South Korea
      27. | | | 4.3.3.5 Malaysia
      28. | | | 4.3.3.6 Thailand
      29. | | | 4.3.3.7 Indonesia
      30. | | | 4.3.3.8 Rest of APAC
      31. | | 4.3.4 South America
      32. | | | 4.3.4.1 Brazil
      33. | | | 4.3.4.2 Mexico
      34. | | | 4.3.4.3 Argentina
      35. | | | 4.3.4.4 Rest of South America
      36. | | 4.3.5 MEA
      37. | | | 4.3.5.1 GCC Countries
      38. | | | 4.3.5.2 South Africa
      39. | | | 4.3.5.3 Rest of MEA
    5. SECTION V: COMPETITIVE ANALYSIS
      1. | 5.1 Competitive Landscape
      2. | | 5.1.1 Overview
      3. | | 5.1.2 Competitive Analysis
      4. | | 5.1.3 Market share Analysis
      5. | | 5.1.4 Major Growth Strategy in the Information and Communications Technology
      6. | | 5.1.5 Competitive Benchmarking
      7. | | 5.1.6 Leading Players in Terms of Number of Developments in the Information and Communications Technology
      8. | | 5.1.7 Key developments and growth strategies
      9. | | | 5.1.7.1 New Product Launch/Service Deployment
      10. | | | 5.1.7.2 Merger & Acquisitions
      11. | | | 5.1.7.3 Joint Ventures
      12. | | 5.1.8 Major Players Financial Matrix
      13. | | | 5.1.8.1 Sales and Operating Income
      14. | | | 5.1.8.2 Major Players R&D Expenditure. 2023
      15. | 5.2 Company Profiles
      16. | | 5.2.1 CommScope (US)
      17. | | | 5.2.1.1 Financial Overview
      18. | | | 5.2.1.2 Products Offered
      19. | | | 5.2.1.3 Key Developments
      20. | | | 5.2.1.4 SWOT Analysis
      21. | | | 5.2.1.5 Key Strategies
      22. | | 5.2.2 Belden (US)
      23. | | | 5.2.2.1 Financial Overview
      24. | | | 5.2.2.2 Products Offered
      25. | | | 5.2.2.3 Key Developments
      26. | | | 5.2.2.4 SWOT Analysis
      27. | | | 5.2.2.5 Key Strategies
      28. | | 5.2.3 Corning (US)
      29. | | | 5.2.3.1 Financial Overview
      30. | | | 5.2.3.2 Products Offered
      31. | | | 5.2.3.3 Key Developments
      32. | | | 5.2.3.4 SWOT Analysis
      33. | | | 5.2.3.5 Key Strategies
      34. | | 5.2.4 Siemon (US)
      35. | | | 5.2.4.1 Financial Overview
      36. | | | 5.2.4.2 Products Offered
      37. | | | 5.2.4.3 Key Developments
      38. | | | 5.2.4.4 SWOT Analysis
      39. | | | 5.2.4.5 Key Strategies
      40. | | 5.2.5 Panduit (US)
      41. | | | 5.2.5.1 Financial Overview
      42. | | | 5.2.5.2 Products Offered
      43. | | | 5.2.5.3 Key Developments
      44. | | | 5.2.5.4 SWOT Analysis
      45. | | | 5.2.5.5 Key Strategies
      46. | | 5.2.6 Leviton (US)
      47. | | | 5.2.6.1 Financial Overview
      48. | | | 5.2.6.2 Products Offered
      49. | | | 5.2.6.3 Key Developments
      50. | | | 5.2.6.4 SWOT Analysis
      51. | | | 5.2.6.5 Key Strategies
      52. | | 5.2.7 Nexans (FR)
      53. | | | 5.2.7.1 Financial Overview
      54. | | | 5.2.7.2 Products Offered
      55. | | | 5.2.7.3 Key Developments
      56. | | | 5.2.7.4 SWOT Analysis
      57. | | | 5.2.7.5 Key Strategies
      58. | | 5.2.8 Schneider Electric (FR)
      59. | | | 5.2.8.1 Financial Overview
      60. | | | 5.2.8.2 Products Offered
      61. | | | 5.2.8.3 Key Developments
      62. | | | 5.2.8.4 SWOT Analysis
      63. | | | 5.2.8.5 Key Strategies
      64. | | 5.2.9 TE Connectivity (CH)
      65. | | | 5.2.9.1 Financial Overview
      66. | | | 5.2.9.2 Products Offered
      67. | | | 5.2.9.3 Key Developments
      68. | | | 5.2.9.4 SWOT Analysis
      69. | | | 5.2.9.5 Key Strategies
      70. | 5.3 Appendix
      71. | | 5.3.1 References
      72. | | 5.3.2 Related Reports
    6. LIST OF FIGURES
      1. | 6.1 MARKET SYNOPSIS
      2. | 6.2 NORTH AMERICA MARKET ANALYSIS
      3. | 6.3 US MARKET ANALYSIS BY WIRE CATEGORY
      4. | 6.4 US MARKET ANALYSIS BY PRODUCT TYPE
      5. | 6.5 CANADA MARKET ANALYSIS BY WIRE CATEGORY
      6. | 6.6 CANADA MARKET ANALYSIS BY PRODUCT TYPE
      7. | 6.7 EUROPE MARKET ANALYSIS
      8. | 6.8 GERMANY MARKET ANALYSIS BY WIRE CATEGORY
      9. | 6.9 GERMANY MARKET ANALYSIS BY PRODUCT TYPE
      10. | 6.10 UK MARKET ANALYSIS BY WIRE CATEGORY
      11. | 6.11 UK MARKET ANALYSIS BY PRODUCT TYPE
      12. | 6.12 FRANCE MARKET ANALYSIS BY WIRE CATEGORY
      13. | 6.13 FRANCE MARKET ANALYSIS BY PRODUCT TYPE
      14. | 6.14 RUSSIA MARKET ANALYSIS BY WIRE CATEGORY
      15. | 6.15 RUSSIA MARKET ANALYSIS BY PRODUCT TYPE
      16. | 6.16 ITALY MARKET ANALYSIS BY WIRE CATEGORY
      17. | 6.17 ITALY MARKET ANALYSIS BY PRODUCT TYPE
      18. | 6.18 SPAIN MARKET ANALYSIS BY WIRE CATEGORY
      19. | 6.19 SPAIN MARKET ANALYSIS BY PRODUCT TYPE
      20. | 6.20 REST OF EUROPE MARKET ANALYSIS BY WIRE CATEGORY
      21. | 6.21 REST OF EUROPE MARKET ANALYSIS BY PRODUCT TYPE
      22. | 6.22 APAC MARKET ANALYSIS
      23. | 6.23 CHINA MARKET ANALYSIS BY WIRE CATEGORY
      24. | 6.24 CHINA MARKET ANALYSIS BY PRODUCT TYPE
      25. | 6.25 INDIA MARKET ANALYSIS BY WIRE CATEGORY
      26. | 6.26 INDIA MARKET ANALYSIS BY PRODUCT TYPE
      27. | 6.27 JAPAN MARKET ANALYSIS BY WIRE CATEGORY
      28. | 6.28 JAPAN MARKET ANALYSIS BY PRODUCT TYPE
      29. | 6.29 SOUTH KOREA MARKET ANALYSIS BY WIRE CATEGORY
      30. | 6.30 SOUTH KOREA MARKET ANALYSIS BY PRODUCT TYPE
      31. | 6.31 MALAYSIA MARKET ANALYSIS BY WIRE CATEGORY
      32. | 6.32 MALAYSIA MARKET ANALYSIS BY PRODUCT TYPE
      33. | 6.33 THAILAND MARKET ANALYSIS BY WIRE CATEGORY
      34. | 6.34 THAILAND MARKET ANALYSIS BY PRODUCT TYPE
      35. | 6.35 INDONESIA MARKET ANALYSIS BY WIRE CATEGORY
      36. | 6.36 INDONESIA MARKET ANALYSIS BY PRODUCT TYPE
      37. | 6.37 REST OF APAC MARKET ANALYSIS BY WIRE CATEGORY
      38. | 6.38 REST OF APAC MARKET ANALYSIS BY PRODUCT TYPE
      39. | 6.39 SOUTH AMERICA MARKET ANALYSIS
      40. | 6.40 BRAZIL MARKET ANALYSIS BY WIRE CATEGORY
      41. | 6.41 BRAZIL MARKET ANALYSIS BY PRODUCT TYPE
      42. | 6.42 MEXICO MARKET ANALYSIS BY WIRE CATEGORY
      43. | 6.43 MEXICO MARKET ANALYSIS BY PRODUCT TYPE
      44. | 6.44 ARGENTINA MARKET ANALYSIS BY WIRE CATEGORY
      45. | 6.45 ARGENTINA MARKET ANALYSIS BY PRODUCT TYPE
      46. | 6.46 REST OF SOUTH AMERICA MARKET ANALYSIS BY WIRE CATEGORY
      47. | 6.47 REST OF SOUTH AMERICA MARKET ANALYSIS BY PRODUCT TYPE
      48. | 6.48 MEA MARKET ANALYSIS
      49. | 6.49 GCC COUNTRIES MARKET ANALYSIS BY WIRE CATEGORY
      50. | 6.50 GCC COUNTRIES MARKET ANALYSIS BY PRODUCT TYPE
      51. | 6.51 SOUTH AFRICA MARKET ANALYSIS BY WIRE CATEGORY
      52. | 6.52 SOUTH AFRICA MARKET ANALYSIS BY PRODUCT TYPE
      53. | 6.53 REST OF MEA MARKET ANALYSIS BY WIRE CATEGORY
      54. | 6.54 REST OF MEA MARKET ANALYSIS BY PRODUCT TYPE
      55. | 6.55 KEY BUYING CRITERIA OF INFORMATION AND COMMUNICATIONS TECHNOLOGY
      56. | 6.56 RESEARCH PROCESS OF MRFR
      57. | 6.57 DRO ANALYSIS OF INFORMATION AND COMMUNICATIONS TECHNOLOGY
      58. | 6.58 DRIVERS IMPACT ANALYSIS: INFORMATION AND COMMUNICATIONS TECHNOLOGY
      59. | 6.59 RESTRAINTS IMPACT ANALYSIS: INFORMATION AND COMMUNICATIONS TECHNOLOGY
      60. | 6.60 SUPPLY / VALUE CHAIN: INFORMATION AND COMMUNICATIONS TECHNOLOGY
      61. | 6.61 INFORMATION AND COMMUNICATIONS TECHNOLOGY, BY WIRE CATEGORY, 2024 (% SHARE)
      62. | 6.62 INFORMATION AND COMMUNICATIONS TECHNOLOGY, BY WIRE CATEGORY, 2024 TO 2035 (USD Billion)
      63. | 6.63 INFORMATION AND COMMUNICATIONS TECHNOLOGY, BY PRODUCT TYPE, 2024 (% SHARE)
      64. | 6.64 INFORMATION AND COMMUNICATIONS TECHNOLOGY, BY PRODUCT TYPE, 2024 TO 2035 (USD Billion)
      65. | 6.65 BENCHMARKING OF MAJOR COMPETITORS
    7. LIST OF TABLES
      1. | 7.1 LIST OF ASSUMPTIONS
      2. | | 7.1.1
      3. | 7.2 North America MARKET SIZE ESTIMATES; FORECAST
      4. | | 7.2.1 BY WIRE CATEGORY, 2025-2035 (USD Billion)
      5. | | 7.2.2 BY PRODUCT TYPE, 2025-2035 (USD Billion)
      6. | 7.3 US MARKET SIZE ESTIMATES; FORECAST
      7. | | 7.3.1 BY WIRE CATEGORY, 2025-2035 (USD Billion)
      8. | | 7.3.2 BY PRODUCT TYPE, 2025-2035 (USD Billion)
      9. | 7.4 Canada MARKET SIZE ESTIMATES; FORECAST
      10. | | 7.4.1 BY WIRE CATEGORY, 2025-2035 (USD Billion)
      11. | | 7.4.2 BY PRODUCT TYPE, 2025-2035 (USD Billion)
      12. | 7.5 Europe MARKET SIZE ESTIMATES; FORECAST
      13. | | 7.5.1 BY WIRE CATEGORY, 2025-2035 (USD Billion)
      14. | | 7.5.2 BY PRODUCT TYPE, 2025-2035 (USD Billion)
      15. | 7.6 Germany MARKET SIZE ESTIMATES; FORECAST
      16. | | 7.6.1 BY WIRE CATEGORY, 2025-2035 (USD Billion)
      17. | | 7.6.2 BY PRODUCT TYPE, 2025-2035 (USD Billion)
      18. | 7.7 UK MARKET SIZE ESTIMATES; FORECAST
      19. | | 7.7.1 BY WIRE CATEGORY, 2025-2035 (USD Billion)
      20. | | 7.7.2 BY PRODUCT TYPE, 2025-2035 (USD Billion)
      21. | 7.8 France MARKET SIZE ESTIMATES; FORECAST
      22. | | 7.8.1 BY WIRE CATEGORY, 2025-2035 (USD Billion)
      23. | | 7.8.2 BY PRODUCT TYPE, 2025-2035 (USD Billion)
      24. | 7.9 Russia MARKET SIZE ESTIMATES; FORECAST
      25. | | 7.9.1 BY WIRE CATEGORY, 2025-2035 (USD Billion)
      26. | | 7.9.2 BY PRODUCT TYPE, 2025-2035 (USD Billion)
      27. | 7.10 Italy MARKET SIZE ESTIMATES; FORECAST
      28. | | 7.10.1 BY WIRE CATEGORY, 2025-2035 (USD Billion)
      29. | | 7.10.2 BY PRODUCT TYPE, 2025-2035 (USD Billion)
      30. | 7.11 Spain MARKET SIZE ESTIMATES; FORECAST
      31. | | 7.11.1 BY WIRE CATEGORY, 2025-2035 (USD Billion)
      32. | | 7.11.2 BY PRODUCT TYPE, 2025-2035 (USD Billion)
      33. | 7.12 Rest of Europe MARKET SIZE ESTIMATES; FORECAST
      34. | | 7.12.1 BY WIRE CATEGORY, 2025-2035 (USD Billion)
      35. | | 7.12.2 BY PRODUCT TYPE, 2025-2035 (USD Billion)
      36. | 7.13 APAC MARKET SIZE ESTIMATES; FORECAST
      37. | | 7.13.1 BY WIRE CATEGORY, 2025-2035 (USD Billion)
      38. | | 7.13.2 BY PRODUCT TYPE, 2025-2035 (USD Billion)
      39. | 7.14 China MARKET SIZE ESTIMATES; FORECAST
      40. | | 7.14.1 BY WIRE CATEGORY, 2025-2035 (USD Billion)
      41. | | 7.14.2 BY PRODUCT TYPE, 2025-2035 (USD Billion)
      42. | 7.15 India MARKET SIZE ESTIMATES; FORECAST
      43. | | 7.15.1 BY WIRE CATEGORY, 2025-2035 (USD Billion)
      44. | | 7.15.2 BY PRODUCT TYPE, 2025-2035 (USD Billion)
      45. | 7.16 Japan MARKET SIZE ESTIMATES; FORECAST
      46. | | 7.16.1 BY WIRE CATEGORY, 2025-2035 (USD Billion)
      47. | | 7.16.2 BY PRODUCT TYPE, 2025-2035 (USD Billion)
      48. | 7.17 South Korea MARKET SIZE ESTIMATES; FORECAST
      49. | | 7.17.1 BY WIRE CATEGORY, 2025-2035 (USD Billion)
      50. | | 7.17.2 BY PRODUCT TYPE, 2025-2035 (USD Billion)
      51. | 7.18 Malaysia MARKET SIZE ESTIMATES; FORECAST
      52. | | 7.18.1 BY WIRE CATEGORY, 2025-2035 (USD Billion)
      53. | | 7.18.2 BY PRODUCT TYPE, 2025-2035 (USD Billion)
      54. | 7.19 Thailand MARKET SIZE ESTIMATES; FORECAST
      55. | | 7.19.1 BY WIRE CATEGORY, 2025-2035 (USD Billion)
      56. | | 7.19.2 BY PRODUCT TYPE, 2025-2035 (USD Billion)
      57. | 7.20 Indonesia MARKET SIZE ESTIMATES; FORECAST
      58. | | 7.20.1 BY WIRE CATEGORY, 2025-2035 (USD Billion)
      59. | | 7.20.2 BY PRODUCT TYPE, 2025-2035 (USD Billion)
      60. | 7.21 Rest of APAC MARKET SIZE ESTIMATES; FORECAST
      61. | | 7.21.1 BY WIRE CATEGORY, 2025-2035 (USD Billion)
      62. | | 7.21.2 BY PRODUCT TYPE, 2025-2035 (USD Billion)
      63. | 7.22 South America MARKET SIZE ESTIMATES; FORECAST
      64. | | 7.22.1 BY WIRE CATEGORY, 2025-2035 (USD Billion)
      65. | | 7.22.2 BY PRODUCT TYPE, 2025-2035 (USD Billion)
      66. | 7.23 Brazil MARKET SIZE ESTIMATES; FORECAST
      67. | | 7.23.1 BY WIRE CATEGORY, 2025-2035 (USD Billion)
      68. | | 7.23.2 BY PRODUCT TYPE, 2025-2035 (USD Billion)
      69. | 7.24 Mexico MARKET SIZE ESTIMATES; FORECAST
      70. | | 7.24.1 BY WIRE CATEGORY, 2025-2035 (USD Billion)
      71. | | 7.24.2 BY PRODUCT TYPE, 2025-2035 (USD Billion)
      72. | 7.25 Argentina MARKET SIZE ESTIMATES; FORECAST
      73. | | 7.25.1 BY WIRE CATEGORY, 2025-2035 (USD Billion)
      74. | | 7.25.2 BY PRODUCT TYPE, 2025-2035 (USD Billion)
      75. | 7.26 Rest of South America MARKET SIZE ESTIMATES; FORECAST
      76. | | 7.26.1 BY WIRE CATEGORY, 2025-2035 (USD Billion)
      77. | | 7.26.2 BY PRODUCT TYPE, 2025-2035 (USD Billion)
      78. | 7.27 MEA MARKET SIZE ESTIMATES; FORECAST
      79. | | 7.27.1 BY WIRE CATEGORY, 2025-2035 (USD Billion)
      80. | | 7.27.2 BY PRODUCT TYPE, 2025-2035 (USD Billion)
      81. | 7.28 GCC Countries MARKET SIZE ESTIMATES; FORECAST
      82. | | 7.28.1 BY WIRE CATEGORY, 2025-2035 (USD Billion)
      83. | | 7.28.2 BY PRODUCT TYPE, 2025-2035 (USD Billion)
      84. | 7.29 South Africa MARKET SIZE ESTIMATES; FORECAST
      85. | | 7.29.1 BY WIRE CATEGORY, 2025-2035 (USD Billion)
      86. | | 7.29.2 BY PRODUCT TYPE, 2025-2035 (USD Billion)
      87. | 7.30 Rest of MEA MARKET SIZE ESTIMATES; FORECAST
      88. | | 7.30.1 BY WIRE CATEGORY, 2025-2035 (USD Billion)
      89. | | 7.30.2 BY PRODUCT TYPE, 2025-2035 (USD Billion)
      90. | 7.31 PRODUCT LAUNCH/PRODUCT DEVELOPMENT/APPROVAL
      91. | | 7.31.1
      92. | 7.32 ACQUISITION/PARTNERSHIP
      93. | | 7.32.1

    Data Center Structured Cabling Market Segmentation

    Data Center Structured Cabling Market Wire Category Outlook (USD Billion, 2018-2032)

    Category 5E

    Category 6

    Category 6A

    Category 7

    Others

    Data Center Structured Cabling Market Product Type Outlook (USD Billion, 2018-2032)

    Copper Wire

    Fiber Optic

    Data Center Structured Cabling Market Regional Outlook (USD Billion, 2018-2032)

    North America Outlook (USD Billion, 2018-2032)

    North America Data Center Structured Cabling Market by Wire Category

    Category 5E

    Category 6

    Category 6A

    Category 7

    Others

    North America Data Center Structured Cabling Market by Product Type

    Copper Wire

    Fiber Optic

    US Outlook (USD Billion, 2018-2032)

    US Data Center Structured Cabling Market by Wire Category

    Category 5E

    Category 6

    Category 6A

    Category 7

    Others

    US Data Center Structured Cabling Market by Product Type

    Copper Wire

    Fiber Optic

    CANADA Outlook (USD Billion, 2018-2032)

    CANADA Data Center Structured Cabling Market by Wire Category

    Category 5E

    Category 6

    Category 6A

    Category 7

    Others

    CANADA Data Center Structured Cabling Market by Product Type

    Copper Wire

    Fiber Optic

    Europe Outlook (USD Billion, 2018-2032)

    Europe Data Center Structured Cabling Market by Wire Category

    Category 5E

    Category 6

    Category 6A

    Category 7

    Others

    Europe Data Center Structured Cabling Market by Product Type

    Copper Wire

    Fiber Optic

    Germany Outlook (USD Billion, 2018-2032)

    Germany Data Center Structured Cabling Market by Wire Category

    Category 5E

    Category 6

    Category 6A

    Category 7

    Others

    Germany Data Center Structured Cabling Market by Product Type

    Copper Wire

    Fiber Optic

    France Outlook (USD Billion, 2018-2032)

    France Data Center Structured Cabling Market by Wire Category

    Category 5E

    Category 6

    Category 6A

    Category 7

    Others

    France Data Center Structured Cabling Market by Product Type

    Copper Wire

    Fiber Optic

    UK Outlook (USD Billion, 2018-2032)

    UK Data Center Structured Cabling Market by Wire Category

    Category 5E

    Category 6

    Category 6A

    Category 7

    Others

    UK Data Center Structured Cabling Market by Product Type

    Copper Wire

    Fiber Optic

    ITALY Outlook (USD Billion, 2018-2032)

    ITALY Data Center Structured Cabling Market by Wire Category

    Category 5E

    Category 6

    Category 6A

    Category 7

    Others

    ITALY Data Center Structured Cabling Market by Product Type

    Copper Wire

    Fiber Optic

    SPAIN Outlook (USD Billion, 2018-2032)

    Spain Data Center Structured Cabling Market by Wire Category

    Category 5E

    Category 6

    Category 6A

    Category 7

    Others

    Spain Data Center Structured Cabling Market by Product Type

    Copper Wire

    Fiber Optic

    Rest Of Europe Outlook (USD Billion, 2018-2032)

    Rest Of Europe Data Center Structured Cabling Market by Wire Category

    Category 5E

    Category 6

    Category 6A

    Category 7

    Others

    REST OF EUROPE Data Center Structured Cabling Market by Product Type

    Copper Wire

    Fiber Optic

    Asia-Pacific Outlook (USD Billion, 2018-2032)

    Asia-Pacific Data Center Structured Cabling Market by Wire Category

    Category 5E

    Category 6

    Category 6A

    Category 7

    Others

    Asia-Pacific Data Center Structured Cabling Market by Product Type

    Copper Wire

    Fiber Optic

    China Outlook (USD Billion, 2018-2032)

    China Data Center Structured Cabling Market by Wire Category

    Category 5E

    Category 6

    Category 6A

    Category 7

    Others

    China Data Center Structured Cabling Market by Product Type

    Copper Wire

    Fiber Optic

    Japan Outlook (USD Billion, 2018-2032)

    Japan Data Center Structured Cabling Market by Wire Category

    Category 5E

    Category 6

    Category 6A

    Category 7

    Others

    Japan Data Center Structured Cabling Market by Product Type

    Copper Wire

    Fiber Optic

    India Outlook (USD Billion, 2018-2032)

    India Data Center Structured Cabling Market by Wire Category

    Category 5E

    Category 6

    Category 6A

    Category 7

    Others

    India Data Center Structured Cabling Market by Product Type

    Copper Wire

    Fiber Optic

    Australia Outlook (USD Billion, 2018-2032)

    Australia Data Center Structured Cabling Market by Wire Category

    Category 5E

    Category 6

    Category 6A

    Category 7

    Others

    Australia Data Center Structured Cabling Market by Product Type

    Copper Wire

    Fiber Optic

    Rest of Asia-Pacific Outlook (USD Billion, 2018-2032)

    Rest of Asia-Pacific Data Center Structured Cabling Market by Wire Category

    Category 5E

    Category 6

    Category 6A

    Category 7

    Others

    Rest of Asia-Pacific Data Center Structured Cabling Market by Product Type

    Copper Wire

    Fiber Optic

    Rest of the World Outlook (USD Billion, 2018-2032)

    Rest of the World Data Center Structured Cabling Market by Wire Category

    Category 5E

    Category 6

    Category 6A

    Category 7

    Others

    Rest of the World Data Center Structured Cabling Market by Product Type

    Copper Wire

    Fiber Optic

    Middle East Outlook (USD Billion, 2018-2032)

    Middle East Data Center Structured Cabling Market by Wire Category

    Category 5E

    Category 6

    Category 6A

    Category 7

    Others

    Middle East Data Center Structured Cabling Market by Product Type

    Copper Wire

    Fiber Optic

    Africa Outlook (USD Billion, 2018-2032)

    Africa Data Center Structured Cabling Market by Wire Category

    Category 5E

    Category 6

    Category 6A

    Category 7

    Others

    Africa Data Center Structured Cabling Market by Product Type

    Copper Wire

    Fiber Optic

    Latin America Outlook (USD Billion, 2018-2032)

    Latin America Data Center Structured Cabling Market by Wire Category

    Category 5E

    Category 6

    Category 6A

    Category 7

    Others

    Latin America Data Center Structured Cabling Market by Product Type

    Copper Wire

    Fiber Optic


    Infographic

    Free Sample Request

    Kindly complete the form below to receive a free sample of this Report

    Get Free Sample

    Customer Strories

    “I am very pleased with how market segments have been defined in a relevant way for my purposes (such as "Portable Freezers & refrigerators" and "last-mile"). In general the report is well structured. Thanks very much for your efforts.”

    Victoria Milne

    Founder
    Case Study
    Chemicals and Materials

    Compare Licence

    ×
    Features License Type
    Single User Multiuser License Enterprise User
    Price $4,950 $5,950 $7,250
    Maximum User Access Limit 1 User Upto 10 Users Unrestricted Access Throughout the Organization
    Free Customization
    Direct Access to Analyst
    Deliverable Format
    Platform Access
    Discount on Next Purchase 10% 15% 15%
    Printable Versions