Healthcare Market Segmentation
Healthcare By Indication (USD Billion, 2025-2035)
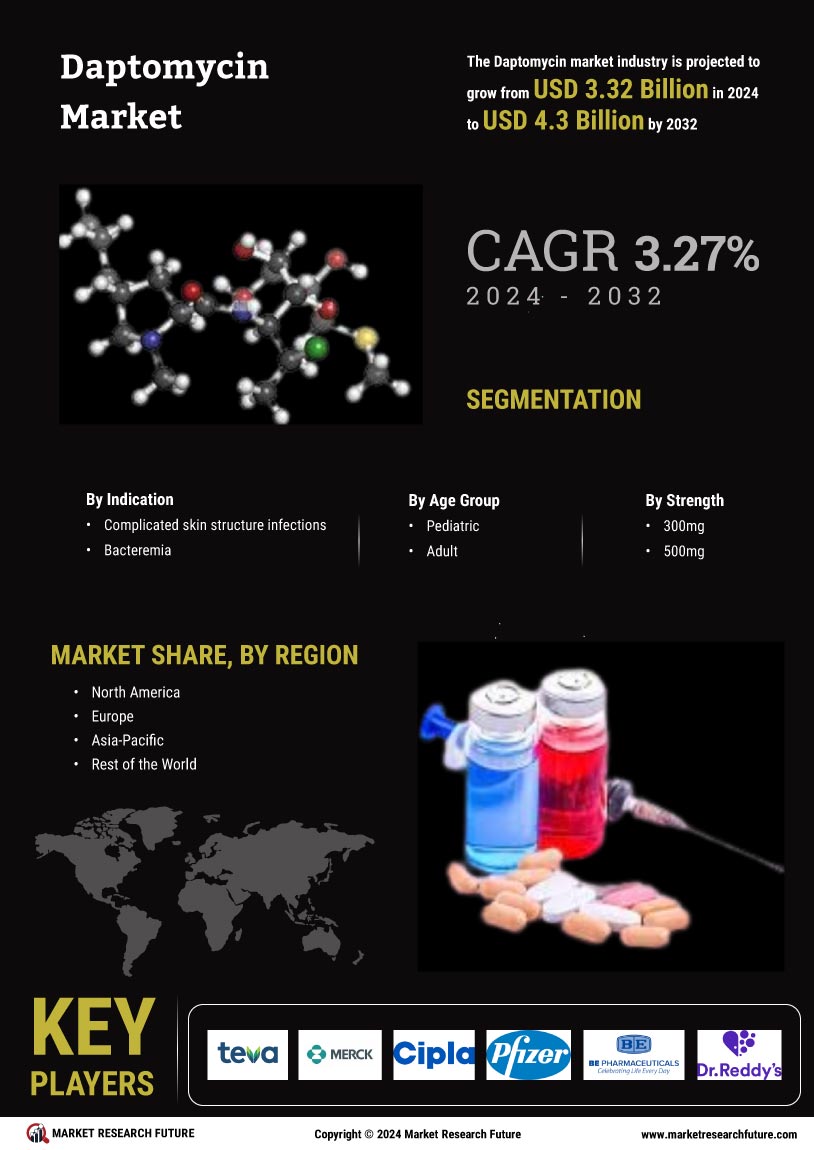
- Complicated skin structure infections
- Bacteremia
Healthcare By Age Group (USD Billion, 2025-2035)
- Pediatric
- Adult
Healthcare By Strength (USD Billion, 2025-2035)
- 350mg
- 500mg