Dairy By Products Market Segmentation
Dairy By Products Market By Type (USD Billion, 2025-2035)
- Whey Protein
- Lactose
- Casein
- Butter Milk
- Skimmed Milk Powder
Dairy By Products Market By Application (USD Billion, 2025-2035)
- Food and Beverages
- Animal Feed
- Nutritional Supplements
- Dairy By Products Markets
Dairy By Products Market By Source (USD Billion, 2025-2035)
- Cow Milk
- Buffalo Milk
- Goat Milk
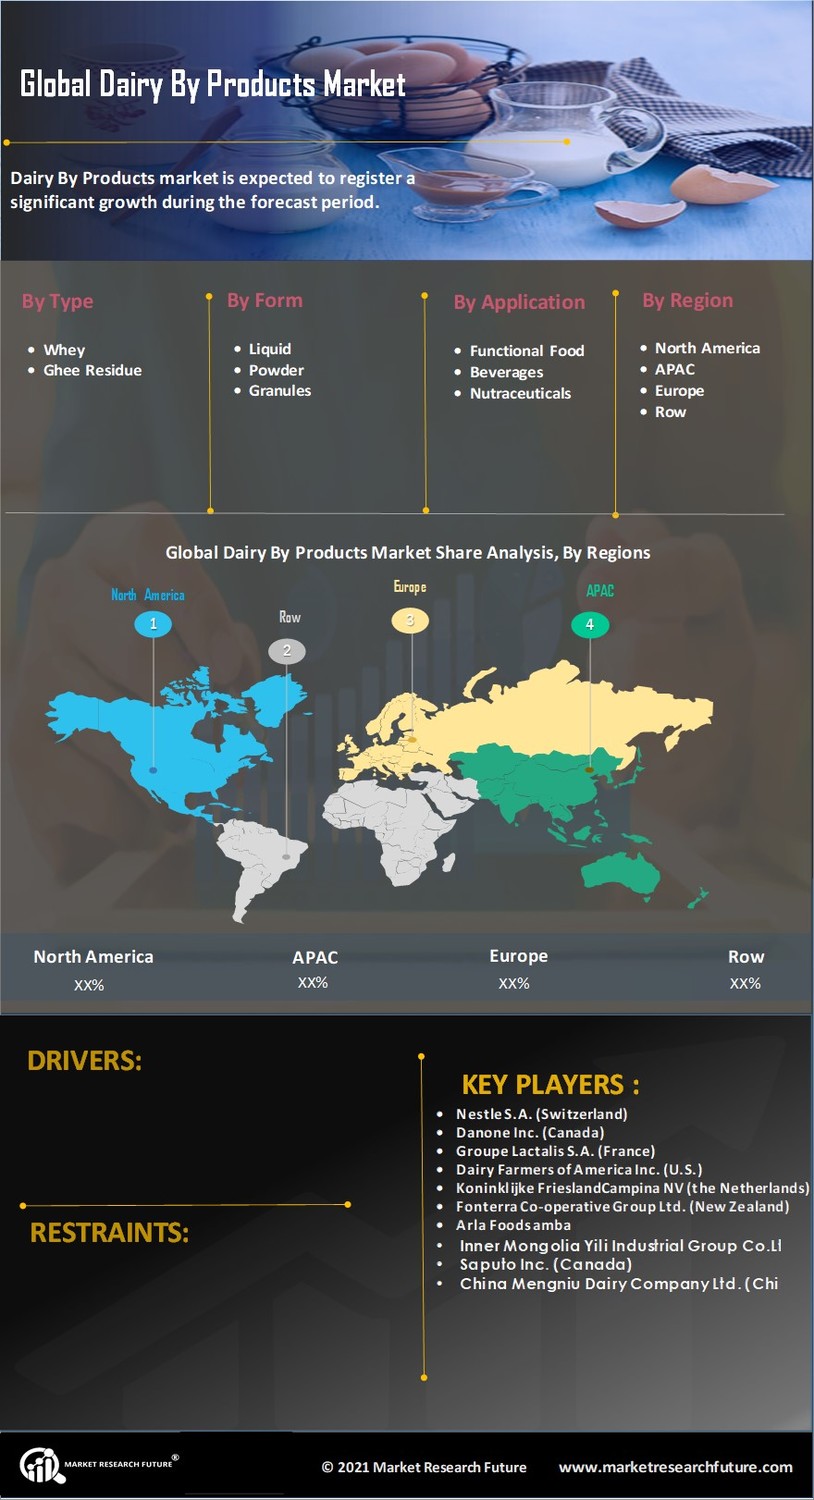
Dairy By Products Market By Form (USD Billion, 2025-2035)
- Liquid
- Powder
- Granules