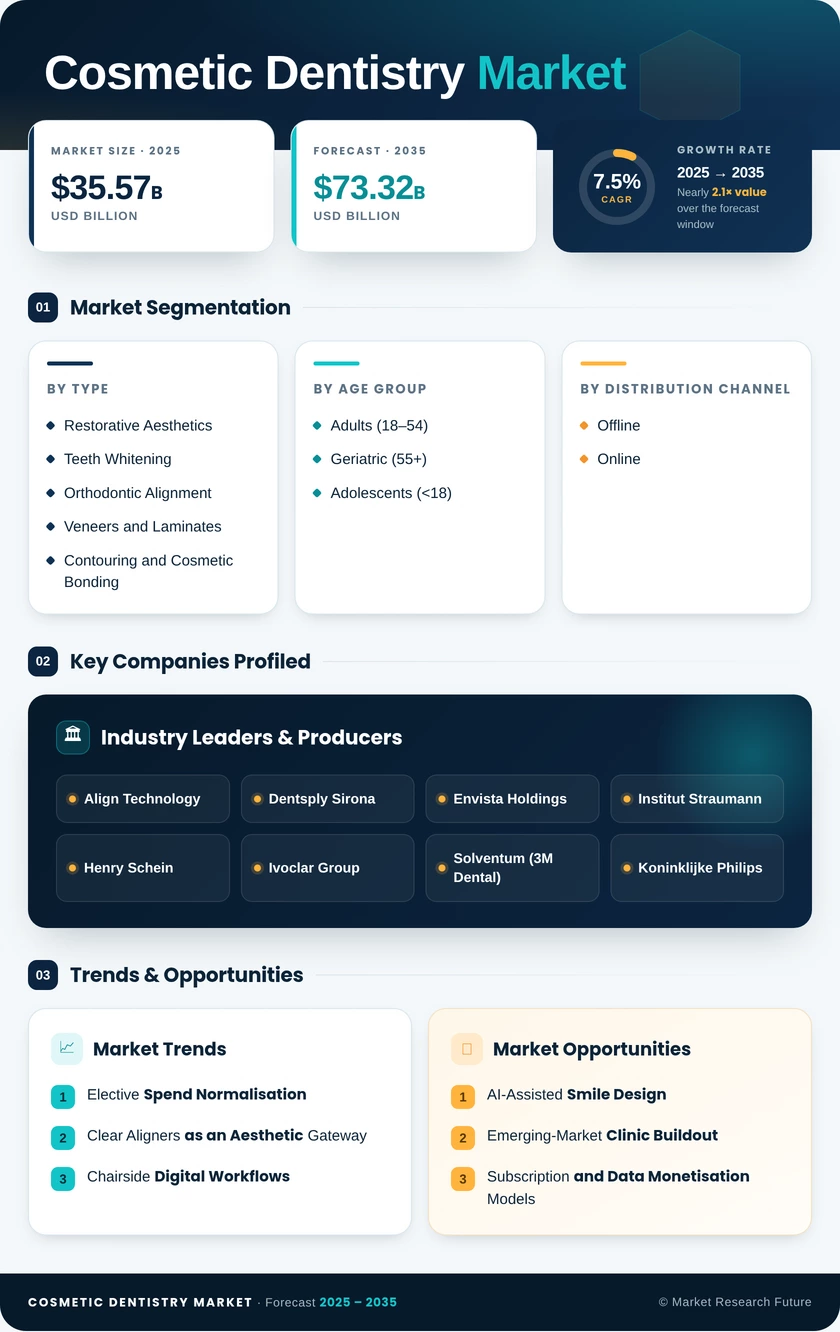
Cosmetic Dentistry Market (2026 - 2035)

Cosmetic Dentistry Market Research Report: Size, Share, Trend Analysis By Treatment Type (Teeth Whitening, Dental Veneers, Dental Implants, Orthodontics, Dental Crowns), By Material Used (Ceramics, Composite Resins, Porcelain, Metal Alloys, Glass Ionomer), By Patient Demographic (Adults, Teens, Children), By Distribution Channel (Dental Clinics, Hospitals, Online Dental Services, Retail Pharmacies) and By Regional (North America, Europe, South America, Asia Pacific, Middle East and Africa) - Growth Outlook & Industry Forecast 2025 To 2035

Forecast Period
2026-2035
CAGR
7.5%
2025 Market Size
USD 35.57 Billion
2035 Market Size
USD 73.32 Billion
Medical Device ● Updated August 2026 Report ID: MRFR/MED/4908-HCR | Pages: 100 | Author: Rahul Gotadki, Kinjoll Dey
  1. 1 Market Summary |
    1. 1.1 Study Assumptions & Market Definition |
    2. 1.2 Scope of the Study |
    3. 1.3 Research Methodology
  2. 2 Key Report Takeaways |
    1. 2.1 By Product Type |
    2. 2.2 By Procedure and End User |
    3. 2.3 By Geography
  3. 3 Market Size & Forecast (2021–2035) |
    1. 3.1 Historical Market Size (2021–2025) |
    2. 3.2 Current & Forecast Market Size (2026–2035) |
    3. 3.3 Market Size by Revenue (USD Billion) |
    4. 3.4 Year-over-Year Growth Analysis
  4. 4 Driver Impact Analysis |
    1. 4.1 Elective Spend Normalisation |
    2. 4.2 Clear Aligners as an Aesthetic Gateway |
    3. 4.3 Chairside Digital Workflows |
    4. 4.4 DSO Capital and Standardised Protocols
  5. 5 Restraints Impact Analysis |
    1. 5.1 The Reimbursement Gap |
    2. 5.2 Clinical Workforce Constraints |
    3. 5.3 Equipment Economics for Independents
  6. 6 Opportunity Analysis |
    1. 6.1 AI-Assisted Smile Design |
    2. 6.2 Emerging-Market Clinic Buildout |
    3. 6.3 Subscription and Data Monetisation Models |
    4. 6.4 Additive Manufacturing for Definitive Restorations |
    5. 6.5 Teledentistry Triage Channels |
    6. 6.6 Industry Value Chain Analysis |
    7. 6.7 Porter's Five Forces Analysis
  7. 7 Regional Market Share & Country-Level Analysis |
    1. 7.1 North America | |
      1. 7.1.1 United States | |
      2. 7.1.2 Canada | |
      3. 7.1.3 Mexico |
    2. 7.2 Europe | |
      1. 7.2.1 Germany | |
      2. 7.2.2 United Kingdom | |
      3. 7.2.3 France | |
      4. 7.2.4 Italy | |
      5. 7.2.5 Spain | |
      6. 7.2.6 Nordic Countries | |
      7. 7.2.7 Russia | |
      8. 7.2.8 Rest of Europe |
    3. 7.3 Asia-Pacific | |
      1. 7.3.1 China | |
      2. 7.3.2 India | |
      3. 7.3.3 Japan | |
      4. 7.3.4 South Korea | |
      5. 7.3.5 ASEAN | |
      6. 7.3.6 Rest of Asia-Pacific |
    4. 7.4 South America | |
      1. 7.4.1 Brazil | |
      2. 7.4.2 Argentina | |
      3. 7.4.3 Rest of South America |
    5. 7.5 Middle East & Africa | |
      1. 7.5.1 Saudi Arabia | |
      2. 7.5.2 UAE | |
      3. 7.5.3 South Africa | |
      4. 7.5.4 Egypt | |
      5. 7.5.5 Rest of Middle East & Africa
  8. 8 Future Outlook (2026–2035) |
    1. 8.1 Autonomous Treatment Planning |
    2. 8.2 Platform Economics and Ecosystem Lock-In |
    3. 8.3 Materials Science and the Metal-Free Operatory |
    4. 8.4 Access, Equity and Outcome Reporting
  9. 9 Market Segmentation Analysis |
    1. 9.1 By Product Type | |
      1. 9.1.1 Dental Systems and Equipment | |
      2. 9.1.2 Dental Implants | |
      3. 9.1.3 Dental Crowns and Bridges | |
      4. 9.1.4 Dental Veneers and Laminates | |
      5. 9.1.5 Whitening Products | |
      6. 9.1.6 Bonding Agents and Composites | |
      7. 9.1.7 Orthodontic Aligners and Braces |
    2. 9.2 By Procedure Type | |
      1. 9.2.1 Restorative Aesthetics | |
      2. 9.2.2 Teeth Whitening | |
      3. 9.2.3 Orthodontic Alignment | |
      4. 9.2.4 Veneers and Laminates | |
      5. 9.2.5 Contouring and Cosmetic Bonding |
    3. 9.3 By Age Group | |
      1. 9.3.1 Adults (18–54) | |
      2. 9.3.2 Geriatric (55+) | |
      3. 9.3.3 Adolescents (<18) |
    4. 9.4 By Distribution Channel | |
      1. 9.4.1 Offline | |
      2. 9.4.2 Online |
    5. 9.5 By End User | |
      1. 9.5.1 Dental Clinics | |
      2. 9.5.2 Hospitals | |
      3. 9.5.3 Dental Laboratories | |
      4. 9.5.4 Others
  10. 10 Competitive Landscape |
    1. 10.1 Market Concentration Analysis (2026) |
    2. 10.2 Competitive Benchmarking Matrix |
    3. 10.3 Company Profiles | |
      1. 10.3.1 Align Technology | |
      2. 10.3.2 Dentsply Sirona | |
      3. 10.3.3 Envista Holdings | |
      4. 10.3.4 Institut Straumann | |
      5. 10.3.5 Henry Schein | |
      6. 10.3.6 Ivoclar Group | |
      7. 10.3.7 Solventum | |
      8. 10.3.8 Koninklijke Philips | |
      9. 10.3.9 Ultradent Products | |
      10. 10.3.10 GC Corporation | |
      11. 10.3.11 Kulzer | |
      12. 10.3.12 ZimVie
  11. 11 Recent News & Developments
  12. 12 Report Scope & Methodology |
    1. 12.1 Study Period & Base Year |
    2. 12.2 Data Sources & Triangulation |
    3. 12.3 Abbreviations
  13. 13 Detailed Sources & Citations
  14. 14 Frequently Asked Questions
  15. 15 LIST OF TABLES |
  16. TABLE 1 Global Cosmetic Dentistry Market Size & Forecast, by Revenue (USD Billion), 2021–2035 |
  17. TABLE 2 Global Cosmetic Dentistry Market – Year-over-Year Growth Analysis, 2021–2035 |
  18. TABLE 3 Driver Impact Analysis – Estimated Contribution to CAGR, 2026–2035 |
  19. TABLE 4 Restraint Impact Analysis – Estimated Drag on CAGR, 2026–2035 |
  20. TABLE 5 Global Cosmetic Dentistry Market Size, by Region, 2021–2035 (USD Billion) |
  21. TABLE 6 North America Cosmetic Dentistry Market Size, by Country, 2021–2035 (USD Billion) |
  22. TABLE 7 Europe Cosmetic Dentistry Market Size, by Country, 2021–2035 (USD Billion) |
  23. TABLE 8 Asia-Pacific Cosmetic Dentistry Market Size, by Country, 2021–2035 (USD Billion) |
  24. TABLE 9 South America Cosmetic Dentistry Market Size, by Country, 2021–2035 (USD Billion) |
  25. TABLE 10 Middle East & Africa Cosmetic Dentistry Market Size, by Country, 2021–2035 (USD Billion) |
  26. TABLE 11 Global Market Size, by Product Type, 2021–2035 (USD Billion) |
  27. TABLE 12 Global Market Size, by Procedure Type, 2021–2035 (USD Billion) |
  28. TABLE 13 Global Market Size, by Age Group, 2021–2035 (USD Billion) |
  29. TABLE 14 Global Market Size, by Distribution Channel, 2021–2035 (USD Billion) |
  30. TABLE 15 Global Market Size, by End User, 2021–2035 (USD Billion) |
  31. TABLE 16 North America Market Size, by Product Type and Procedure Type, 2021–2035 (USD Billion) |
  32. TABLE 17 Europe Market Size, by Product Type and Procedure Type, 2021–2035 (USD Billion) |
  33. TABLE 18 Asia-Pacific Market Size, by Product Type and Procedure Type, 2021–2035 (USD Billion) |
  34. TABLE 19 South America Market Size, by Product Type and End User, 2021–2035 (USD Billion) |
  35. TABLE 20 Middle East & Africa Market Size, by Product Type and End User, 2021–2035 (USD Billion) |
  36. TABLE 21 Competitive Benchmarking Matrix, 2026 |
  37. TABLE 22 Company Profiles – Key Players |
  38. TABLE 23 Recent Developments & Strategic Announcements, 2023–2025 |
  39. TABLE 24 Report Scope & Methodology Summary |
  40. TABLE 25 Detailed Sources & Citations Index
  41. 16 LIST OF FIGURES |
  42. FIGURE 1 Market Dynamics – Drivers, Restraints and Opportunities Overview |
  43. FIGURE 2 Industry Value Chain Analysis – Materials to Chairside Delivery |
  44. FIGURE 3 Porter's Five Forces Analysis |
  45. FIGURE 4 Global Market Size Trend and Forecast, 2021–2035 (USD Billion) |
  46. FIGURE 5 Year-over-Year Growth Rate Trend, 2022–2035 (%) |
  47. FIGURE 6 Market Share by Product Type, 2025 vs 2035 (%) |
  48. FIGURE 7 Market Share by Procedure Type, 2025 (%) |
  49. FIGURE 8 Market Share by Age Group, 2025 (%) |
  50. FIGURE 9 Market Share by Distribution Channel, 2025 vs 2035 (%) |
  51. FIGURE 10 Market Share by End User, 2025 (%) |
  52. FIGURE 11 Regional Revenue Share, 2025 (%) |
  53. FIGURE 12 Regional CAGR Comparison, 2026–2035 (%) |
  54. FIGURE 13 North America Country-Level Share, 2025 (%) |
  55. FIGURE 14 Asia-Pacific Country-Level Share, 2025 (%) |
  56. FIGURE 15 Competitive Landscape – Estimated Revenue Share Bands, 2026 |
  57. FIGURE 16 Strategic Positioning Matrix – Portfolio Breadth vs Digital Integration
Share::
Request Free Sample

Segmentation Quick Reference

DimensionSub-SegmentsDominant SegmentFastest Growing Segment
By Product TypeDental Systems and Equipment; Dental Implants; Dental Crowns and Bridges; Dental Veneers and Laminates; Whitening Products; Bonding Agents and Composites; Orthodontic Aligners and BracesDental Systems and EquipmentOrthodontic Aligners and Braces
By Procedure TypeRestorative Aesthetics; Teeth Whitening; Orthodontic Alignment; Veneers and Laminates; Contouring and Cosmetic BondingRestorative AestheticsOrthodontic Alignment
By Age GroupAdults (18–54); Geriatric (55+); Adolescents (<18)Adults (18–54)Adolescents (<18)
By Distribution ChannelOffline; OnlineOfflineOnline
By End UserDental Clinics; Hospitals; Dental Laboratories; OthersDental ClinicsDental Laboratories
By GeographyNorth America; Europe; Asia-Pacific; South America; Middle East & AfricaNorth AmericaAsia-Pacific


Market Segmentation Overview

By Product Type

Sub-SegmentKey Trend
Dental Systems and EquipmentScanner-plus-mill bundles replacing standalone capital purchases
Dental ImplantsPrice compression from centralised procurement widening access
Dental Crowns and BridgesMonolithic zirconia displacing metal-ceramic in aesthetic zones
Dental Veneers and LaminatesMinimal-prep systems reducing irreversible tooth reduction
Whitening ProductsProfessional in-office systems defending share against retail
Bonding Agents and CompositesUniversal adhesives simplifying inventory and technique
Orthodontic Aligners and BracesAdult segment expanding faster than adolescent orthodontics


Product-level competition has shifted from individual device performance toward ecosystem integration. Suppliers that connect scanning, design, fabrication, and materials under one validated workflow are winning multi-site contracts, while single-product specialists retain ground only where clinical performance is demonstrably superior.

By Procedure Type

Sub-SegmentKey Trend
Restorative AestheticsAesthetic finishing becoming default expectation on functional cases
Teeth WhiteningFunctioning as a patient-acquisition channel for higher-value work
Orthodontic AlignmentDigital simulation lifting adult case acceptance
Veneers and LaminatesSame-visit delivery narrowing the gap with laboratory fabrication
Contouring and Cosmetic BondingGrowth in affordable single-appointment corrections


Procedure mix determines practice profitability more than patient count. Clinics that sequence low-barrier treatments into structured multi-stage plans consistently outperform those relying on episodic demand, and vendors are building financing and treatment-planning tools specifically to support that sequencing.

By Age Group

Sub-SegmentKey Trend
Adults (18–54)Career-linked appearance spending sustaining core demand
Geriatric (55+)Higher dentition retention converting denture demand into restorative aesthetics
Adolescents (<18)Early orthodontic intervention creating lifetime patient relationships


Demographic patterns are diverging by region. Mature markets skew increasingly older as retained natural teeth require aesthetic maintenance over decades, while Asian and Latin American demand concentrates among younger urban professionals entering the category for the first time.

By Distribution Channel

Sub-SegmentKey Trend
OfflineClinic-mediated supply retaining control of licensed procedures
OnlineRapid growth in maintenance products, retainers and custom trays


Channel boundaries are hardening around regulatory lines rather than consumer preference. Anything requiring clinical judgement stays professional; anything repeat-purchased and low-risk migrates online, and manufacturers are increasingly building parallel brands to serve both without cannibalising practice relationships.

By End User

Sub-SegmentKey Trend
Dental ClinicsConsolidation into groups standardising equipment and materials
HospitalsFocus on complex reconstructive and post-oncology aesthetic cases
Dental LaboratoriesPivot to complex multi-unit work as chairside absorbs single units
OthersAcademic centres and in-house DSO facilities scaling internal capacity


Care-setting economics are diverging. Clinics gain from same-visit efficiency, laboratories survive by moving upmarket into cases chairside equipment cannot handle, and hospital departments occupy a narrow but defensible niche around medically complex reconstruction.




Share::
Request Free Sample
Download PDF ×

We do not share your information with anyone. However, we may send you emails based on your report interest from time to time. You may contact us at any time to opt-out.