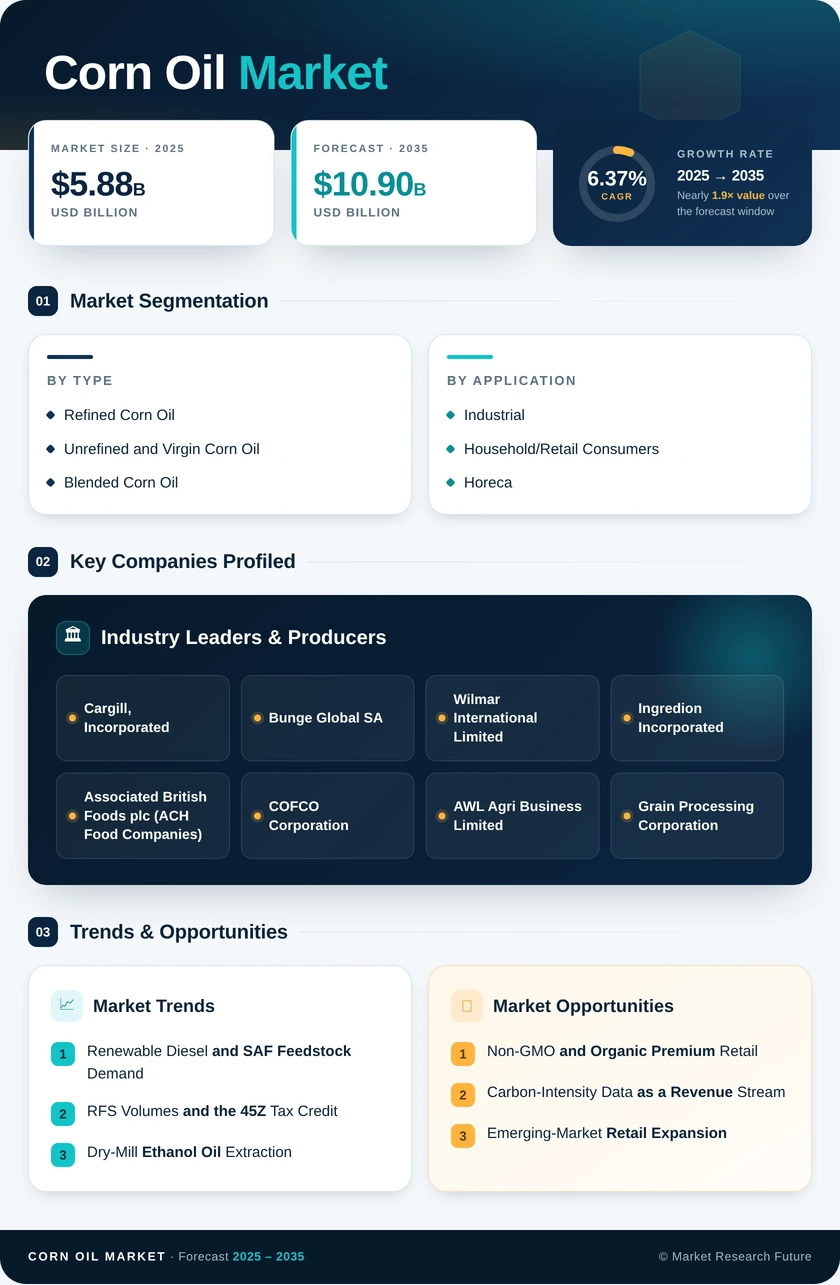
Corn Oil Market (2026 - 2035)

ID: MRFR/FnB/10387-HCR 128 Pages Snehal Singh Last Updated: October 01, 2026
Corn Oil Market Size, Share, Industry Trend & Analysis Research Report Information By Product Grade (Refined Corn Oil, Unrefined and Virgin Corn Oil, Blended Corn Oil), By End User (Industrial, Household/Retail Consumers, Horeca), By Region (North America, Europe, Asia-Pacific, South America, Middle East and Africa) – Forecast Till 2035
Corn Oil Market
Market Size
Forecast Period2026-2035
CAGR (2026-2035)6.37%
2025 Market SizeUSD 5.88 Billion
2035 Market SizeUSD 10.90 Billion
Key Players
Cargill
Incorporated
Bunge Global SA
Wilmar International Limited
Ingredion Incorporated
Associated British Foods plc
Opportunities
  • Non-GMO and Organic Premium Retail
  • Carbon-Intensity Data as a Revenue Stream
  • Emerging-Market Retail Expansion
  1. 1 Market Summary | |
  2. 2 Key Report Takeaways | |
    1. 2.1 By Product Grade | |
    2. 2.2 By End User | |
    3. 2.3 By Region | |
  3. 3 Market Size and Forecast (2021–2035) | |
    1. 3.1 Historical Market Size (2021–2024) | |
    2. 3.2 Base Year and Forecast Market Size (2025–2035) | |
    3. 3.3 Year-over-Year Growth Analysis | |
  4. 4 Driver Impact Analysis | |
    1. 4.1 Renewable Diesel and SAF Feedstock Demand | |
    2. 4.2 RFS Volumes and the 45Z Tax Credit | |
    3. 4.3 Dry-Mill Ethanol Oil Extraction | |
    4. 4.4 Trans-Fat Elimination Mandates | |
    5. 4.5 Asia-Pacific Foodservice Growth | |
    6. 4.6 Heart-Health Label Positioning | |
    7. 4.7 Brazil Corn Ethanol Expansion | |
  5. 5 Restraints Impact Analysis | |
    1. 5.1 Corn and Competing Oil Price Volatility | |
    2. 5.2 Food-Versus-Fuel Supply Competition | |
    3. 5.3 Omega-6 Health Perception | |
    4. 5.4 GMO Perception and Non-GMO Sourcing Costs | |
    5. 5.5 Biofuel Policy Uncertainty | |
  6. 6 Opportunities | |
    1. 6.1 Non-GMO and Organic Premium Retail | |
    2. 6.2 Carbon-Intensity Data as a Revenue Stream | |
    3. 6.3 Emerging-Market Retail Expansion | |
    4. 6.4 Engineered Frying Blends for Quick-Service Chains | |
    5. 6.5 Pharmaceutical and Cosmetic Grades | |
  7. 7 Regional Market Share and Country-Level Analysis | |
    1. 7.1 North America | | |
      1. 7.1.1 US | | |
      2. 7.1.2 Canada | | |
      3. 7.1.3 Mexico | |
    2. 7.2 Europe | | |
      1. 7.2.1 Germany | | |
      2. 7.2.2 UK | | |
      3. 7.2.3 France | | |
      4. 7.2.4 Italy | | |
      5. 7.2.5 Spain | | |
      6. 7.2.6 Nordic Countries | | |
      7. 7.2.7 Russia | | |
      8. 7.2.8 Rest of Europe | |
    3. 7.3 Asia-Pacific | | |
      1. 7.3.1 China | | |
      2. 7.3.2 India | | |
      3. 7.3.3 Japan | | |
      4. 7.3.4 South Korea | | |
      5. 7.3.5 ASEAN | | |
      6. 7.3.6 Rest of Asia-Pacific | |
    4. 7.4 South America | | |
      1. 7.4.1 Brazil | | |
      2. 7.4.2 Argentina | | |
      3. 7.4.3 Rest of South America | |
    5. 7.5 Middle East and Africa | | |
      1. 7.5.1 Saudi Arabia | | |
      2. 7.5.2 UAE | | |
      3. 7.5.3 South Africa | | |
      4. 7.5.4 Egypt | | |
      5. 7.5.5 Rest of MEA | |
  8. 8 Future Outlook (2026–2035) | |
    1. 8.1 Low-Carbon Fuel Feedstock Supercycle | |
    2. 8.2 Health-Led Reformulation and Clean Label | |
    3. 8.3 Digital Traceability and AI-Driven Procurement | |
    4. 8.4 ESG and Carbon-Intensity Reporting | |
  9. 9 Segmentation Analysis | |
    1. 9.1 By Product Grade | | |
      1. 9.1.1 Refined Corn Oil | | |
      2. 9.1.2 Unrefined and Virgin Corn Oil | | |
      3. 9.1.3 Blended Corn Oil | |
    2. 9.2 By End User | | |
      1. 9.2.1 Industrial | | |
      2. 9.2.2 Household/Retail Consumers | | |
      3. 9.2.3 Horeca | |
  10. 10 Competitive Landscape | |
    1. 10.1 Market Concentration Analysis | |
    2. 10.2 Competitive Benchmarking Matrix | |
    3. 10.3 Company Profiles | | |
      1. 10.3.1 Archer Daniels Midland Company | | |
      2. 10.3.2 Cargill, Incorporated | | |
      3. 10.3.3 Bunge Global SA | | |
      4. 10.3.4 Wilmar International Limited | | |
      5. 10.3.5 Ingredion Incorporated | | |
      6. 10.3.6 Associated British Foods plc (ACH Food Companies) | | |
      7. 10.3.7 COFCO Corporation | | |
      8. 10.3.8 AWL Agri Business Limited | | |
      9. 10.3.9 Louis Dreyfus Company | | |
      10. 10.3.10 Grain Processing Corporation | |
  11. 11 Recent News & Developments | |
  12. 12 Report Scope and Methodology | |
  13. 13 Detailed Sources and Citations | |
  14. 14 Frequently Asked Questions (FAQs) | | LIST OF TABLES | |
  15. TABLE 1 Global Market Size & Forecast, by Revenue (USD Billion), 2021–2035 | |
  16. TABLE 2 Global Market – Year-over-Year Growth Analysis, 2021–2035 | |
  17. TABLE 3 Driver Impact Analysis on CAGR, 2026–2035 | |
  18. TABLE 4 Restraints Impact Analysis on CAGR, 2026–2035 | |
  19. TABLE 5 Global Market Summary, by Region, 2025 | |
  20. TABLE 6 North America Market, by Country, 2025 | |
  21. TABLE 7 Europe Market, by Country, 2025 | |
  22. TABLE 8 Asia-Pacific Market, by Country, 2025 | |
  23. TABLE 9 South America Market, by Country, 2025 | |
  24. TABLE 10 Middle East and Africa Market, by Country, 2025 | |
  25. TABLE 11 Global Market, by Product Grade, 2025–2035 | |
  26. TABLE 12 Global Market, by End User, 2025–2035 | |
  27. TABLE 13 Competitive Benchmarking Matrix, 2025 | |
  28. TABLE 14 Report Scope and Methodology | |
  29. TABLE 15 Detailed Sources and Citations | | LIST OF FIGURES | |
  30. FIGURE 1 Market Dynamics Overview – Drivers, Restraints, Opportunities | |
  31. FIGURE 2 Industry Value Chain Analysis | |
  32. FIGURE 3 Porter's Five Forces Analysis | |
  33. FIGURE 4 Global Market Size Trend, 2021–2035 (USD Billion) | |
  34. FIGURE 5 Market Share by Product Grade, 2025 (%) | |
  35. FIGURE 6 Market Share by End User, 2025 (%) | |
  36. FIGURE 7 Market Share by Region, 2025 (%) | |
  37. FIGURE 8 North America Market Share by Country, 2025 (%) | |
  38. FIGURE 9 Europe Market Share by Country, 2025 (%) | |
  39. FIGURE 10 Asia-Pacific Market Share by Country, 2025 (%) | |
  40. FIGURE 11 South America Market Share by Country, 2025 (%) | |
  41. FIGURE 12 Middle East and Africa Market Share by Country, 2025 (%) | |
  42. FIGURE 13 Competitive Landscape – Company Revenue Share Ranges, 2025

Segmentation Quick Reference

DimensionSub-SegmentsDominant SegmentFastest Growing Segment
By Product GradeRefined Corn Oil; Unrefined and Virgin Corn Oil; Blended Corn OilRefined Corn Oil (66.5% share)Blended Corn Oil (7.55% CAGR)
By End UserIndustrial; Household/Retail Consumers; HorecaIndustrial (51.6% share)Horeca (8.40% CAGR)
By RegionNorth America; Europe; Asia-Pacific; South America; Middle East and AfricaNorth America (38.4% share)Asia-Pacific (7.9% CAGR)


Market Segmentation Overview

By Product Grade

Sub-SegmentKey Trend
Refined Corn OilIndustrial frying and retail bottling standard due to high smoke point and neutral flavor
Unrefined and Virgin Corn OilPremium niche built on nutrient retention and minimal processing
Blended Corn OilEngineered fatty-acid profiles for longer fry life at controlled cost


Refined Corn Oil leads with a 66.5% share because refining delivers the smoke point, clarity, and shelf stability that industrial fryers and bottlers require. Blended Corn Oil grows fastest at a 7.55% CAGR as processors combine corn oil with other plant oils to improve oxidative stability for quick-service applications. Unrefined and Virgin Corn Oil remains a smaller premium grade, constrained by lower smoke points and stronger flavor.

By End User

Sub-SegmentKey Trend
IndustrialRenewable diesel, biodiesel, feed, and processed-food demand
Household/Retail ConsumersValue pricing and heart-health claims on packaging
HorecaReplacement of partially hydrogenated oils with blended frying formulations


Industrial buyers hold a 51.6% share, anchored by renewable diesel refiners seeking low carbon-intensity feedstock under the RFS and 45Z credit. Horeca expands fastest at an 8.40% CAGR as quick-service chains adopt blends that extend fryer life and reduce oil-change labor. Household/Retail Consumers provide a steady base, supported by competitive shelf pricing and the FDA-qualified health claim.


 

Download PDF ×

We do not share your information with anyone. However, we may send you emails based on your report interest from time to time. You may contact us at any time to opt-out.