Life Sciences Market Segmentation
Life Sciences By Application (USD Million, 2025-2035)
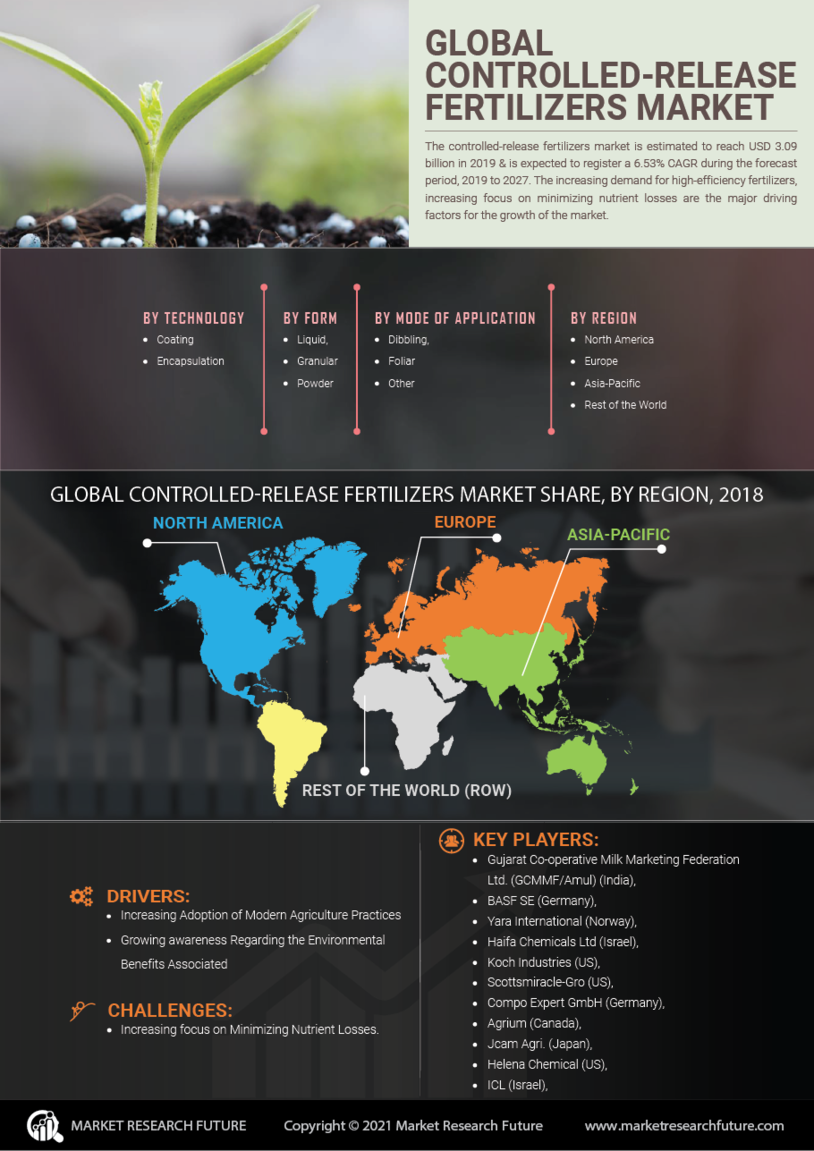
- Controlled Release Fertilizers
- Horticulture
- Turf Management
- Forestry
Life Sciences By Formulation Type (USD Million, 2025-2035)
- Coated Fertilizers
- Encapsulated Fertilizers
- Slow Release Fertilizers
- Controlled Release Granules
Life Sciences By Nutrient Type (USD Million, 2025-2035)
- Nitrogen
- Phosphorus
- Potassium
- Micronutrients
Life Sciences By Distribution Channel (USD Million, 2025-2035)
- Online Sales
- Retail Stores
- Agricultural Cooperatives
- Direct Sales
Life Sciences By End User (USD Million, 2025-2035)
- Farmers
- Commercial Growers
- Landscapers
- Government Agencies