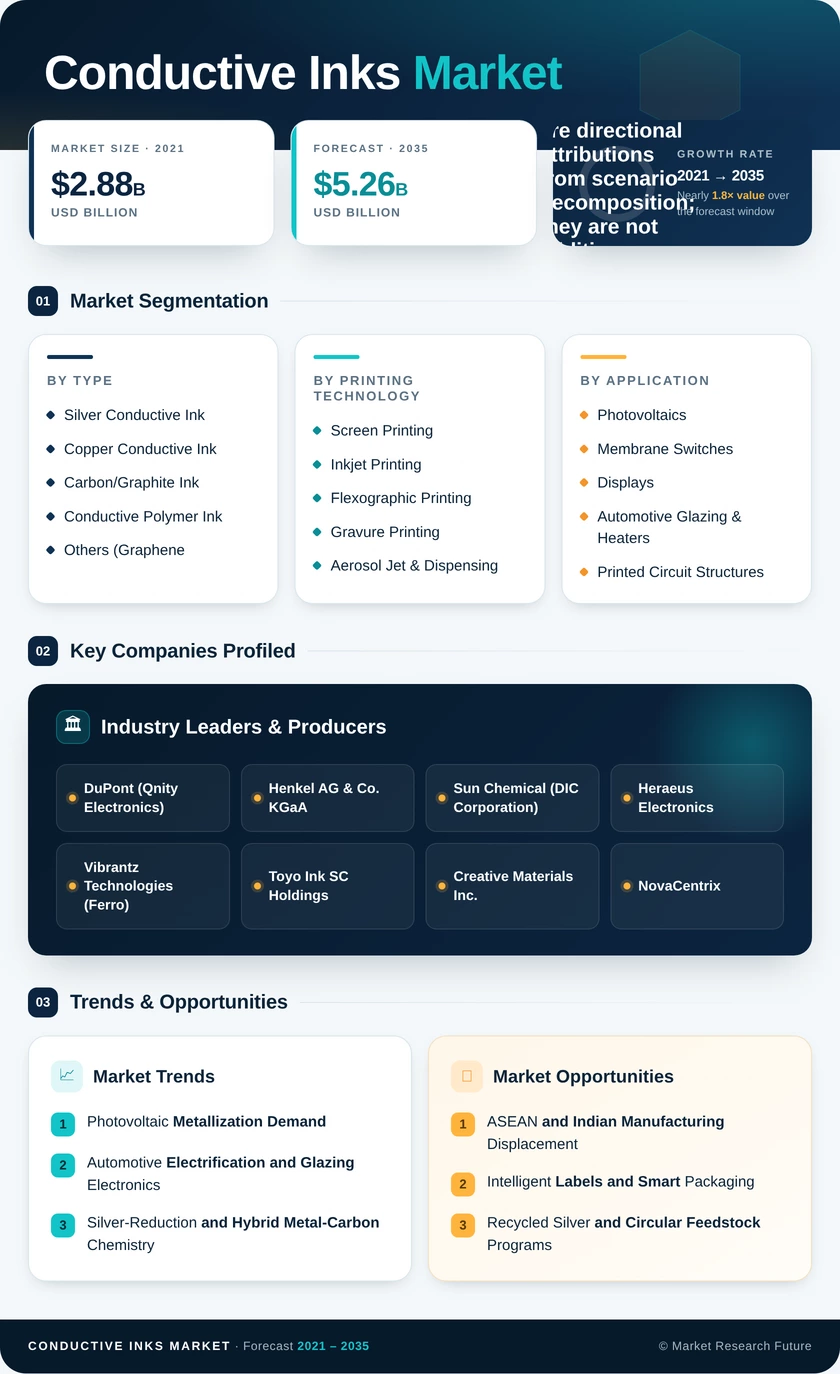
Conductive Inks Market (2026 - 2035)

ID: MRFR/CnM/1371-HCR 111 Pages Chitranshi Jaiswal Last Updated: October 12, 2026
Conductive Inks Market Research Report Information By Type (Silver Conductive Ink, Copper Conductive Ink, Carbon/Graphite Ink, Conductive Polymer Ink, and Others (Graphene, CNT, Hybrid)), By Printing Technology (Screen Printing, Inkjet Printing, Flexographic Printing, Gravure Printing, and Aerosol Jet & Dispensing), By Application (Photovoltaics, Membrane Switches, Displays, Automotive Glazing & Heaters, Printed Circuit Structures, Biosensors & Medical, and Others), and By End-Use Industry (Energy & Solar, Electronics & Electrical, Automotive, Healthcare, Aerospace & Defense, and Consumer Goods & Packaging) – Forecast Till 2035
Conductive Inks Market
Market Size
Forecast Period2026-2035
CAGR (2026-2035)4.2%
2025 Market SizeUSD 3.48 Billion
2035 Market SizeUSD 5.26 Billion
Key Players
DuPont
Henkel AG & Co. KGaA
Sun Chemical
Heraeus Electronics
Vibrantz Technologies
Toyo Ink SC Holdings
Opportunities
  • ASEAN and Indian Manufacturing Displacement
  • Intelligent Labels and Smart Packaging
  • Recycled Silver and Circular Feedstock Programs
  1. 1 Market Overview | |
    1. 1.1 Study Assumptions & Market Definition | |
    2. 1.2 Scope of the Study | |
    3. 1.3 Research Methodology | |
  2. 2 Market Summary & Key Takeaways | |
    1. 2.1 Key Findings by Type | |
    2. 2.2 Key Findings by Application | |
    3. 2.3 Key Findings by Region | |
  3. 3 Market Size & Forecast (2021–2035) | |
    1. 3.1 Historical Market Size (2021–2025) | |
    2. 3.2 Current & Forecast Market Size (2026–2035) | |
    3. 3.3 Market Size by Revenue (USD Billion) | |
    4. 3.4 Year-over-Year Growth Analysis | |
  4. 4 Market Drivers Analysis | |
    1. 4.1 Photovoltaic Metallization Demand | |
    2. 4.2 Automotive Electrification and Glazing Electronics | |
    3. 4.3 Silver-Reduction and Hybrid Metal-Carbon Chemistry | |
    4. 4.4 Low-Temperature Curing on Polymer Substrates | |
    5. 4.5 RFID Antenna and Item-Level Tagging Expansion | |
    6. 4.6 Medical Wearables and Diagnostic Strip Volume | |
    7. 4.7 Electronics Manufacturing Incentive Programs | |
  5. 5 Market Restraints Analysis | |
    1. 5.1 Silver Price Volatility and Hedging Cost | |
    2. 5.2 Copper Oxidation and Shelf-Life Limitations | |
    3. 5.3 Substrate Adhesion and Flex-Fatigue Failures | |
    4. 5.4 Long Qualification Cycles in Automotive and Medical | |
    5. 5.5 Solvent and Heavy-Metal Regulatory Tightening | |
  6. 6 Market Opportunity Analysis | |
    1. 6.1 ASEAN and Indian Manufacturing Displacement | |
    2. 6.2 Intelligent Labels and Packaging Integration | |
    3. 6.3 Recycled Silver and Circular Feedstock Programs | |
    4. 6.4 Formulation Data Monetization and Co-Development Models | |
    5. 6.5 Printed Diagnostics Beyond Glucose | |
    6. 6.6 Industry Value Chain Analysis | |
    7. 6.7 Porter's Five Forces Analysis | |
  7. 7 Regional Analysis | |
    1. 7.1 North America | | |
      1. 7.1.1 US | | |
      2. 7.1.2 Canada | | |
      3. 7.1.3 Mexico | |
    2. 7.2 Europe | | |
      1. 7.2.1 Germany | | |
      2. 7.2.2 UK | | |
      3. 7.2.3 France | | |
      4. 7.2.4 Italy | | |
      5. 7.2.5 Spain | | |
      6. 7.2.6 Nordic Countries | | |
      7. 7.2.7 Russia | | |
      8. 7.2.8 Rest of Europe | |
    3. 7.3 Asia-Pacific | | |
      1. 7.3.1 China | | |
      2. 7.3.2 India | | |
      3. 7.3.3 Japan | | |
      4. 7.3.4 South Korea | | |
      5. 7.3.5 ASEAN | | |
      6. 7.3.6 Rest of Asia-Pacific | |
    4. 7.4 South America | | |
      1. 7.4.1 Brazil | | |
      2. 7.4.2 Argentina | | |
      3. 7.4.3 Rest of South America | |
    5. 7.5 Middle East & Africa | | |
      1. 7.5.1 Saudi Arabia | | |
      2. 7.5.2 UAE | | |
      3. 7.5.3 South Africa | | |
      4. 7.5.4 Egypt | | |
      5. 7.5.5 Rest of MEA | |
  8. 8 Future Outlook (2026–2035) | |
    1. 8.1 The Solar Metallization Balancing Act | |
    2. 8.2 Materials Informatics and AI-Driven Formulation | |
    3. 8.3 Co-Development Economics with Equipment Makers | |
    4. 8.4 Circularity, Scope 3 Disclosure, and Silver Provenance | |
  9. 9 Segmentation Analysis | |
    1. 9.1 By Type | | |
      1. 9.1.1 Silver Conductive Ink | | |
      2. 9.1.2 Copper Conductive Ink | | |
      3. 9.1.3 Carbon/Graphite Ink | | |
      4. 9.1.4 Conductive Polymer Ink | | |
      5. 9.1.5 Others (Graphene, CNT, Hybrid) | |
    2. 9.2 By Printing Technology | | |
      1. 9.2.1 Screen Printing | | |
      2. 9.2.2 Inkjet Printing | | |
      3. 9.2.3 Flexographic Printing | | |
      4. 9.2.4 Gravure Printing | | |
      5. 9.2.5 Aerosol Jet & Dispensing | |
    3. 9.3 By Application | | |
      1. 9.3.1 Photovoltaics | | |
      2. 9.3.2 Membrane Switches | | |
      3. 9.3.3 Displays | | |
      4. 9.3.4 Automotive Glazing & Heaters | | |
      5. 9.3.5 Printed Circuit Structures | | |
      6. 9.3.6 Biosensors & Medical | | |
      7. 9.3.7 Others | |
    4. 9.4 By End-Use Industry | | |
      1. 9.4.1 Energy & Solar | | |
      2. 9.4.2 Electronics & Electrical | | |
      3. 9.4.3 Automotive | | |
      4. 9.4.4 Healthcare | | |
      5. 9.4.5 Aerospace & Defense | | |
      6. 9.4.6 Consumer Goods & Packaging | |
  10. 10 Competitive Landscape | |
    1. 10.1 Market Share Analysis (2026) | |
    2. 10.2 Competitive Benchmarking Matrix | |
    3. 10.3 Company Profiles | | |
      1. 10.3.1 DuPont (Qnity Electronics) | | |
      2. 10.3.2 Henkel AG & Co. KGaA | | |
      3. 10.3.3 Sun Chemical (DIC Corporation) | | |
      4. 10.3.4 Heraeus Electronics | | |
      5. 10.3.5 Vibrantz Technologies | | |
      6. 10.3.6 Toyo Ink SC Holdings | | |
      7. 10.3.7 Creative Materials Inc. | | |
      8. 10.3.8 NovaCentrix | | |
      9. 10.3.9 Nano Dimension | | |
      10. 10.3.10 Haydale Graphene Industries | | |
      11. 10.3.11 Applied Ink Solutions | |
  11. 11 Recent Developments & News | |
  12. 12 Report Scope & Methodology | |
    1. 12.1 Study Period & Base Year | |
    2. 12.2 Data Sources & Citations | |
    3. 12.3 Abbreviations | |
  13. 13 Detailed Sources and Citations | |
  14. 14 Frequently Asked Questions (FAQs) | | LIST OF TABLES | |
  15. TABLE 1 Global Conductive Inks Market Size & Forecast, by Revenue (USD Billion), 2021–2035 | |
  16. TABLE 2 Global Conductive Inks Market – Year-over-Year Growth Analysis, 2021–2035 | |
  17. TABLE 3 Driver Impact Analysis – Global Conductive Inks Market, 2026–2035 | |
  18. TABLE 4 Restraint Impact Analysis – Global Conductive Inks Market, 2026–2035 | |
  19. TABLE 5 Global Conductive Inks Market Size, by Region, 2021–2035 (USD Billion) | |
  20. TABLE 6 North America Conductive Inks Market Size, by Country, 2021–2035 (USD Billion) | |
  21. TABLE 7 Europe Conductive Inks Market Size, by Country, 2021–2035 (USD Billion) | |
  22. TABLE 8 Asia-Pacific Conductive Inks Market Size, by Country, 2021–2035 (USD Billion) | |
  23. TABLE 9 South America Conductive Inks Market Size, by Country, 2021–2035 (USD Billion) | |
  24. TABLE 10 Middle East & Africa Conductive Inks Market Size, by Country, 2021–2035 (USD Billion) | |
  25. TABLE 11 Global Conductive Inks Market Size, by Type, 2021–2035 (USD Billion) | |
  26. TABLE 12 Global Conductive Inks Market Size, by Printing Technology, 2021–2035 (USD Billion) | |
  27. TABLE 13 Global Conductive Inks Market Size, by Application, 2021–2035 (USD Billion) | |
  28. TABLE 14 Global Conductive Inks Market Size, by End-Use Industry, 2021–2035 (USD Billion) | |
  29. TABLE 15 North America Conductive Inks Market Size, by Type, 2021–2035 (USD Billion) | |
  30. TABLE 16 North America Conductive Inks Market Size, by Application, 2021–2035 (USD Billion) | |
  31. TABLE 17 Europe Conductive Inks Market Size, by Type, 2021–2035 (USD Billion) | |
  32. TABLE 18 Europe Conductive Inks Market Size, by Application, 2021–2035 (USD Billion) | |
  33. TABLE 19 Asia-Pacific Conductive Inks Market Size, by Type, 2021–2035 (USD Billion) | |
  34. TABLE 20 Asia-Pacific Conductive Inks Market Size, by Application, 2021–2035 (USD Billion) | |
  35. TABLE 21 South America Conductive Inks Market Size, by Type, 2021–2035 (USD Billion) | |
  36. TABLE 22 Middle East & Africa Conductive Inks Market Size, by Type, 2021–2035 (USD Billion) | |
  37. TABLE 23 Competitive Benchmarking Matrix – Global Conductive Inks Market, 2026 | |
  38. TABLE 24 Company Profiles – Key Players, Global Conductive Inks Market | |
  39. TABLE 25 Recent Developments & Strategic Announcements, 2023–2025 | |
  40. TABLE 26 Report Scope & Methodology Summary | |
  41. TABLE 27 Detailed Sources and Citations Index | | LIST OF FIGURES | |
  42. FIGURE 1 Market Dynamics Overview – Drivers, Restraints, and Opportunities | |
  43. FIGURE 2 Industry Value Chain Analysis – Precursor Powder to Printed Device | |
  44. FIGURE 3 Porter's Five Forces Analysis – Global Conductive Inks Market | |
  45. FIGURE 4 Global Market Size Trend and Forecast, 2021–2035 (USD Billion) | |
  46. FIGURE 5 Year-over-Year Growth Rate Trend, 2022–2035 (%) | |
  47. FIGURE 6 Market Share by Type, 2025 vs 2035 (%) | |
  48. FIGURE 7 Market Share by Printing Technology, 2025 (%) | |
  49. FIGURE 8 Market Share by Application, 2025 vs 2035 (%) | |
  50. FIGURE 9 Market Share by End-Use Industry, 2025 (%) | |
  51. FIGURE 10 Regional Market Share Distribution, 2025 (%) | |
  52. FIGURE 11 Regional CAGR Comparison, 2026–2035 (%) | |
  53. FIGURE 12 Asia-Pacific Country-Level Share Breakdown, 2025 (%) | |
  54. FIGURE 13 Europe Country-Level Share Breakdown, 2025 (%) | |
  55. FIGURE 14 Competitive Landscape – Estimated Revenue Share Positioning, 2026 | |
  56. FIGURE 15 Silver Loading Intensity vs Installed PV Capacity, 2021–2035 | |
  57. FIGURE 16 Strategic Positioning Matrix – Innovation Depth vs Global Service Reach

Segmentation Quick Reference

DimensionSub-SegmentsDominant SegmentFastest Growing Segment
By TypeSilver Conductive Ink; Copper Conductive Ink; Carbon/Graphite Ink; Conductive Polymer Ink; Others (Graphene, CNT, Hybrid)Silver Conductive InkCopper Conductive Ink
By Printing TechnologyScreen Printing; Inkjet Printing; Flexographic Printing; Gravure Printing; Aerosol Jet & DispensingScreen PrintingInkjet Printing
By ApplicationPhotovoltaics; Membrane Switches; Displays; Automotive Glazing & Heaters; Printed Circuit Structures; Biosensors & Medical; OthersPhotovoltaicsBiosensors & Medical
By End-Use IndustryEnergy & Solar; Electronics & Electrical; Automotive; Healthcare; Aerospace & Defense; Consumer Goods & PackagingEnergy & SolarAutomotive
By RegionNorth America; Europe; Asia-Pacific; South America; Middle East & AfricaAsia-PacificAsia-Pacific


Market Segmentation Overview

By Type

Sub-SegmentKey Trend
Silver Conductive InkPer-watt loading falling roughly 6% annually as thrifting continues across cell architectures
Copper Conductive InkEncapsulation and inert-atmosphere curing extend usable shelf life, unlocking substitution
Carbon/Graphite InkStable demand in electrodes and switches where inertness outranks absolute conductivity
Conductive Polymer InkGrowth concentrated in transparent, antistatic, and low-current sensing layers
Others (Graphene, CNT, Hybrid)Plasma-functionalized carbon additives reduce metal loading without resistance penalty


Material chemistry remains the primary axis of competition. Silver's dominance is being eroded at the margin rather than displaced outright, and hybrid systems that blend metal with functionalized carbon represent the most active formulation frontier heading into 2030.

By Printing Technology

Sub-SegmentKey Trend
Screen PrintingFiner mesh and knotless screens push line widths below 25 microns on production lines
Inkjet PrintingDigital patterning removes tooling cost for short runs and rapid design iteration
Flexographic PrintingConverters adopt inline conductive layers using existing web presses with cure retrofits
Gravure PrintingHigh-throughput continuous patterning for large-area, repeat-geometry applications
Aerosol Jet & DispensingConformal deposition on non-planar geometries for advanced packaging interconnects


Deposition method determines viable formulation windows more than end application does. Screen printing retains volume leadership because thick-film deposition remains unmatched for sheet resistance, while digital methods grow fastest from a modest base.

By Application

Sub-SegmentKey Trend
PhotovoltaicsVolume growth partially offset by declining silver intensity per cell
Membrane SwitchesMature, price-competitive segment tied to appliance and industrial control output
DisplaysTouch sensor and bezel circuitry migrating toward finer printed geometries
Automotive Glazing & HeatersElectrification shifts thermal management from engine heat to printed resistive grids
Printed Circuit StructuresAdditive interconnect adoption reduces etch waste and process step count
Biosensors & MedicalRegulatory qualification creates durable, high-margin supply positions
OthersEMI shielding, heating elements, and intelligent label constructions


Application mix explains the divergence between volume and value trends. Solar drives tonnage while medical and automotive drive margin, and suppliers increasingly manage portfolios to balance the two rather than optimizing for either alone.

By End-Use Industry

Sub-SegmentKey Trend
Energy & SolarLargest revenue block; pricing indexed transparently to metal benchmarks
Electronics & ElectricalBroad, diversified demand across display, component, and assembly operations
AutomotiveContent per vehicle rising with electrification and in-cabin sensing density
HealthcareHighest margin pool; qualification barriers protect incumbent positions
Aerospace & DefensePrinted conductors replacing copper harnessing to reduce airframe mass
Consumer Goods & PackagingLargest addressable substrate area; adoption gated by cure infrastructure


End-use concentration in energy exposes suppliers to solar capex cycles. Diversification into healthcare, automotive, and aerospace is the central portfolio strategy among leading formulators through the forecast decade.




Download PDF ×

We do not share your information with anyone. However, we may send you emails based on your report interest from time to time. You may contact us at any time to opt-out.