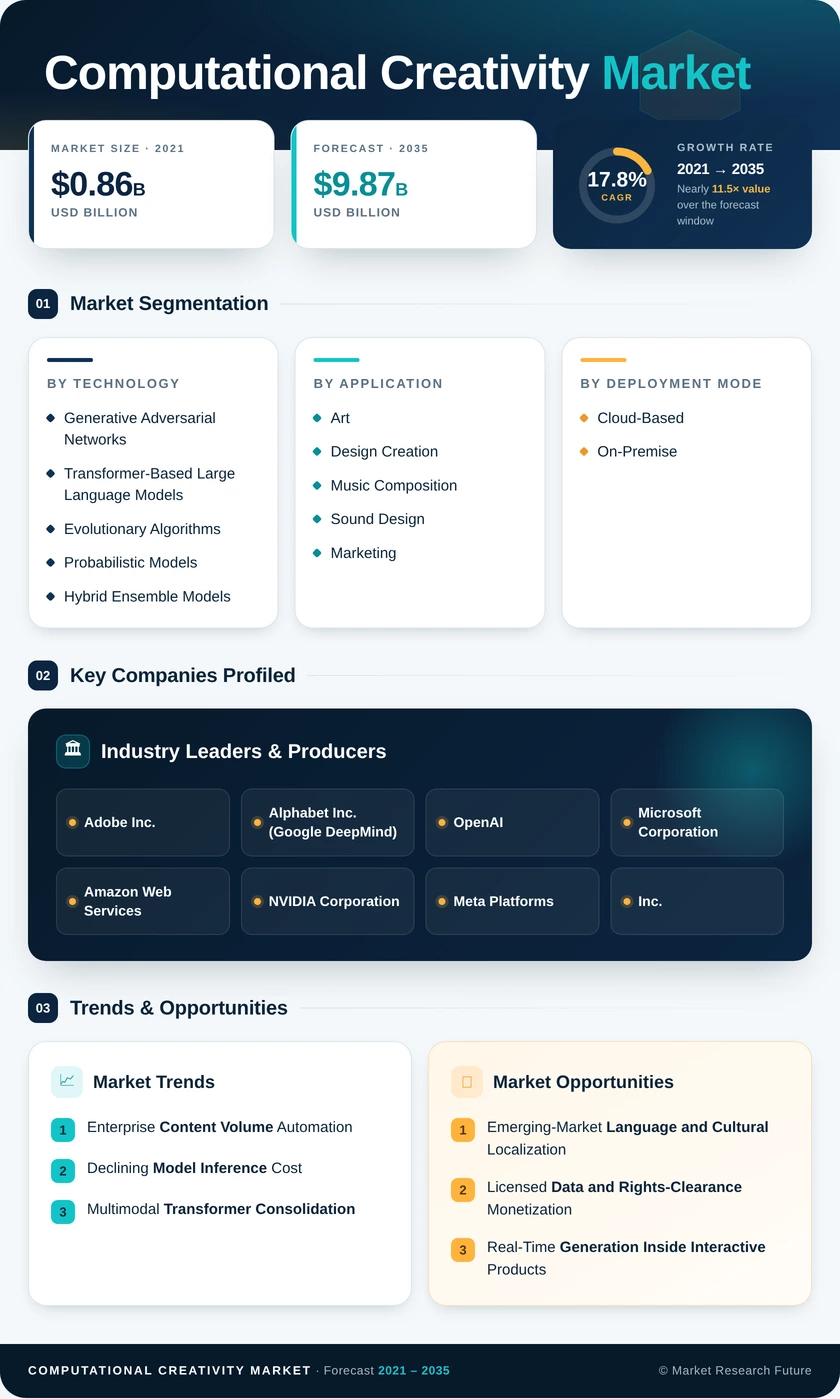
Computational Creativity Market (2026 – 2035)

ID: MRFR/ICT/8926-HCR 141 Pages Ankit Gupta Last Updated: September 22, 2026
Computational Creativity Market Size, Share and Research Report By Technology (Generative Adversarial Networks, Transformer-Based Large Language Models, Evolutionary Algorithms, Probabilistic Models, and Hybrid Ensemble Models), By Application (Art and Design Creation, Music Composition and Sound Design, Marketing and Advertising Content, Gaming and Virtual World Building, Industrial Design and Engineering, and Scriptwriting and Storytelling), By Deployment Mode (Cloud-Based and On-Premise), By End-User Industry (Media and Entertainment Companies, Gaming Studios and Publishers, Marketing and Advertising Agencies, Automotive and Industrial Designers, Education and EdTech Providers, and Research Institutes) – Industry Forecast Till 2035
Computational Creativity Market
Market Size
Forecast Period2026-2035
CAGR (2026-2035)17.8%
2025 Market SizeUSD 1.92 Billion
2035 Market SizeUSD 9.87 Billion
Key Players
Adobe Inc.
Alphabet Inc.
OpenAI
Microsoft Corporation
Amazon Web Services
NVIDIA Corporation
Opportunities
  • Emerging-Market Language and Cultural Localization
  • Licensed Data and Rights-Clearance Monetization
  • Real-Time Generation Inside Interactive Products
  1. 1 Market Summary | |
    1. 1.1 Study Assumptions & Market Definition | |
    2. 1.2 Scope of the Study | |
    3. 1.3 Research Methodology | |
  2. 2 Key Report Takeaways | |
    1. 2.1 By Technology | |
    2. 2.2 By Application | |
    3. 2.3 By Deployment Mode | |
    4. 2.4 By End-User Industry | |
    5. 2.5 By Region | |
  3. 3 Market Size and Forecast (2021–2035) | |
    1. 3.1 Historical Market Size (2021–2025) | |
    2. 3.2 Current & Forecast Market Size (2026–2035) | |
    3. 3.3 Market Size by Revenue (USD Billion) | |
    4. 3.4 Year-over-Year Growth Analysis | |
  4. 4 Driver Impact Analysis | |
    1. 4.1 Enterprise Content Volume Automation | |
    2. 4.2 Declining Model Inference Cost | |
    3. 4.3 Multimodal Transformer Consolidation | |
    4. 4.4 Creative-Suite Plug-In Distribution | |
    5. 4.5 Procedural Generation in Interactive Media | |
    6. 4.6 Provenance and Licensed-Data Compliance | |
    7. 4.7 National Compute and AI Funding Programs | |
  5. 5 Restraints Impact Analysis | |
    1. 5.1 Copyright and Training-Data Litigation | |
    2. 5.2 Accelerator Supply and Capital Cost | |
    3. 5.3 Creative-Labor Agreements and Resistance | |
    4. 5.4 Output Inconsistency and Review Overhead | |
    5. 5.5 Fragmented Cross-Border Data Governance | |
  6. 6 Opportunities | |
    1. 6.1 Emerging-Market Language and Cultural Localization | |
    2. 6.2 Licensed Data and Rights-Clearance Monetization | |
    3. 6.3 Real-Time Generation Inside Interactive Products | |
    4. 6.4 Provenance and Compliance as a Product | |
    5. 6.5 Vertical Copilots for Industrial and Architectural Design | |
  7. 7 Regional Market Share and Country-Level Analysis | |
    1. 7.1 North America | | |
      1. 7.1.1 US | | |
      2. 7.1.2 Canada | | |
      3. 7.1.3 Mexico | |
    2. 7.2 Europe | | |
      1. 7.2.1 Germany | | |
      2. 7.2.2 UK | | |
      3. 7.2.3 France | | |
      4. 7.2.4 Italy | | |
      5. 7.2.5 Spain | | |
      6. 7.2.6 Nordic Countries | | |
      7. 7.2.7 Russia | | |
      8. 7.2.8 Rest of Europe | |
    3. 7.3 Asia-Pacific | | |
      1. 7.3.1 China | | |
      2. 7.3.2 India | | |
      3. 7.3.3 Japan | | |
      4. 7.3.4 South Korea | | |
      5. 7.3.5 ASEAN | | |
      6. 7.3.6 Rest of Asia-Pacific | |
    4. 7.4 South America | | |
      1. 7.4.1 Brazil | | |
      2. 7.4.2 Argentina | | |
      3. 7.4.3 Rest of South America | |
    5. 7.5 Middle East & Africa | | |
      1. 7.5.1 Saudi Arabia | | |
      2. 7.5.2 UAE | | |
      3. 7.5.3 South Africa | | |
      4. 7.5.4 Egypt | | |
      5. 7.5.5 Rest of MEA | |
  8. 8 Future Outlook (2026–2035) | |
    1. 8.1 Autonomous Creative Pipelines | |
    2. 8.2 Platform Economics and Catalog Aggregation | |
    3. 8.3 Compute Efficiency and On-Device Execution | |
    4. 8.4 Provenance, Regulation and Sustainability Disclosure | |
  9. 9 Segmentation Analysis | |
    1. 9.1 By Technology | | |
      1. 9.1.1 Generative Adversarial Networks | | |
      2. 9.1.2 Transformer-Based Large Language Models | | |
      3. 9.1.3 Evolutionary Algorithms | | |
      4. 9.1.4 Probabilistic Models | | |
      5. 9.1.5 Hybrid Ensemble Models | |
    2. 9.2 By Application | | |
      1. 9.2.1 Art and Design Creation | | |
      2. 9.2.2 Music Composition and Sound Design | | |
      3. 9.2.3 Marketing and Advertising Content | | |
      4. 9.2.4 Gaming and Virtual World Building | | |
      5. 9.2.5 Industrial Design and Engineering | | |
      6. 9.2.6 Scriptwriting and Storytelling | |
    3. 9.3 By Deployment Mode | | |
      1. 9.3.1 Cloud-Based | | |
      2. 9.3.2 On-Premise | |
    4. 9.4 By End-User Industry | | |
      1. 9.4.1 Media and Entertainment Companies | | |
      2. 9.4.2 Gaming Studios and Publishers | | |
      3. 9.4.3 Marketing and Advertising Agencies | | |
      4. 9.4.4 Automotive and Industrial Designers | | |
      5. 9.4.5 Education and EdTech Providers | | |
      6. 9.4.6 Research Institutes | |
  10. 10 Competitive Landscape | |
    1. 10.1 Market Share Analysis (2026) | |
    2. 10.2 Competitive Benchmarking Matrix | |
    3. 10.3 Company Profiles | |
  11. 11 Recent News & Developments | |
  12. 12 Report Scope and Methodology | |
  13. 13 Detailed Sources and Citations | |
  14. 14 Frequently Asked Questions (FAQs) | | LIST OF TABLES | |
  15. TABLE 1 Global Computational Creativity Market Size & Forecast, by Revenue (USD Billion), 2021–2035 | |
  16. TABLE 2 Global Computational Creativity Market – Year-over-Year Growth Analysis, 2021–2035 | |
  17. TABLE 3 Driver Impact Analysis Matrix, 2026–2035 | |
  18. TABLE 4 Restraint Impact Analysis Matrix, 2026–2035 | |
  19. TABLE 5 Global Market Size, by Region, 2021–2035 (USD Billion) | |
  20. TABLE 6 North America Market Size, by Country, 2021–2035 (USD Billion) | |
  21. TABLE 7 Europe Market Size, by Country, 2021–2035 (USD Billion) | |
  22. TABLE 8 Asia-Pacific Market Size, by Country, 2021–2035 (USD Billion) | |
  23. TABLE 9 South America Market Size, by Country, 2021–2035 (USD Billion) | |
  24. TABLE 10 Middle East & Africa Market Size, by Country, 2021–2035 (USD Billion) | |
  25. TABLE 11 Global Market Size, by Technology, 2021–2035 (USD Billion) | |
  26. TABLE 12 Global Market Size, by Application, 2021–2035 (USD Billion) | |
  27. TABLE 13 Global Market Size, by Deployment Mode, 2021–2035 (USD Billion) | |
  28. TABLE 14 Global Market Size, by End-User Industry, 2021–2035 (USD Billion) | |
  29. TABLE 15 Competitive Benchmarking Matrix, 2026 | |
  30. TABLE 16 Company Profiles – Key Players | |
  31. TABLE 17 Recent Developments & Strategic Announcements, 2023–2025 | |
  32. TABLE 18 Report Scope & Methodology Summary | |
  33. TABLE 19 Detailed Sources and Citations Index | |
  34. TABLE 20 Segmentation Quick Reference Matrix | | LIST OF FIGURES | |
  35. FIGURE 1 Market Dynamics – Drivers, Restraints and Opportunities | |
  36. FIGURE 2 Industry Value Chain Analysis | |
  37. FIGURE 3 Porter's Five Forces Analysis | |
  38. FIGURE 4 Global Market Size Trend, 2021–2035 (USD Billion) | |
  39. FIGURE 5 Year-over-Year Growth Trajectory, 2022–2035 | |
  40. FIGURE 6 Market Share by Technology, 2025 | |
  41. FIGURE 7 Market Share by Application, 2025 | |
  42. FIGURE 8 Market Share by Deployment Mode, 2025 | |
  43. FIGURE 9 Market Share by End-User Industry, 2025 | |
  44. FIGURE 10 Regional Revenue Share Distribution, 2025 | |
  45. FIGURE 11 Regional CAGR Comparison, 2026–2035 | |
  46. FIGURE 12 North America Country-Level Share Breakdown, 2025 | |
  47. FIGURE 13 Asia-Pacific Country-Level Growth Comparison, 2026–2035 | |
  48. FIGURE 14 Competitive Landscape Positioning Map, 2026 | |
  49. FIGURE 15 Top-Five Vendor Share Concentration, 2025

Segmentation Quick Reference

DimensionSub-SegmentsDominant SegmentFastest Growing Segment
By TechnologyGenerative Adversarial Networks; Transformer-Based Large Language Models; Evolutionary Algorithms; Probabilistic Models; Hybrid Ensemble ModelsGenerative Adversarial Networks (36.7% share, 2025)Transformer-Based Large Language Models (27.2% CAGR)
By ApplicationArt and Design Creation; Music Composition and Sound Design; Marketing and Advertising Content; Gaming and Virtual World Building; Industrial Design and Engineering; Scriptwriting and StorytellingMarketing and Advertising Content (27.4% share, 2025)Gaming and Virtual World Building (22.9% CAGR)
By Deployment ModeCloud-Based; On-PremiseCloud-Based (64.6% share, 2025)On-Premise (18.7% CAGR)
By End-User IndustryMedia and Entertainment Companies; Gaming Studios and Publishers; Marketing and Advertising Agencies; Automotive and Industrial Designers; Education and EdTech Providers; Research InstitutesMedia and Entertainment Companies (31.8% share, 2025)Gaming Studios and Publishers (21.1% CAGR)


Market Segmentation Overview

By Technology

Sub-SegmentKey Trend
Generative Adversarial NetworksEntrenched in production image and video pipelines built pre-2023
Transformer-Based Large Language ModelsConsolidating text, image, audio, and video into single backbones
Evolutionary AlgorithmsPersisting in constrained optimization and digital-twin workloads
Probabilistic ModelsSupporting uncertainty-aware selection among candidate outputs
Hybrid Ensemble ModelsCombining architectures to raise first-pass acceptance rates


Generative Adversarial Networks still hold the largest technology position because studio and agency pipelines were engineered around them, and rebuilding those pipelines carries real switching costs. Transformer-Based Large Language Models grow fastest as buyers consolidate vendor relationships onto multimodal catalogs that handle concepting, editing, and export under consistent prompting semantics. Evolutionary Algorithms remain durable where engineering constraints must be satisfied exactly rather than approximated, and Hybrid Ensemble Models are gaining ground with buyers whose procurement metric is acceptance rate rather than novelty.

By Application

Sub-SegmentKey Trend
Art and Design CreationStyle transfer and vector generation shipped inside design suites
Music Composition and Sound DesignLong-form audio decoders extending beyond short loops
Marketing and Advertising ContentChannel-and-format variant multiplication at flat headcount
Gaming and Virtual World BuildingReal-time procedural asset and environment synthesis
Industrial Design and EngineeringSketch-to-manufacturable geometry and lightweighting
Scriptwriting and StorytellingConfined to pre-visualization pending labor and rights clarity


Marketing and Advertising Content leads application spending because variant production has a defensible cost-per-asset benchmark that procurement teams can audit. Gaming and Virtual World Building expands fastest as generation migrates from authoring tools into shipped runtimes, turning a production expense into a monetizable player feature. Art and Design Creation retains a broad installed base through plug-in distribution, while Scriptwriting and Storytelling stays constrained by collectively bargained consent requirements rather than by model capability.

By Deployment Mode

Sub-SegmentKey Trend
Cloud-BasedMarketplace access to continuously refreshed model catalogs
On-PremiseLatency-sensitive, regulated, and IP-protective workloads


Cloud-Based deployment dominates because model catalogs refresh on monthly cycles and few creative organizations want to own accelerator fleets that depreciate on eighteen-month curves. On-Premise nonetheless grows faster in percentage terms, driven by financial-services video verification, government redaction, and studios protecting unreleased footage from third-party infrastructure. Hybrid arrangements — local inference with cloud-synchronized model updates — are emerging as the practical settlement between security policy and catalog freshness.

By End-User Industry

Sub-SegmentKey Trend
Media and Entertainment CompaniesTrailer assembly, subtitle localization, thumbnail optimization
Gaming Studios and PublishersGeneration embedded directly in player-facing experiences
Marketing and Advertising AgenciesClient campaign variant production on compressed timelines
Automotive and Industrial DesignersAerodynamic and aesthetic iteration in shortened prototype cycles
Education and EdTech ProvidersPrompt-driven adaptive lesson and assessment builders
Research InstitutesExperimental instruments and live human-model creative exchange


Media and Entertainment Companies lead end-user spending because localization and promotional workflows deliver quantifiable savings without touching principal creative decisions. Gaming Studios and Publishers compound fastest by shipping generation inside live-service titles, converting tooling spend into per-user recurring revenue. Automotive and Industrial Designers produce the clearest engineering return per deployment, and Education and EdTech Providers scale quickly from a modest base as institutional procurement frameworks and ethical-use guidelines mature.




Download PDF ×

We do not share your information with anyone. However, we may send you emails based on your report interest from time to time. You may contact us at any time to opt-out.