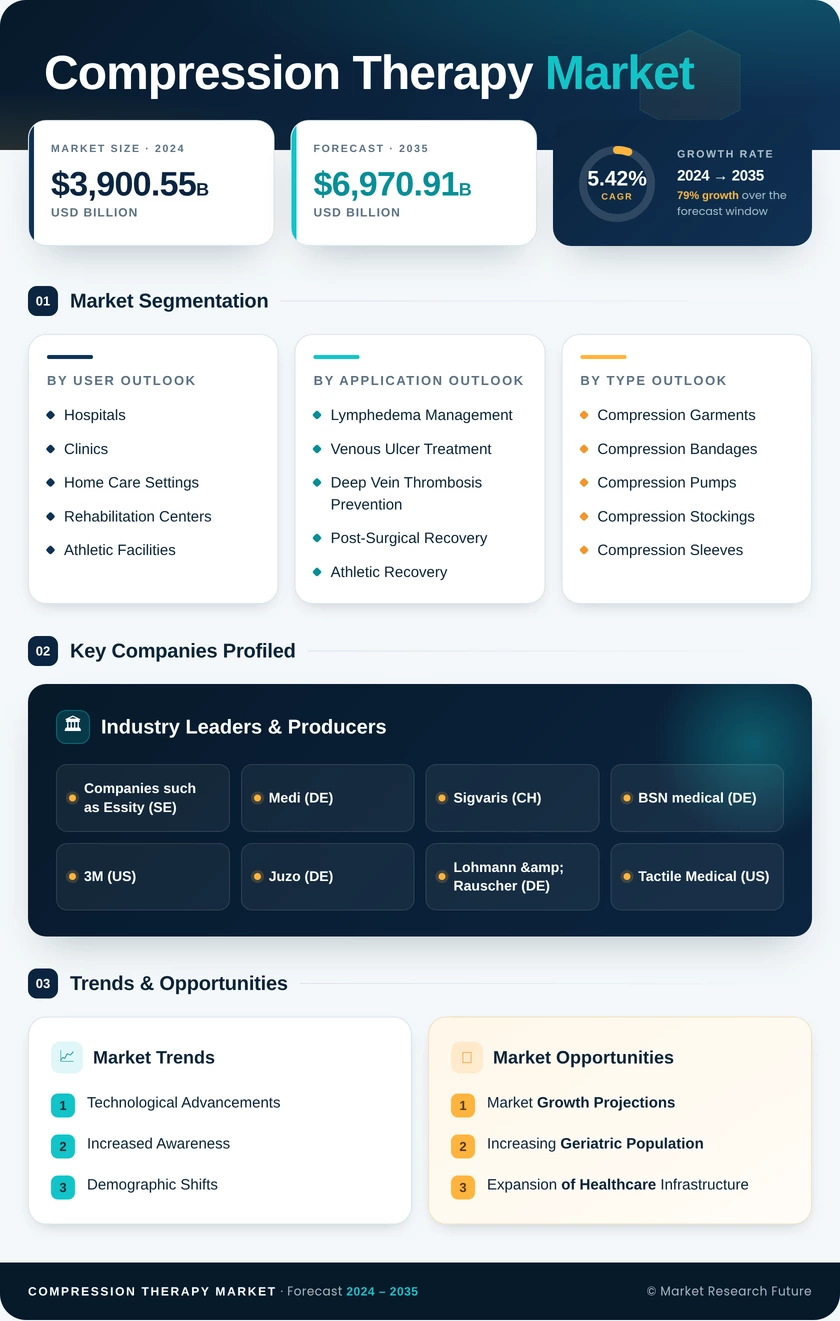
Compression Therapy Market (2026 - 2035)

ID: MRFR/Pharma/5719-HCR 90 Pages Rahul Gotadki Last Updated: September 15, 2026
Compression Therapy Market Research Report: Size, Share, Trend Analysis By Product Type (Compression Garments, Compression Bandages, Compression Pumps, Compression Hosiery), By Applications (Chronic Venous Insufficiency, Lymphedema, Sports Injuries, Post-Surgical Recovery), By End Users (Hospitals, Ambulatory Surgical Centers, Home Care Settings, Rehabilitation Centers), By Distribution Channel (Online Pharmacies, Retail Pharmacies, Hospital Pharmacies, Medical Supply Stores) and By Regional (North America, Europe, South America, Asia Pacific, Middle East and Africa) - Growth Outlook & Industry Forecast 2025 To 2035
Compression Therapy Market
Market Size
Forecast Period2026-2035
CAGR (2026-2035)5.3%
2025 Market SizeUSD 4.61 Billion
2035 Market SizeUSD 7.70 Billion
Key Players
Essity AB (JOBST
BSN Medical)
medi GmbH & Co. KG
SIGVARIS Group
Paul Hartmann AG
3M / Solventum
Opportunities
  • Connected Pressure Verification
  • Emerging-Market Primary Care Entry
  • Recovery and Performance Channels
  1. 1 Market Summary |
    1. 1.1 Study Assumptions & Market Definition |
    2. 1.2 Scope of the Study |
    3. 1.3 Research Methodology
  2. 2 Key Report Takeaways |
    1. 2.1 By Technology |
    2. 2.2 By Sector |
    3. 2.3 By Geography
  3. 3 Market Size & Forecast (2021–2035) |
    1. 3.1 Historical Market Size (2021–2025) |
    2. 3.2 Current & Forecast Market Size (2026–2035) |
    3. 3.3 Year-over-Year Growth Analysis
  4. 4 Driver Impact Analysis |
    1. 4.1 Demographic Load on Venous and Lymphatic Care |
    2. 4.2 Reimbursement as a Demand Switch |
    3. 4.3 Hospital Prophylaxis Protocols |
    4. 4.4 Home Care Migration
  5. 5 Restraints Impact Analysis |
    1. 5.1 The Adherence Problem |
    2. 5.2 Procurement Pressure in Europe |
    3. 5.3 Diagnosis Gaps Outside Mature Markets
  6. 6 Opportunities |
    1. 6.1 Connected Pressure Verification |
    2. 6.2 Emerging-Market Primary Care Entry |
    3. 6.3 Recovery and Performance Channels |
    4. 6.4 Data Monetisation and Subscription Models |
    5. 6.5 Post-Oncology Lymphedema Pathways
  7. 7 Regional Market Share & Country-Level Analysis |
    1. 7.1 North America | |
      1. 7.1.1 US | |
      2. 7.1.2 Canada | |
      3. 7.1.3 Mexico |
    2. 7.2 Europe | |
      1. 7.2.1 Germany | |
      2. 7.2.2 UK | |
      3. 7.2.3 France | |
      4. 7.2.4 Italy | |
      5. 7.2.5 Spain | |
      6. 7.2.6 Nordic Countries | |
      7. 7.2.7 Russia | |
      8. 7.2.8 Rest of Europe |
    3. 7.3 Asia-Pacific | |
      1. 7.3.1 China | |
      2. 7.3.2 India | |
      3. 7.3.3 Japan | |
      4. 7.3.4 South Korea | |
      5. 7.3.5 ASEAN | |
      6. 7.3.6 Rest of Asia-Pacific |
    4. 7.4 South America | |
      1. 7.4.1 Brazil | |
      2. 7.4.2 Argentina | |
      3. 7.4.3 Rest of South America |
    5. 7.5 Middle East & Africa | |
      1. 7.5.1 Saudi Arabia | |
      2. 7.5.2 UAE | |
      3. 7.5.3 South Africa | |
      4. 7.5.4 Egypt | |
      5. 7.5.5 Rest of Middle East & Africa
  8. 8 Future Outlook (2026–2035) |
    1. 8.1 Sensor-Native Therapy Becomes Standard |
    2. 8.2 Reimbursement Shifts Toward Outcomes |
    3. 8.3 Manufacturing Localisation and Trade Exposure |
    4. 8.4 Sustainability Enters Procurement Scoring
  9. 9 Market Segmentation Analysis |
    1. 9.1 By Technology | |
      1. 9.1.1 Static Compression Therapy | |
      2. 9.1.2 Dynamic Compression Therapy |
    2. 9.2 By Product | |
      1. 9.2.1 Compression Garments | |
      2. 9.2.2 Compression Pumps | |
      3. 9.2.3 Compression Braces |
    3. 9.3 By Application | |
      1. 9.3.1 Venous Leg Ulcers | |
      2. 9.3.2 Deep Vein Thrombosis Treatment | |
      3. 9.3.3 Lymphedema Treatment | |
      4. 9.3.4 Varicose Veins | |
      5. 9.3.5 Other Applications |
    4. 9.4 By End User | |
      1. 9.4.1 Hospitals | |
      2. 9.4.2 Specialty Clinics | |
      3. 9.4.3 Home Care | |
      4. 9.4.4 Others
  10. 10 Competitive Landscape |
    1. 10.1 Market Share Analysis (2026) |
    2. 10.2 Competitive Benchmarking Matrix |
    3. 10.3 Company Profiles | |
      1. 10.3.1 Essity AB | |
      2. 10.3.2 medi GmbH & Co. KG | |
      3. 10.3.3 SIGVARIS Group | |
      4. 10.3.4 Paul Hartmann AG | |
      5. 10.3.5 3M / Solventum | |
      6. 10.3.6 ConvaTec Group PLC | |
      7. 10.3.7 Tactile Systems Technology | |
      8. 10.3.8 Arjo AB | |
      9. 10.3.9 Julius Zorn GmbH (Juzo) | |
      10. 10.3.10 Enovis (DJO) | |
      11. 10.3.11 Cardinal Health | |
      12. 10.3.12 Bio Compression Systems
  11. 11 Recent News & Developments
  12. 12 Report Scope & Methodology |
    1. 12.1 Study Period & Base Year |
    2. 12.2 Data Sources & Citations |
    3. 12.3 Abbreviations
  13. 13 Detailed Sources & Citations
  14. 14 Frequently Asked Questions
  15. 15 LIST OF TABLES |
  16. TABLE 1 Global Compression Therapy Market Size & Forecast, by Revenue (USD Billion), 2021–2035 |
  17. TABLE 2 Global Compression Therapy Market – Year-over-Year Growth Analysis, 2021–2035 |
  18. TABLE 3 Driver Impact Analysis – Estimated Contribution to Growth Momentum, 2026–2035 |
  19. TABLE 4 Restraint Impact Analysis – Estimated Drag on Growth Momentum, 2026–2035 |
  20. TABLE 5 Global Compression Therapy Market Size, by Region, 2021–2035 (USD Billion) |
  21. TABLE 6 North America Compression Therapy Market Size, by Country, 2021–2035 (USD Billion) |
  22. TABLE 7 Europe Compression Therapy Market Size, by Country, 2021–2035 (USD Billion) |
  23. TABLE 8 Asia-Pacific Compression Therapy Market Size, by Country, 2021–2035 (USD Billion) |
  24. TABLE 9 South America Compression Therapy Market Size, by Country, 2021–2035 (USD Billion) |
  25. TABLE 10 Middle East & Africa Compression Therapy Market Size, by Country, 2021–2035 (USD Billion) |
  26. TABLE 11 Global Compression Therapy Market Size, by Technology, 2021–2035 (USD Billion) |
  27. TABLE 12 Global Compression Therapy Market Size, by Product, 2021–2035 (USD Billion) |
  28. TABLE 13 Global Compression Therapy Market Size, by Application, 2021–2035 (USD Billion) |
  29. TABLE 14 Global Compression Therapy Market Size, by End User, 2021–2035 (USD Billion) |
  30. TABLE 15 North America Compression Therapy Market Size, by Technology and Product, 2021–2035 (USD Billion) |
  31. TABLE 16 Europe Compression Therapy Market Size, by Application and End User, 2021–2035 (USD Billion) |
  32. TABLE 17 Asia-Pacific Compression Therapy Market Size, by Product and End User, 2021–2035 (USD Billion) |
  33. TABLE 18 South America Compression Therapy Market Size, by Application, 2021–2035 (USD Billion) |
  34. TABLE 19 Middle East & Africa Compression Therapy Market Size, by End User, 2021–2035 (USD Billion) |
  35. TABLE 20 Competitive Benchmarking Matrix – Global Compression Therapy Market, 2026 |
  36. TABLE 21 Company Profiles – Key Players, Global Compression Therapy Market |
  37. TABLE 22 Recent Developments & Strategic Announcements, 2023–2025 |
  38. TABLE 23 Report Scope & Methodology Summary |
  39. TABLE 24 Detailed Sources & Citations Index
  40. 16 LIST OF FIGURES |
  41. FIGURE 1 Global Compression Therapy Market – Market Dynamics Overview (Drivers, Restraints, Opportunities) |
  42. FIGURE 2 Industry Value Chain Analysis – Compression Therapy |
  43. FIGURE 3 Porter's Five Forces Analysis – Compression Therapy |
  44. FIGURE 4 Global Compression Therapy Market Size Trend, 2021–2035 (USD Billion) |
  45. FIGURE 5 Year-over-Year Growth Trajectory, 2022–2035 (%) |
  46. FIGURE 6 Market Share by Technology, 2025 vs 2035 (%) |
  47. FIGURE 7 Market Share by Product, 2025 vs 2035 (%) |
  48. FIGURE 8 Market Share by Application, 2025 vs 2035 (%) |
  49. FIGURE 9 Market Share by End User, 2025 vs 2035 (%) |
  50. FIGURE 10 Regional Revenue Share Distribution, 2025 (%) |
  51. FIGURE 11 Regional Revenue Share Distribution, 2035 (%) |
  52. FIGURE 12 Regional CAGR Comparison, 2026–2035 (%) |
  53. FIGURE 13 North America Country-Level Share Breakdown, 2025 (%) |
  54. FIGURE 14 Europe Country-Level Share Breakdown, 2025 (%) |
  55. FIGURE 15 Asia-Pacific Country-Level Share Breakdown, 2025 (%) |
  56. FIGURE 16 Competitive Landscape – Estimated Revenue Share Positioning, 2026 |
  57. FIGURE 17 Competitive Positioning Matrix – Portfolio Breadth vs Channel Reach |
  58. FIGURE 18 Reimbursement Coverage Maturity Heatmap by Country, 2026

Segmentation Quick Reference

DimensionSub-SegmentsDominant SegmentFastest Growing Segment
By TechnologyStatic Compression Therapy; Dynamic Compression TherapyStatic Compression TherapyDynamic Compression Therapy
By ProductCompression Garments; Compression Pumps; Compression BracesCompression GarmentsCompression Pumps
By ApplicationVenous Leg Ulcers; Deep Vein Thrombosis Treatment; Lymphedema Treatment; Varicose Veins; Other ApplicationsVenous Leg UlcersLymphedema Treatment
By End UserHospitals; Specialty Clinics; Home Care; OthersHospitalsHome Care
By GeographyNorth America; Europe; Asia-Pacific; South America; Middle East & AfricaNorth AmericaAsia-Pacific


Market Segmentation Overview

By Technology

Sub-SegmentKey Trend
Static Compression TherapyGraduated knit engineering and donning aids target the adherence ceiling
Dynamic Compression TherapyMulti-chamber sequential systems with wireless compliance logging move into homes.


Static products retain the installed base because they are inexpensive, nurse-prescribable, and clinically validated. Dynamic systems capture the incremental spend by removing application-technique variability and generating usage data that payers increasingly request.

By Product

Sub-SegmentKey Trend
Compression GarmentsMade-to-measure flat-knit lines carry the margin as tenders erode ready-to-wear pricing.
Compression PumpsAt-home reimbursement converts clinic capital purchases into insured individual placements.
Compression BracesOrthopaedic and sports rehabilitation crossover broadens the buyer base.


Garments deliver volume through recurring replacement cycles; pumps deliver revenue per patient. The strategic question for most manufacturers is how far to shift mix toward hardware without losing the fitter networks that sustain garment loyalty.

By Application

Sub-SegmentKey Trend
Venous Leg UlcersFirst-line therapy status keeps evidence-based demand stable and protocol-driven
Deep Vein Thrombosis TreatmentProphylaxis compliance reporting sustains hospital pump fleet refresh cycles.
Lymphedema TreatmentCoverage expansion converts out-of-pocket purchases into structured replacement.
Varicose VeinsPost-procedural compression remains standard following ablation and sclerotherapy.
Other ApplicationsSports recovery, travel prophylaxis, and burn scar management widen the base.


Ulcer care anchors clinical credibility while lymphedema drives growth. Oncology survivorship programmes are steadily formalising compression as part of standard follow-up, creating predictable multi-year demand from a well-identified population.

By End User

Sub-SegmentKey Trend
HospitalsProphylaxis mandates and surgical volume sustain capital and consumable spend
Specialty ClinicsVascular and wound centres drive custom fitting and product-mix premiumisation.
Home CarePayer-led relocation of chronic management favours patient-operable systems
OthersLong-term care facilities and athletic training centres broaden distribution.


Acute settings still purchase the most, but the direction of travel is unmistakably toward the home. Vendors with direct-to-patient billing and fulfilment capability will convert that shift into recurring revenue; those dependent on intermediaries will not.

By Region

Sub-SegmentKey Trend
North AmericaLymphedema benefit rollout reshapes demand economics and channel structure
EuropeMDR compliance consolidates suppliers while tenders compress unit pricing
Asia-PacificHospital construction and streamlined device registration accelerate entry.
South AmericaBrazilian public protocols anchor demand amid currency-driven pricing volatility
Middle East & AfricaGulf hospital capex and diabetic wound programmes define two distinct buyer profiles.


Reimbursement maturity, not income level alone, determines regional performance. Markets with codified aid schedules generate predictable replacement demand, while those without depend on episodic hospital procurement cycles that are harder to forecast and slower to scale.




Download PDF ×

We do not share your information with anyone. However, we may send you emails based on your report interest from time to time. You may contact us at any time to opt-out.