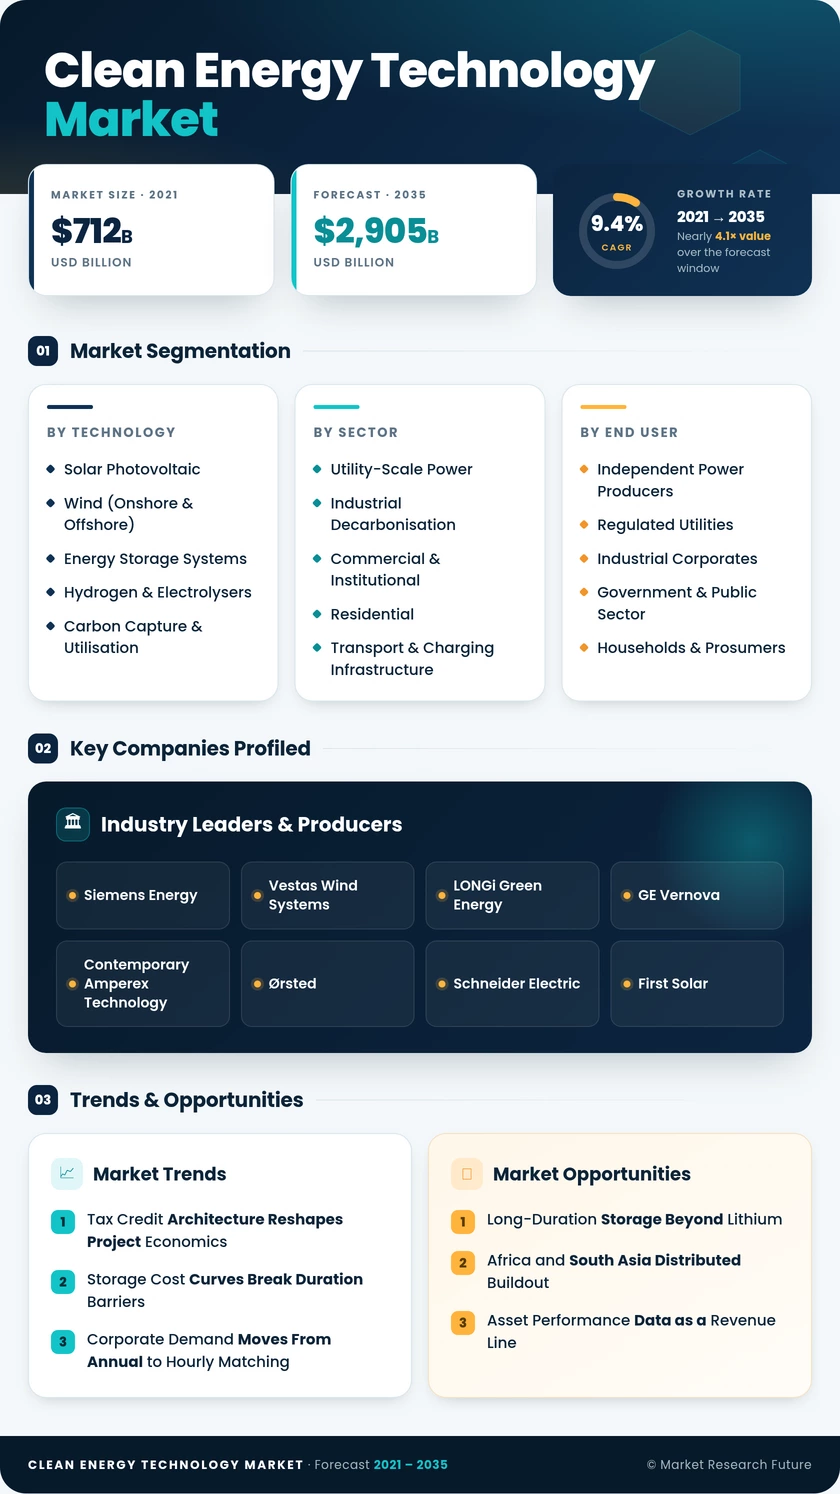
Clean Energy Technology Market (2026 - 2035)

ID: MRFR/EnP/34140-HCR 100 Pages Chitranshi Jaiswal Last Updated: October 16, 2026
Clean Energy Technology Market Research Report By Technology (Solar Photovoltaic, Wind (Onshore & Offshore), Energy Storage Systems, Hydrogen & Electrolysers, Carbon Capture & Utilisation, Nuclear & Advanced Reactors, Bioenergy & Geothermal), By Sector (Utility-Scale Power, Industrial Decarbonisation, Commercial & Institutional, Residential, Transport & Charging Infrastructure), By End User (Independent Power Producers, Regulated Utilities, Industrial Corporates, Government & Public Sector, Households & Prosumers) and By Regional (North America, Europe, South America, Asia Pacific, Middle East and Africa) - Growth & Industry Forecast to 2035
Clean Energy Technology Market
Market Size
Forecast Period2026-2035
CAGR (2026-2035)9.4%
2025 Market SizeUSD 1,182.0 Billion
2035 Market SizeUSD 2,905.0 Billion
Key Players
Siemens Energy
Vestas Wind Systems
LONGi Green Energy
GE Vernova
Contemporary Amperex Technology
Ørsted
Opportunities
  • Long-Duration Storage Beyond Lithium
  • Africa and South Asia Distributed Buildout
  • Asset Performance Data as a Revenue Line
  1. 1 Market Overview |
    1. 1.1 Study Assumptions & Market Definition |
    2. 1.2 Scope of the Study |
    3. 1.3 Research Methodology
  2. 2 Market Summary & Key Report Takeaways |
    1. 2.1 Key Takeaways by Technology |
    2. 2.2 Key Takeaways by Sector |
    3. 2.3 Key Takeaways by Geography
  3. 3 Global Market Size & Forecast (2021–2035) |
    1. 3.1 Historical Market Size (2021–2024) |
    2. 3.2 Base Year Estimate (2025) |
    3. 3.3 Forecast Market Size (2026–2035) |
    4. 3.4 Year-over-Year Growth Analysis
  4. 4 Driver Impact Analysis |
    1. 4.1 Tax Credit Architecture & Project Economics |
    2. 4.2 Storage Cost Curves & Duration Economics |
    3. 4.3 Corporate Hourly Clean Power Procurement |
    4. 4.4 Data-Centre Load Growth
  5. 5 Restraints Impact Analysis |
    1. 5.1 Interconnection Queue Backlogs |
    2. 5.2 Critical Mineral Concentration Risk |
    3. 5.3 Cost of Capital in Emerging Markets
  6. 6 Opportunity Analysis |
    1. 6.1 Long-Duration Storage Beyond Lithium |
    2. 6.2 Africa & South Asia Distributed Buildout |
    3. 6.3 Asset Performance Data Monetisation |
    4. 6.4 Retrofit & Repowering of the 2010s Fleet |
    5. 6.5 Industrial Heat Electrification
  7. 7 Regional Market Share & Country-Level Analysis |
    1. 7.1 Asia-Pacific | |
      1. 7.1.1 China | |
      2. 7.1.2 India | |
      3. 7.1.3 Japan | |
      4. 7.1.4 Australia | |
      5. 7.1.5 Rest of Asia-Pacific |
    2. 7.2 North America | |
      1. 7.2.1 United States | |
      2. 7.2.2 Canada | |
      3. 7.2.3 Mexico |
    3. 7.3 Europe | |
      1. 7.3.1 Germany | |
      2. 7.3.2 United Kingdom | |
      3. 7.3.3 France | |
      4. 7.3.4 Netherlands | |
      5. 7.3.5 Rest of Europe |
    4. 7.4 South America | |
      1. 7.4.1 Brazil | |
      2. 7.4.2 Chile | |
      3. 7.4.3 Colombia | |
      4. 7.4.4 Rest of South America |
    5. 7.5 Middle East & Africa | |
      1. 7.5.1 Saudi Arabia | |
      2. 7.5.2 United Arab Emirates | |
      3. 7.5.3 South Africa | |
      4. 7.5.4 Rest of Middle East & Africa
  8. 8 Future Outlook (2026–2035) |
    1. 8.1 Autonomous Grid Operations |
    2. 8.2 Firm Capacity as the Priced Product |
    3. 8.3 Nuclear & Firm Low-Carbon Resources |
    4. 8.4 Disclosure Regimes & Procurement
  9. 9 Market Segmentation Analysis |
    1. 9.1 By Technology | |
      1. 9.1.1 Solar Photovoltaic | |
      2. 9.1.2 Wind (Onshore & Offshore) | |
      3. 9.1.3 Energy Storage Systems | |
      4. 9.1.4 Hydrogen & Electrolysers | |
      5. 9.1.5 Carbon Capture & Utilisation | |
      6. 9.1.6 Nuclear & Advanced Reactors | |
      7. 9.1.7 Bioenergy & Geothermal |
    2. 9.2 By Sector | |
      1. 9.2.1 Utility-Scale Power | |
      2. 9.2.2 Industrial Decarbonisation | |
      3. 9.2.3 Commercial & Institutional | |
      4. 9.2.4 Residential | |
      5. 9.2.5 Transport & Charging Infrastructure |
    3. 9.3 By End User | |
      1. 9.3.1 Independent Power Producers | |
      2. 9.3.2 Regulated Utilities | |
      3. 9.3.3 Industrial Corporates | |
      4. 9.3.4 Government & Public Sector | |
      5. 9.3.5 Households & Prosumers
  10. 10 Competitive Landscape |
    1. 10.1 Market Concentration Analysis |
    2. 10.2 Competitive Benchmarking Matrix |
    3. 10.3 Company Profiles
  11. 11 Recent News & Developments
  12. 12 Report Scope & Methodology
  13. 13 Detailed Sources & Citations
  14. 14 Frequently Asked Questions
  15. 15 LIST OF TABLES |
  16. TABLE 1 Global Clean Energy Technology Market Size & Forecast, by Revenue (USD Billion), 2021–2035 |
  17. TABLE 2 Global Clean Energy Technology Market – Year-over-Year Growth Analysis, 2021–2035 |
  18. TABLE 3 Driver Impact Analysis Matrix, 2026–2035 |
  19. TABLE 4 Restraint Impact Analysis Matrix, 2026–2035 |
  20. TABLE 5 Global Clean Energy Technology Market Size, by Region, 2021–2035 (USD Billion) |
  21. TABLE 6 Asia-Pacific Clean Energy Technology Market Size, by Country, 2021–2035 (USD Billion) |
  22. TABLE 7 North America Clean Energy Technology Market Size, by Country, 2021–2035 (USD Billion) |
  23. TABLE 8 Europe Clean Energy Technology Market Size, by Country, 2021–2035 (USD Billion) |
  24. TABLE 9 South America Clean Energy Technology Market Size, by Country, 2021–2035 (USD Billion) |
  25. TABLE 10 Middle East & Africa Clean Energy Technology Market Size, by Country, 2021–2035 (USD Billion) |
  26. TABLE 11 Global Clean Energy Technology Market Size, by Technology, 2021–2035 (USD Billion) |
  27. TABLE 12 Global Clean Energy Technology Market Size, by Sector, 2021–2035 (USD Billion) |
  28. TABLE 13 Global Clean Energy Technology Market Size, by End User, 2021–2035 (USD Billion) |
  29. TABLE 14 Asia-Pacific Clean Energy Technology Market Size, by Technology, 2021–2035 (USD Billion) |
  30. TABLE 15 North America Clean Energy Technology Market Size, by Technology, 2021–2035 (USD Billion) |
  31. TABLE 16 Europe Clean Energy Technology Market Size, by Technology, 2021–2035 (USD Billion) |
  32. TABLE 17 Competitive Benchmarking Matrix, 2026 |
  33. TABLE 18 Company Profiles – Key Players |
  34. TABLE 19 Recent Developments & Strategic Announcements, 2023–2025 |
  35. TABLE 20 Report Scope & Methodology Summary |
  36. TABLE 21 Detailed Sources & Citations Index
  37. 16 LIST OF FIGURES |
  38. FIGURE 1 Market Dynamics – Drivers, Restraints, Opportunities and Challenges |
  39. FIGURE 2 Industry Value Chain Analysis |
  40. FIGURE 3 Porter's Five Forces Analysis |
  41. FIGURE 4 Global Market Size Trend, 2021–2035 (USD Billion) |
  42. FIGURE 5 Year-over-Year Growth Trend, 2022–2035 (%) |
  43. FIGURE 6 Market Share by Technology, 2025 vs 2035 (%) |
  44. FIGURE 7 Market Share by Sector, 2025 (%) |
  45. FIGURE 8 Market Share by End User, 2025 (%) |
  46. FIGURE 9 Regional Share Distribution, 2025 (%) |
  47. FIGURE 10 Regional CAGR Comparison, 2026–2035 (%) |
  48. FIGURE 11 Country-Level Contribution Within Asia-Pacific, 2025 (%) |
  49. FIGURE 12 Competitive Landscape – Estimated Revenue Share Bands, 2026 |
  50. FIGURE 13 Strategic Positioning Matrix of Leading Participants

Segmentation Quick Reference

DimensionSub-SegmentsDominant SegmentFastest Growing Segment
By TechnologySolar Photovoltaic; Wind (Onshore & Offshore); Energy Storage Systems; Hydrogen & Electrolysers; Carbon Capture & Utilisation; Nuclear & Advanced Reactors; Bioenergy & GeothermalSolar PhotovoltaicHydrogen & Electrolysers
By SectorUtility-Scale Power; Industrial Decarbonisation; Commercial & Institutional; Residential; Transport & Charging InfrastructureUtility-Scale PowerTransport & Charging Infrastructure
By End UserIndependent Power Producers; Regulated Utilities; Industrial Corporates; Government & Public Sector; Households & ProsumersIndependent Power ProducersIndustrial Corporates
By RegionAsia-Pacific; North America; Europe; South America; Middle East & AfricaAsia-PacificAsia-Pacific


Market Segmentation Overview

By Technology

Sub-SegmentKey Trend
Solar PhotovoltaicValue migrating downstream to trackers, inverters and EPC services
Wind (Onshore & Offshore)Contract restructuring after 2023 offshore impairments; repowering cycle begins
Energy Storage SystemsAttach rates on new solar exceed 55% in leading markets
Hydrogen & ElectrolysersOfftake-linked FIDs replace speculative capacity announcements
Carbon Capture & UtilisationCement, steel and gas processing anchor early commercial projects
Nuclear & Advanced ReactorsHyperscaler offtake revives restart and SMR ordering pipelines
Bioenergy & GeothermalPositioned as dispatchable complements rather than volume plays


Technology mix is diverging by geography rather than converging. Mature grids buy firming and flexibility; growth grids still buy raw capacity, and vendors that serve both increasingly maintain separate product roadmaps for each.

By Sector

Sub-SegmentKey Trend
Utility-Scale PowerAuction design shifts toward non-price resilience criteria
Industrial DecarbonisationCarbon border pricing converts abatement into a competitiveness issue
Commercial & InstitutionalHourly matching commitments raise technical specification
ResidentialHeat pump and rooftop subsidies drive consumer-side adoption
Transport & Charging InfrastructureDepot and corridor charging capex scales with fleet mandates


Sector demand is broadening away from the utility monopsony that characterised the last decade. Industrial and commercial buyers now sign directly, and they judge suppliers on delivered reliability rather than lowest tendered price.

By End User

Sub-SegmentKey Trend
Independent Power ProducersAbsorb development risk; consolidate into portfolio operators
Regulated UtilitiesTransmission and distribution rate-base plans rise at double-digit rates
Industrial CorporatesSelf-generation and direct procurement expand rapidly
Government & Public SectorPublic estate retrofit programmes anchor steady baseline demand
Households & ProsumersSelf-consumption economics replace net-metering dependence


Buyer sophistication is the quiet variable. As end users build internal energy teams, procurement moves from equipment tenders to outcome contracts, and that shift rewards suppliers with financing, analytics and service capability alongside hardware.

just now

Opus 5 High

Download PDF ×

We do not share your information with anyone. However, we may send you emails based on your report interest from time to time. You may contact us at any time to opt-out.