Request Free Sample ×

Kindly complete the form below to receive a free sample of this Report

* Please use a valid business email

Leading companies partner with us for data-driven Insights

clients tt-cursor
Hero Background

China Soups Market

ID: MRFR/FnB/46750-HCR
128 Pages
Snehal Singh
Last Updated: April 06, 2026

China Soups Market Size, Share, Industry Trend & Analysis Research Report By Type (Dry, Wet, Others) and By Distribution Channel (Supermarkets & Hypermarkets, Convenience Stores, Others) - Forecast to 2035

Share:
Download PDF ×

We do not share your information with anyone. However, we may send you emails based on your report interest from time to time. You may contact us at any time to opt-out.

China Soups Market Infographic
Purchase Options
  1. 1 SECTION I: EXECUTIVE SUMMARY AND KEY HIGHLIGHTS
    1. 1.1 EXECUTIVE SUMMARY
      1. 1.1.1 Market Overview
      2. 1.1.2 Key Findings
      3. 1.1.3 Market Segmentation
      4. 1.1.4 Competitive Landscape
      5. 1.1.5 Challenges and Opportunities
      6. 1.1.6 Future Outlook
  2. 2 SECTION II: SCOPING, METHODOLOGY AND MARKET STRUCTURE
    1. 2.1 MARKET INTRODUCTION
      1. 2.1.1 Definition
      2. 2.1.2 Scope of the study
        1. 2.1.2.1 Research Objective
        2. 2.1.2.2 Assumption
        3. 2.1.2.3 Limitations
    2. 2.2 RESEARCH METHODOLOGY
      1. 2.2.1 Overview
      2. 2.2.2 Data Mining
      3. 2.2.3 Secondary Research
      4. 2.2.4 Primary Research
        1. 2.2.4.1 Primary Interviews and Information Gathering Process
        2. 2.2.4.2 Breakdown of Primary Respondents
      5. 2.2.5 Forecasting Model
      6. 2.2.6 Market Size Estimation
        1. 2.2.6.1 Bottom-Up Approach
        2. 2.2.6.2 Top-Down Approach
      7. 2.2.7 Data Triangulation
      8. 2.2.8 Validation
  3. 3 SECTION III: QUALITATIVE ANALYSIS
    1. 3.1 MARKET DYNAMICS
      1. 3.1.1 Overview
      2. 3.1.2 Drivers
      3. 3.1.3 Restraints
      4. 3.1.4 Opportunities
    2. 3.2 MARKET FACTOR ANALYSIS
      1. 3.2.1 Value chain Analysis
      2. 3.2.2 Porter's Five Forces Analysis
        1. 3.2.2.1 Bargaining Power of Suppliers
        2. 3.2.2.2 Bargaining Power of Buyers
        3. 3.2.2.3 Threat of New Entrants
        4. 3.2.2.4 Threat of Substitutes
        5. 3.2.2.5 Intensity of Rivalry
      3. 3.2.3 COVID-19 Impact Analysis
        1. 3.2.3.1 Market Impact Analysis
        2. 3.2.3.2 Regional Impact
        3. 3.2.3.3 Opportunity and Threat Analysis
  4. 4 SECTION IV: QUANTITATIVE ANALYSIS
    1. 4.1 Construction, BY Type (USD Million)
      1. 4.1.1 Veg
      2. 4.1.2 Vegetable/Mix-Veg
      3. 4.1.3 Tomato
      4. 4.1.4 Mushroom
      5. 4.1.5 Other Veg Type
      6. 4.1.6 Non-Veg
      7. 4.1.7 Chicken
      8. 4.1.8 Lamb
      9. 4.1.9 Mutton/ Beef/ Others
    2. 4.2 Construction, BY Product Type (USD Million)
      1. 4.2.1 Ambient Soup
      2. 4.2.2 Chilled soup
      3. 4.2.3 Dried soup
      4. 4.2.4 Frozen Soup
      5. 4.2.5 UHT Soup
    3. 4.3 Construction, BY Form (USD Million)
      1. 4.3.1 Dry
      2. 4.3.2 Liquid
    4. 4.4 Construction, BY Nature (USD Million)
      1. 4.4.1 Organic
      2. 4.4.2 Regular
    5. 4.5 Construction, BY Source (USD Million)
      1. 4.5.1 Animal-Based
      2. 4.5.2 Plant-Based
    6. 4.6 Construction, BY Distribution Channel (USD Million)
      1. 4.6.1 B2B
      2. 4.6.2 B2C
      3. 4.6.3 Supermarkets/ Hypermarkets
      4. 4.6.4 Convenience Stores
      5. 4.6.5 Online
      6. 4.6.6 Others
  5. 5 SECTION V: COMPETITIVE ANALYSIS
    1. 5.1 Competitive Landscape
      1. 5.1.1 Overview
      2. 5.1.2 Competitive Analysis
      3. 5.1.3 Market share Analysis
      4. 5.1.4 Major Growth Strategy in the Construction
      5. 5.1.5 Competitive Benchmarking
      6. 5.1.6 Leading Players in Terms of Number of Developments in the Construction
      7. 5.1.7 Key developments and growth strategies
        1. 5.1.7.1 New Product Launch/Service Deployment
        2. 5.1.7.2 Merger & Acquisitions
        3. 5.1.7.3 Joint Ventures
      8. 5.1.8 Major Players Financial Matrix
        1. 5.1.8.1 Sales and Operating Income
        2. 5.1.8.2 Major Players R&D Expenditure. 2023
    2. 5.2 Company Profiles
      1. 5.2.1 Campbell Soup Company (US)
        1. 5.2.1.1 Financial Overview
        2. 5.2.1.2 Products Offered
        3. 5.2.1.3 Key Developments
        4. 5.2.1.4 SWOT Analysis
        5. 5.2.1.5 Key Strategies
      2. 5.2.2 Nestle S.A. (CH)
        1. 5.2.2.1 Financial Overview
        2. 5.2.2.2 Products Offered
        3. 5.2.2.3 Key Developments
        4. 5.2.2.4 SWOT Analysis
        5. 5.2.2.5 Key Strategies
      3. 5.2.3 General Mills, Inc. (US)
        1. 5.2.3.1 Financial Overview
        2. 5.2.3.2 Products Offered
        3. 5.2.3.3 Key Developments
        4. 5.2.3.4 SWOT Analysis
        5. 5.2.3.5 Key Strategies
      4. 5.2.4 Unilever PLC (GB)
        1. 5.2.4.1 Financial Overview
        2. 5.2.4.2 Products Offered
        3. 5.2.4.3 Key Developments
        4. 5.2.4.4 SWOT Analysis
        5. 5.2.4.5 Key Strategies
      5. 5.2.5 Kraft Heinz Company (US)
        1. 5.2.5.1 Financial Overview
        2. 5.2.5.2 Products Offered
        3. 5.2.5.3 Key Developments
        4. 5.2.5.4 SWOT Analysis
        5. 5.2.5.5 Key Strategies
      6. 5.2.6 Conagra Brands, Inc. (US)
        1. 5.2.6.1 Financial Overview
        2. 5.2.6.2 Products Offered
        3. 5.2.6.3 Key Developments
        4. 5.2.6.4 SWOT Analysis
        5. 5.2.6.5 Key Strategies
      7. 5.2.7 PepsiCo, Inc. (US)
        1. 5.2.7.1 Financial Overview
        2. 5.2.7.2 Products Offered
        3. 5.2.7.3 Key Developments
        4. 5.2.7.4 SWOT Analysis
        5. 5.2.7.5 Key Strategies
      8. 5.2.8 Hain Celestial Group, Inc. (US)
        1. 5.2.8.1 Financial Overview
        2. 5.2.8.2 Products Offered
        3. 5.2.8.3 Key Developments
        4. 5.2.8.4 SWOT Analysis
        5. 5.2.8.5 Key Strategies
    3. 5.3 Appendix
      1. 5.3.1 References
      2. 5.3.2 Related Reports
  6. 6 LIST OF FIGURES
    1. 6.1 MARKET SYNOPSIS
    2. 6.2 CHINA MARKET ANALYSIS BY TYPE
    3. 6.3 CHINA MARKET ANALYSIS BY PRODUCT TYPE
    4. 6.4 CHINA MARKET ANALYSIS BY FORM
    5. 6.5 CHINA MARKET ANALYSIS BY NATURE
    6. 6.6 CHINA MARKET ANALYSIS BY SOURCE
    7. 6.7 CHINA MARKET ANALYSIS BY DISTRIBUTION CHANNEL
    8. 6.8 KEY BUYING CRITERIA OF CONSTRUCTION
    9. 6.9 RESEARCH PROCESS OF MRFR
    10. 6.10 DRO ANALYSIS OF CONSTRUCTION
    11. 6.11 DRIVERS IMPACT ANALYSIS: CONSTRUCTION
    12. 6.12 RESTRAINTS IMPACT ANALYSIS: CONSTRUCTION
    13. 6.13 SUPPLY / VALUE CHAIN: CONSTRUCTION
    14. 6.14 CONSTRUCTION, BY TYPE, 2024 (% SHARE)
    15. 6.15 CONSTRUCTION, BY TYPE, 2024 TO 2035 (USD Million)
    16. 6.16 CONSTRUCTION, BY PRODUCT TYPE, 2024 (% SHARE)
    17. 6.17 CONSTRUCTION, BY PRODUCT TYPE, 2024 TO 2035 (USD Million)
    18. 6.18 CONSTRUCTION, BY FORM, 2024 (% SHARE)
    19. 6.19 CONSTRUCTION, BY FORM, 2024 TO 2035 (USD Million)
    20. 6.20 CONSTRUCTION, BY NATURE, 2024 (% SHARE)
    21. 6.21 CONSTRUCTION, BY NATURE, 2024 TO 2035 (USD Million)
    22. 6.22 CONSTRUCTION, BY SOURCE, 2024 (% SHARE)
    23. 6.23 CONSTRUCTION, BY SOURCE, 2024 TO 2035 (USD Million)
    24. 6.24 CONSTRUCTION, BY DISTRIBUTION CHANNEL, 2024 (% SHARE)
    25. 6.25 CONSTRUCTION, BY DISTRIBUTION CHANNEL, 2024 TO 2035 (USD Million)
    26. 6.26 BENCHMARKING OF MAJOR COMPETITORS
  7. 7 LIST OF TABLES
    1. 7.1 LIST OF ASSUMPTIONS
  8. 7.1.1
    1. 7.2 China MARKET SIZE ESTIMATES; FORECAST
      1. 7.2.1 BY TYPE, 2025-2035 (USD Million)
      2. 7.2.2 BY PRODUCT TYPE, 2025-2035 (USD Million)
      3. 7.2.3 BY FORM, 2025-2035 (USD Million)
      4. 7.2.4 BY NATURE, 2025-2035 (USD Million)
      5. 7.2.5 BY SOURCE, 2025-2035 (USD Million)
      6. 7.2.6 BY DISTRIBUTION CHANNEL, 2025-2035 (USD Million)
    2. 7.3 PRODUCT LAUNCH/PRODUCT DEVELOPMENT/APPROVAL
  9. 7.3.1
    1. 7.4 ACQUISITION/PARTNERSHIP
  10. 7.4.1

China Construction Market Segmentation

Construction By Type (USD Million, 2025-2035)
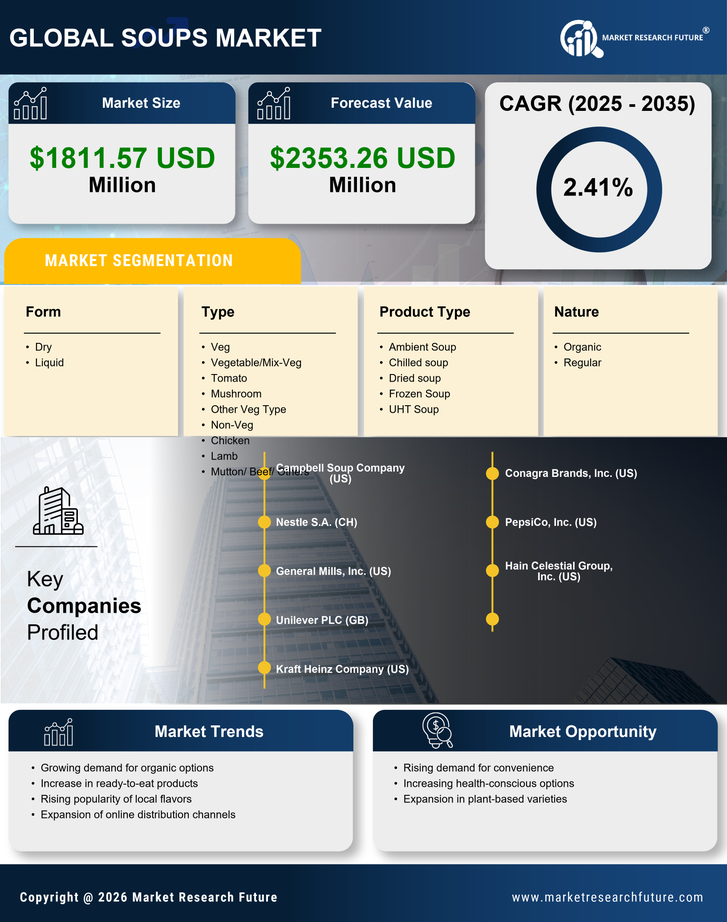
  • Veg
  • Vegetable/Mix-Veg
  • Tomato
  • Mushroom
  • Other Veg Type
  • Non-Veg
  • Chicken
  • Lamb
  • Mutton/ Beef/ Others

Construction By Product Type (USD Million, 2025-2035)

  • Ambient Soup
  • Chilled soup
  • Dried soup
  • Frozen Soup
  • UHT Soup

Construction By Form (USD Million, 2025-2035)

  • Dry
  • Liquid

Construction By Nature (USD Million, 2025-2035)

  • Organic
  • Regular

Construction By Source (USD Million, 2025-2035)

  • Animal-Based
  • Plant-Based

Construction By Distribution Channel (USD Million, 2025-2035)

  • B2B
  • B2C
  • Supermarkets/ Hypermarkets
  • Convenience Stores
  • Online
  • Others

Compare Licence

×
Features License Type
Single User Multiuser License Enterprise User
Price $4,950 $5,950 $7,250
Maximum User Access Limit 1 User Upto 10 Users Unrestricted Access Throughout the Organization
Free Customization
Direct Access to Analyst
Deliverable Format
Platform Access
Discount on Next Purchase 10% 15% 15%
Printable Versions