Request Free Sample ×

Kindly complete the form below to receive a free sample of this Report

* Please use a valid business email

Leading companies partner with us for data-driven Insights

clients tt-cursor
Hero Background

China Off Highway Diesel Common Rail Injection System Market

ID: MRFR/AT/56156-HCR
200 Pages
Triveni Bhoyar
Last Updated: March 10, 2026

China Off-Highway Diesel Common Rail Injection System Market Research Report: By Application (Construction Equipment, Agricultural Equipment, Mining Equipment, Material Handling Equipment), By Fuel Type (Ultra Low Sulfur Diesel, Low Sulfur Diesel, Biodiesel, Conventional Diesel), By Engine Type (Internal Combustion Engine, Dual Fuel Engine, Multi-Fuel Engine) and By Power Output (Below 100 HP, 100-200 HP, 200-300 HP, Above 300 HP) - Forecast to 2035

Share:
Download PDF ×

We do not share your information with anyone. However, we may send you emails based on your report interest from time to time. You may contact us at any time to opt-out.

  1. 1 SECTION I: EXECUTIVE SUMMARY AND KEY HIGHLIGHTS
    1. 1.1 EXECUTIVE SUMMARY
      1. 1.1.1 Market Overview
      2. 1.1.2 Key Findings
      3. 1.1.3 Market Segmentation
      4. 1.1.4 Competitive Landscape
      5. 1.1.5 Challenges and Opportunities
      6. 1.1.6 Future Outlook
  2. 2 SECTION II: SCOPING, METHODOLOGY AND MARKET STRUCTURE
    1. 2.1 MARKET INTRODUCTION
      1. 2.1.1 Definition
      2. 2.1.2 Scope of the study
        1. 2.1.2.1 Research Objective
        2. 2.1.2.2 Assumption
        3. 2.1.2.3 Limitations
    2. 2.2 RESEARCH METHODOLOGY
      1. 2.2.1 Overview
      2. 2.2.2 Data Mining
      3. 2.2.3 Secondary Research
      4. 2.2.4 Primary Research
        1. 2.2.4.1 Primary Interviews and Information Gathering Process
        2. 2.2.4.2 Breakdown of Primary Respondents
      5. 2.2.5 Forecasting Model
      6. 2.2.6 Market Size Estimation
        1. 2.2.6.1 Bottom-Up Approach
        2. 2.2.6.2 Top-Down Approach
      7. 2.2.7 Data Triangulation
      8. 2.2.8 Validation
  3. 3 SECTION III: QUALITATIVE ANALYSIS
    1. 3.1 MARKET DYNAMICS
      1. 3.1.1 Overview
      2. 3.1.2 Drivers
      3. 3.1.3 Restraints
      4. 3.1.4 Opportunities
    2. 3.2 MARKET FACTOR ANALYSIS
      1. 3.2.1 Value chain Analysis
      2. 3.2.2 Porter's Five Forces Analysis
        1. 3.2.2.1 Bargaining Power of Suppliers
        2. 3.2.2.2 Bargaining Power of Buyers
        3. 3.2.2.3 Threat of New Entrants
        4. 3.2.2.4 Threat of Substitutes
        5. 3.2.2.5 Intensity of Rivalry
      3. 3.2.3 COVID-19 Impact Analysis
        1. 3.2.3.1 Market Impact Analysis
        2. 3.2.3.2 Regional Impact
        3. 3.2.3.3 Opportunity and Threat Analysis
  4. 4 SECTION IV: QUANTITATIVE ANALYSIS
    1. 4.1 Automobile, BY Application (USD Million)
      1. 4.1.1 Construction Equipment
      2. 4.1.2 Agricultural Equipment
      3. 4.1.3 Mining Equipment
      4. 4.1.4 Material Handling Equipment
    2. 4.2 Automobile, BY Fuel Type (USD Million)
      1. 4.2.1 Ultra Low Sulfur Diesel
      2. 4.2.2 Low Sulfur Diesel
      3. 4.2.3 Biodiesel
      4. 4.2.4 Conventional Diesel
    3. 4.3 Automobile, BY Engine Type (USD Million)
      1. 4.3.1 Internal Combustion Engine
      2. 4.3.2 Dual Fuel Engine
      3. 4.3.3 Multi-Fuel Engine
    4. 4.4 Automobile, BY Power Output (USD Million)
      1. 4.4.1 Below 100 HP
      2. 4.4.2 100-200 HP
      3. 4.4.3 200-300 HP
      4. 4.4.4 Above 300 HP
  5. 5 SECTION V: COMPETITIVE ANALYSIS
    1. 5.1 Competitive Landscape
      1. 5.1.1 Overview
      2. 5.1.2 Competitive Analysis
      3. 5.1.3 Market share Analysis
      4. 5.1.4 Major Growth Strategy in the Automobile
      5. 5.1.5 Competitive Benchmarking
      6. 5.1.6 Leading Players in Terms of Number of Developments in the Automobile
      7. 5.1.7 Key developments and growth strategies
        1. 5.1.7.1 New Product Launch/Service Deployment
        2. 5.1.7.2 Merger & Acquisitions
        3. 5.1.7.3 Joint Ventures
      8. 5.1.8 Major Players Financial Matrix
        1. 5.1.8.1 Sales and Operating Income
        2. 5.1.8.2 Major Players R&D Expenditure. 2023
    2. 5.2 Company Profiles
      1. 5.2.1 Bosch (DE)
        1. 5.2.1.1 Financial Overview
        2. 5.2.1.2 Products Offered
        3. 5.2.1.3 Key Developments
        4. 5.2.1.4 SWOT Analysis
        5. 5.2.1.5 Key Strategies
      2. 5.2.2 Denso (JP)
        1. 5.2.2.1 Financial Overview
        2. 5.2.2.2 Products Offered
        3. 5.2.2.3 Key Developments
        4. 5.2.2.4 SWOT Analysis
        5. 5.2.2.5 Key Strategies
      3. 5.2.3 Delphi Technologies (GB)
        1. 5.2.3.1 Financial Overview
        2. 5.2.3.2 Products Offered
        3. 5.2.3.3 Key Developments
        4. 5.2.3.4 SWOT Analysis
        5. 5.2.3.5 Key Strategies
      4. 5.2.4 Continental (DE)
        1. 5.2.4.1 Financial Overview
        2. 5.2.4.2 Products Offered
        3. 5.2.4.3 Key Developments
        4. 5.2.4.4 SWOT Analysis
        5. 5.2.4.5 Key Strategies
      5. 5.2.5 Caterpillar (US)
        1. 5.2.5.1 Financial Overview
        2. 5.2.5.2 Products Offered
        3. 5.2.5.3 Key Developments
        4. 5.2.5.4 SWOT Analysis
        5. 5.2.5.5 Key Strategies
      6. 5.2.6 Cummins (US)
        1. 5.2.6.1 Financial Overview
        2. 5.2.6.2 Products Offered
        3. 5.2.6.3 Key Developments
        4. 5.2.6.4 SWOT Analysis
        5. 5.2.6.5 Key Strategies
      7. 5.2.7 Weichai Power (CN)
        1. 5.2.7.1 Financial Overview
        2. 5.2.7.2 Products Offered
        3. 5.2.7.3 Key Developments
        4. 5.2.7.4 SWOT Analysis
        5. 5.2.7.5 Key Strategies
      8. 5.2.8 Yanmar (JP)
        1. 5.2.8.1 Financial Overview
        2. 5.2.8.2 Products Offered
        3. 5.2.8.3 Key Developments
        4. 5.2.8.4 SWOT Analysis
        5. 5.2.8.5 Key Strategies
      9. 5.2.9 John Deere (US)
        1. 5.2.9.1 Financial Overview
        2. 5.2.9.2 Products Offered
        3. 5.2.9.3 Key Developments
        4. 5.2.9.4 SWOT Analysis
        5. 5.2.9.5 Key Strategies
    3. 5.3 Appendix
      1. 5.3.1 References
      2. 5.3.2 Related Reports
  6. 6 LIST OF FIGURES
    1. 6.1 MARKET SYNOPSIS
    2. 6.2 CHINA MARKET ANALYSIS BY APPLICATION
    3. 6.3 CHINA MARKET ANALYSIS BY FUEL TYPE
    4. 6.4 CHINA MARKET ANALYSIS BY ENGINE TYPE
    5. 6.5 CHINA MARKET ANALYSIS BY POWER OUTPUT
    6. 6.6 KEY BUYING CRITERIA OF AUTOMOBILE
    7. 6.7 RESEARCH PROCESS OF MRFR
    8. 6.8 DRO ANALYSIS OF AUTOMOBILE
    9. 6.9 DRIVERS IMPACT ANALYSIS: AUTOMOBILE
    10. 6.10 RESTRAINTS IMPACT ANALYSIS: AUTOMOBILE
    11. 6.11 SUPPLY / VALUE CHAIN: AUTOMOBILE
    12. 6.12 AUTOMOBILE, BY APPLICATION, 2024 (% SHARE)
    13. 6.13 AUTOMOBILE, BY APPLICATION, 2024 TO 2035 (USD Million)
    14. 6.14 AUTOMOBILE, BY FUEL TYPE, 2024 (% SHARE)
    15. 6.15 AUTOMOBILE, BY FUEL TYPE, 2024 TO 2035 (USD Million)
    16. 6.16 AUTOMOBILE, BY ENGINE TYPE, 2024 (% SHARE)
    17. 6.17 AUTOMOBILE, BY ENGINE TYPE, 2024 TO 2035 (USD Million)
    18. 6.18 AUTOMOBILE, BY POWER OUTPUT, 2024 (% SHARE)
    19. 6.19 AUTOMOBILE, BY POWER OUTPUT, 2024 TO 2035 (USD Million)
    20. 6.20 BENCHMARKING OF MAJOR COMPETITORS
  7. 7 LIST OF TABLES
    1. 7.1 LIST OF ASSUMPTIONS
  8. 7.1.1
    1. 7.2 China MARKET SIZE ESTIMATES; FORECAST
      1. 7.2.1 BY APPLICATION, 2025-2035 (USD Million)
      2. 7.2.2 BY FUEL TYPE, 2025-2035 (USD Million)
      3. 7.2.3 BY ENGINE TYPE, 2025-2035 (USD Million)
      4. 7.2.4 BY POWER OUTPUT, 2025-2035 (USD Million)
    2. 7.3 PRODUCT LAUNCH/PRODUCT DEVELOPMENT/APPROVAL
  9. 7.3.1
    1. 7.4 ACQUISITION/PARTNERSHIP
  10. 7.4.1

China Automobile Market Segmentation

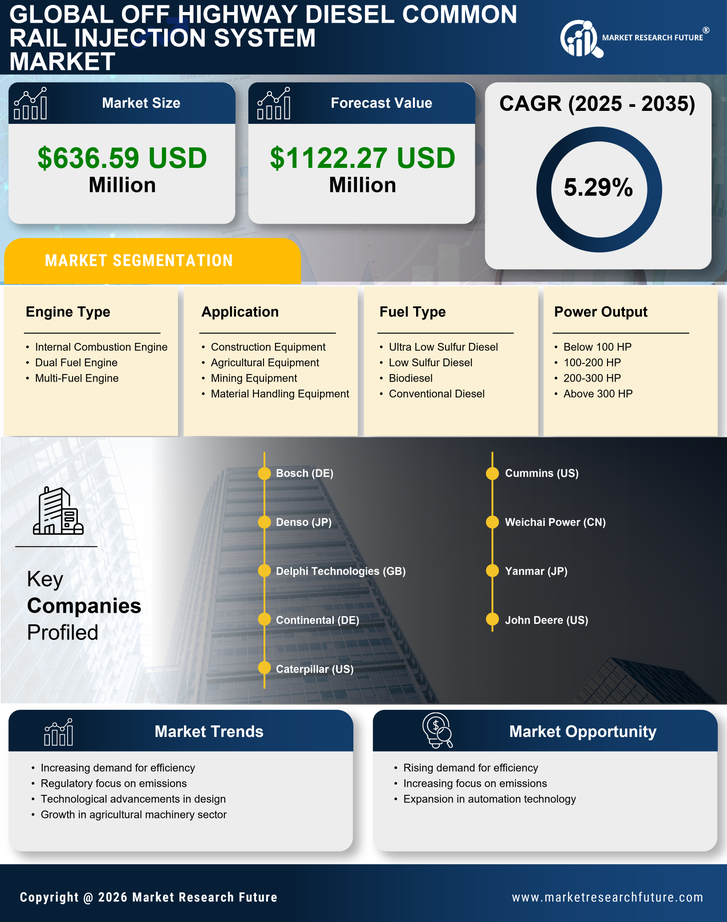
Automobile By Application (USD Million, 2025-2035)

  • Construction Equipment
  • Agricultural Equipment
  • Mining Equipment
  • Material Handling Equipment

Automobile By Fuel Type (USD Million, 2025-2035)

  • Ultra Low Sulfur Diesel
  • Low Sulfur Diesel
  • Biodiesel
  • Conventional Diesel

Automobile By Engine Type (USD Million, 2025-2035)

  • Internal Combustion Engine
  • Dual Fuel Engine
  • Multi-Fuel Engine

Automobile By Power Output (USD Million, 2025-2035)

  • Below 100 HP
  • 100-200 HP
  • 200-300 HP
  • Above 300 HP

Compare Licence

×
Features License Type
Single User Multiuser License Enterprise User
Price $4,950 $5,950 $7,250
Maximum User Access Limit 1 User Upto 10 Users Unrestricted Access Throughout the Organization
Free Customization
Direct Access to Analyst
Deliverable Format
Platform Access
Discount on Next Purchase 10% 15% 15%
Printable Versions