Request Free Sample ×

Kindly complete the form below to receive a free sample of this Report

* Please use a valid business email

Leading companies partner with us for data-driven Insights

clients tt-cursor
Hero Background

China Near Infrared Imaging Market

ID: MRFR/MED/52120-HCR
200 Pages
Rahul Gotadki
Last Updated: February 06, 2026

China Near Infrared Imaging Market Research Report: Size, Share, Trend Analysis By Applications (Medical Diagnostics, Industrial Applications, Agricultural Monitoring, Environmental Monitoring), By Device Type (Instruments, Cameras, Sensors, Software), By End Use (Healthcare, Manufacturing, Agriculture, Research and Development) and By Functionality (Imaging, Spectroscopy, Thermography) - Growth Outlook & Industry Forecast 2025 To 2035

Share:
Download PDF ×

We do not share your information with anyone. However, we may send you emails based on your report interest from time to time. You may contact us at any time to opt-out.

China Near Infrared Imaging Market Infographic
Purchase Options
  1. 1 SECTION I: EXECUTIVE SUMMARY AND KEY HIGHLIGHTS
    1. 1.1 EXECUTIVE SUMMARY
      1. 1.1.1 Market Overview
      2. 1.1.2 Key Findings
      3. 1.1.3 Market Segmentation
      4. 1.1.4 Competitive Landscape
      5. 1.1.5 Challenges and Opportunities
      6. 1.1.6 Future Outlook
  2. 2 SECTION II: SCOPING, METHODOLOGY AND MARKET STRUCTURE
    1. 2.1 MARKET INTRODUCTION
      1. 2.1.1 Definition
      2. 2.1.2 Scope of the study
        1. 2.1.2.1 Research Objective
        2. 2.1.2.2 Assumption
        3. 2.1.2.3 Limitations
    2. 2.2 RESEARCH METHODOLOGY
      1. 2.2.1 Overview
      2. 2.2.2 Data Mining
      3. 2.2.3 Secondary Research
      4. 2.2.4 Primary Research
        1. 2.2.4.1 Primary Interviews and Information Gathering Process
        2. 2.2.4.2 Breakdown of Primary Respondents
      5. 2.2.5 Forecasting Model
      6. 2.2.6 Market Size Estimation
        1. 2.2.6.1 Bottom-Up Approach
        2. 2.2.6.2 Top-Down Approach
      7. 2.2.7 Data Triangulation
      8. 2.2.8 Validation
  3. 3 SECTION III: QUALITATIVE ANALYSIS
    1. 3.1 MARKET DYNAMICS
      1. 3.1.1 Overview
      2. 3.1.2 Drivers
      3. 3.1.3 Restraints
      4. 3.1.4 Opportunities
    2. 3.2 MARKET FACTOR ANALYSIS
      1. 3.2.1 Value chain Analysis
      2. 3.2.2 Porter's Five Forces Analysis
        1. 3.2.2.1 Bargaining Power of Suppliers
        2. 3.2.2.2 Bargaining Power of Buyers
        3. 3.2.2.3 Threat of New Entrants
        4. 3.2.2.4 Threat of Substitutes
        5. 3.2.2.5 Intensity of Rivalry
      3. 3.2.3 COVID-19 Impact Analysis
        1. 3.2.3.1 Market Impact Analysis
        2. 3.2.3.2 Regional Impact
        3. 3.2.3.3 Opportunity and Threat Analysis
  4. 4 SECTION IV: QUANTITATIVE ANALYSIS
    1. 4.1 Food, Beverages & Nutrition, BY Application (USD Million)
      1. 4.1.1 Medical Diagnostics
      2. 4.1.2 Industrial Inspection
      3. 4.1.3 Agricultural Monitoring
      4. 4.1.4 Research and Development
    2. 4.2 Food, Beverages & Nutrition, BY Component (USD Million)
      1. 4.2.1 Cameras
      2. 4.2.2 Lighting Systems
      3. 4.2.3 Software
      4. 4.2.4 Accessories
    3. 4.3 Food, Beverages & Nutrition, BY End-use (USD Million)
      1. 4.3.1 Healthcare
      2. 4.3.2 Manufacturing
      3. 4.3.3 Agriculture
      4. 4.3.4 Research Institutions
    4. 4.4 Food, Beverages & Nutrition, BY Technology (USD Million)
      1. 4.4.1 Hyperspectral Imaging
      2. 4.4.2 Multispectral Imaging
      3. 4.4.3 Thermal Imaging
  5. 5 SECTION V: COMPETITIVE ANALYSIS
    1. 5.1 Competitive Landscape
      1. 5.1.1 Overview
      2. 5.1.2 Competitive Analysis
      3. 5.1.3 Market share Analysis
      4. 5.1.4 Major Growth Strategy in the Food, Beverages & Nutrition
      5. 5.1.5 Competitive Benchmarking
      6. 5.1.6 Leading Players in Terms of Number of Developments in the Food, Beverages & Nutrition
      7. 5.1.7 Key developments and growth strategies
        1. 5.1.7.1 New Product Launch/Service Deployment
        2. 5.1.7.2 Merger & Acquisitions
        3. 5.1.7.3 Joint Ventures
      8. 5.1.8 Major Players Financial Matrix
        1. 5.1.8.1 Sales and Operating Income
        2. 5.1.8.2 Major Players R&D Expenditure. 2023
    2. 5.2 Company Profiles
      1. 5.2.1 Hamamatsu Photonics (JP)
        1. 5.2.1.1 Financial Overview
        2. 5.2.1.2 Products Offered
        3. 5.2.1.3 Key Developments
        4. 5.2.1.4 SWOT Analysis
        5. 5.2.1.5 Key Strategies
      2. 5.2.2 NIR Technologies (US)
        1. 5.2.2.1 Financial Overview
        2. 5.2.2.2 Products Offered
        3. 5.2.2.3 Key Developments
        4. 5.2.2.4 SWOT Analysis
        5. 5.2.2.5 Key Strategies
      3. 5.2.3 Bruker Corporation (US)
        1. 5.2.3.1 Financial Overview
        2. 5.2.3.2 Products Offered
        3. 5.2.3.3 Key Developments
        4. 5.2.3.4 SWOT Analysis
        5. 5.2.3.5 Key Strategies
      4. 5.2.4 PerkinElmer (US)
        1. 5.2.4.1 Financial Overview
        2. 5.2.4.2 Products Offered
        3. 5.2.4.3 Key Developments
        4. 5.2.4.4 SWOT Analysis
        5. 5.2.4.5 Key Strategies
      5. 5.2.5 Teledyne Technologies (US)
        1. 5.2.5.1 Financial Overview
        2. 5.2.5.2 Products Offered
        3. 5.2.5.3 Key Developments
        4. 5.2.5.4 SWOT Analysis
        5. 5.2.5.5 Key Strategies
      6. 5.2.6 Mettler-Toledo (CH)
        1. 5.2.6.1 Financial Overview
        2. 5.2.6.2 Products Offered
        3. 5.2.6.3 Key Developments
        4. 5.2.6.4 SWOT Analysis
        5. 5.2.6.5 Key Strategies
      7. 5.2.7 Agilent Technologies (US)
        1. 5.2.7.1 Financial Overview
        2. 5.2.7.2 Products Offered
        3. 5.2.7.3 Key Developments
        4. 5.2.7.4 SWOT Analysis
        5. 5.2.7.5 Key Strategies
      8. 5.2.8 JASCO (JP)
        1. 5.2.8.1 Financial Overview
        2. 5.2.8.2 Products Offered
        3. 5.2.8.3 Key Developments
        4. 5.2.8.4 SWOT Analysis
        5. 5.2.8.5 Key Strategies
    3. 5.3 Appendix
      1. 5.3.1 References
      2. 5.3.2 Related Reports
  6. 6 LIST OF FIGURES
    1. 6.1 MARKET SYNOPSIS
    2. 6.2 CHINA MARKET ANALYSIS BY APPLICATION
    3. 6.3 CHINA MARKET ANALYSIS BY COMPONENT
    4. 6.4 CHINA MARKET ANALYSIS BY END-USE
    5. 6.5 CHINA MARKET ANALYSIS BY TECHNOLOGY
    6. 6.6 KEY BUYING CRITERIA OF FOOD, BEVERAGES & NUTRITION
    7. 6.7 RESEARCH PROCESS OF MRFR
    8. 6.8 DRO ANALYSIS OF FOOD, BEVERAGES & NUTRITION
    9. 6.9 DRIVERS IMPACT ANALYSIS: FOOD, BEVERAGES & NUTRITION
    10. 6.10 RESTRAINTS IMPACT ANALYSIS: FOOD, BEVERAGES & NUTRITION
    11. 6.11 SUPPLY / VALUE CHAIN: FOOD, BEVERAGES & NUTRITION
    12. 6.12 FOOD, BEVERAGES & NUTRITION, BY APPLICATION, 2024 (% SHARE)
    13. 6.13 FOOD, BEVERAGES & NUTRITION, BY APPLICATION, 2024 TO 2035 (USD Million)
    14. 6.14 FOOD, BEVERAGES & NUTRITION, BY COMPONENT, 2024 (% SHARE)
    15. 6.15 FOOD, BEVERAGES & NUTRITION, BY COMPONENT, 2024 TO 2035 (USD Million)
    16. 6.16 FOOD, BEVERAGES & NUTRITION, BY END-USE, 2024 (% SHARE)
    17. 6.17 FOOD, BEVERAGES & NUTRITION, BY END-USE, 2024 TO 2035 (USD Million)
    18. 6.18 FOOD, BEVERAGES & NUTRITION, BY TECHNOLOGY, 2024 (% SHARE)
    19. 6.19 FOOD, BEVERAGES & NUTRITION, BY TECHNOLOGY, 2024 TO 2035 (USD Million)
    20. 6.20 BENCHMARKING OF MAJOR COMPETITORS
  7. 7 LIST OF TABLES
    1. 7.1 LIST OF ASSUMPTIONS
  8. 7.1.1
    1. 7.2 China MARKET SIZE ESTIMATES; FORECAST
      1. 7.2.1 BY APPLICATION, 2025-2035 (USD Million)
      2. 7.2.2 BY COMPONENT, 2025-2035 (USD Million)
      3. 7.2.3 BY END-USE, 2025-2035 (USD Million)
      4. 7.2.4 BY TECHNOLOGY, 2025-2035 (USD Million)
    2. 7.3 PRODUCT LAUNCH/PRODUCT DEVELOPMENT/APPROVAL
  9. 7.3.1
    1. 7.4 ACQUISITION/PARTNERSHIP
  10. 7.4.1

China Food, Beverages & Nutrition Market Segmentation

Food, Beverages & Nutrition By Application (USD Million, 2025-2035)
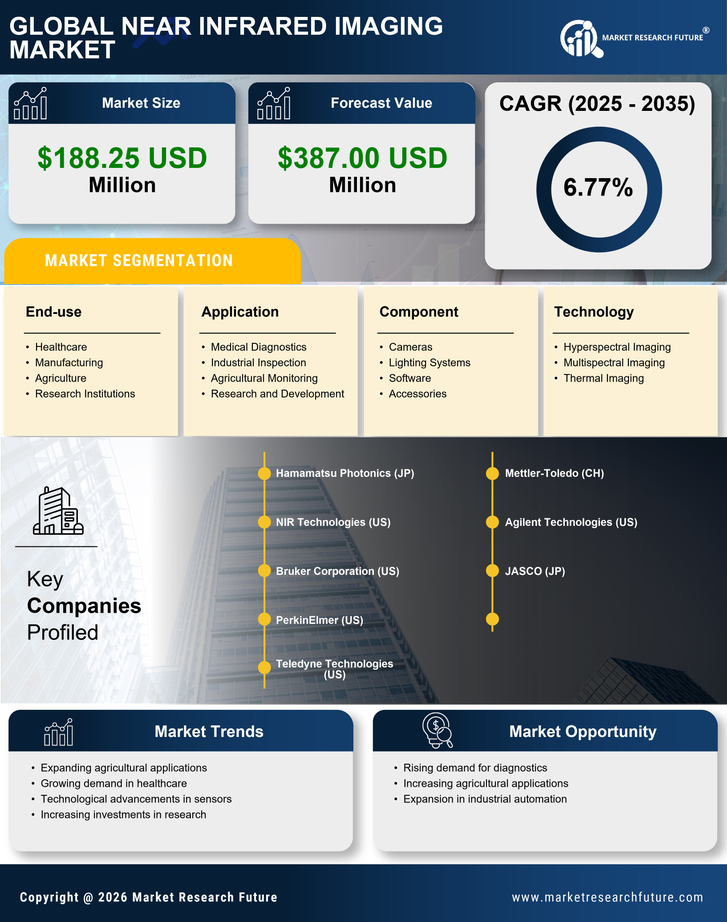
  • Medical Diagnostics
  • Industrial Inspection
  • Agricultural Monitoring
  • Research and Development

Food, Beverages & Nutrition By Component (USD Million, 2025-2035)

  • Cameras
  • Lighting Systems
  • Software
  • Accessories

Food, Beverages & Nutrition By End-use (USD Million, 2025-2035)

  • Healthcare
  • Manufacturing
  • Agriculture
  • Research Institutions

Food, Beverages & Nutrition By Technology (USD Million, 2025-2035)

  • Hyperspectral Imaging
  • Multispectral Imaging
  • Thermal Imaging

Compare Licence

×
Features License Type
Single User Multiuser License Enterprise User
Price $4,950 $5,950 $7,250
Maximum User Access Limit 1 User Upto 10 Users Unrestricted Access Throughout the Organization
Free Customization
Direct Access to Analyst
Deliverable Format
Platform Access
Discount on Next Purchase 10% 15% 15%
Printable Versions