Request Free Sample ×

Kindly complete the form below to receive a free sample of this Report

* Please use a valid business email

Leading companies partner with us for data-driven Insights

clients tt-cursor
Hero Background

China Laxatives Market

ID: MRFR/HC/43488-HCR
200 Pages
Satyendra Maurya
Last Updated: April 06, 2026

China Laxatives Market Research Report By Route of Administration (Oral, Rectal), By Indication (Chronic Constipation, Irritable Bowel Syndrome, Others), By Drug Type (Hyperosmotic, Bulk-Forming, Stool Softeners, Lubricants, Stimulants) and By End User (Hospitals Clinics, Research Institutes, Others) - Growth & Industry Forecast 2025 To 2035

Share:
Download PDF ×

We do not share your information with anyone. However, we may send you emails based on your report interest from time to time. You may contact us at any time to opt-out.

China Laxatives Market Infographic
Purchase Options
  1. 1 SECTION I: EXECUTIVE SUMMARY AND KEY HIGHLIGHTS
    1. 1.1 EXECUTIVE SUMMARY
      1. 1.1.1 Market Overview
      2. 1.1.2 Key Findings
      3. 1.1.3 Market Segmentation
      4. 1.1.4 Competitive Landscape
      5. 1.1.5 Challenges and Opportunities
      6. 1.1.6 Future Outlook
  2. 2 SECTION II: SCOPING, METHODOLOGY AND MARKET STRUCTURE
    1. 2.1 MARKET INTRODUCTION
      1. 2.1.1 Definition
      2. 2.1.2 Scope of the study
        1. 2.1.2.1 Research Objective
        2. 2.1.2.2 Assumption
        3. 2.1.2.3 Limitations
    2. 2.2 RESEARCH METHODOLOGY
      1. 2.2.1 Overview
      2. 2.2.2 Data Mining
      3. 2.2.3 Secondary Research
      4. 2.2.4 Primary Research
        1. 2.2.4.1 Primary Interviews and Information Gathering Process
        2. 2.2.4.2 Breakdown of Primary Respondents
      5. 2.2.5 Forecasting Model
      6. 2.2.6 Market Size Estimation
        1. 2.2.6.1 Bottom-Up Approach
        2. 2.2.6.2 Top-Down Approach
      7. 2.2.7 Data Triangulation
      8. 2.2.8 Validation
  3. 3 SECTION III: QUALITATIVE ANALYSIS
    1. 3.1 MARKET DYNAMICS
      1. 3.1.1 Overview
      2. 3.1.2 Drivers
      3. 3.1.3 Restraints
      4. 3.1.4 Opportunities
    2. 3.2 MARKET FACTOR ANALYSIS
      1. 3.2.1 Value chain Analysis
      2. 3.2.2 Porter's Five Forces Analysis
        1. 3.2.2.1 Bargaining Power of Suppliers
        2. 3.2.2.2 Bargaining Power of Buyers
        3. 3.2.2.3 Threat of New Entrants
        4. 3.2.2.4 Threat of Substitutes
        5. 3.2.2.5 Intensity of Rivalry
      3. 3.2.3 COVID-19 Impact Analysis
        1. 3.2.3.1 Market Impact Analysis
        2. 3.2.3.2 Regional Impact
        3. 3.2.3.3 Opportunity and Threat Analysis
  4. 4 SECTION IV: QUANTITATIVE ANALYSIS
    1. 4.1 Medical Device, BY Route of Administration (USD Million)
      1. 4.1.1 Oral
      2. 4.1.2 Rectal
    2. 4.2 Medical Device, BY Indication (USD Million)
      1. 4.2.1 Chronic Constipation
      2. 4.2.2 Irritable Bowel Syndrome
      3. 4.2.3 Others
    3. 4.3 Medical Device, BY Drug Type (USD Million)
      1. 4.3.1 Hyperosmotic
      2. 4.3.2 Bulk-Forming
      3. 4.3.3 Stool Softeners
      4. 4.3.4 Lubricants
      5. 4.3.5 Stimulants
    4. 4.4 Medical Device, BY End User (USD Million)
      1. 4.4.1 Hospitals & Clinics
      2. 4.4.2 Research Institutes
      3. 4.4.3 Others
  5. 5 SECTION V: COMPETITIVE ANALYSIS
    1. 5.1 Competitive Landscape
      1. 5.1.1 Overview
      2. 5.1.2 Competitive Analysis
      3. 5.1.3 Market share Analysis
      4. 5.1.4 Major Growth Strategy in the Medical Device
      5. 5.1.5 Competitive Benchmarking
      6. 5.1.6 Leading Players in Terms of Number of Developments in the Medical Device
      7. 5.1.7 Key developments and growth strategies
        1. 5.1.7.1 New Product Launch/Service Deployment
        2. 5.1.7.2 Merger & Acquisitions
        3. 5.1.7.3 Joint Ventures
      8. 5.1.8 Major Players Financial Matrix
        1. 5.1.8.1 Sales and Operating Income
        2. 5.1.8.2 Major Players R&D Expenditure. 2023
    2. 5.2 Company Profiles
      1. 5.2.1 Bayer AG (DE)
        1. 5.2.1.1 Financial Overview
        2. 5.2.1.2 Products Offered
        3. 5.2.1.3 Key Developments
        4. 5.2.1.4 SWOT Analysis
        5. 5.2.1.5 Key Strategies
      2. 5.2.2 Johnson & Johnson (US)
        1. 5.2.2.1 Financial Overview
        2. 5.2.2.2 Products Offered
        3. 5.2.2.3 Key Developments
        4. 5.2.2.4 SWOT Analysis
        5. 5.2.2.5 Key Strategies
      3. 5.2.3 Procter & Gamble Co (US)
        1. 5.2.3.1 Financial Overview
        2. 5.2.3.2 Products Offered
        3. 5.2.3.3 Key Developments
        4. 5.2.3.4 SWOT Analysis
        5. 5.2.3.5 Key Strategies
      4. 5.2.4 Abbott Laboratories (US)
        1. 5.2.4.1 Financial Overview
        2. 5.2.4.2 Products Offered
        3. 5.2.4.3 Key Developments
        4. 5.2.4.4 SWOT Analysis
        5. 5.2.4.5 Key Strategies
      5. 5.2.5 GlaxoSmithKline plc (GB)
        1. 5.2.5.1 Financial Overview
        2. 5.2.5.2 Products Offered
        3. 5.2.5.3 Key Developments
        4. 5.2.5.4 SWOT Analysis
        5. 5.2.5.5 Key Strategies
      6. 5.2.6 Sanofi S.A. (FR)
        1. 5.2.6.1 Financial Overview
        2. 5.2.6.2 Products Offered
        3. 5.2.6.3 Key Developments
        4. 5.2.6.4 SWOT Analysis
        5. 5.2.6.5 Key Strategies
      7. 5.2.7 Novartis AG (CH)
        1. 5.2.7.1 Financial Overview
        2. 5.2.7.2 Products Offered
        3. 5.2.7.3 Key Developments
        4. 5.2.7.4 SWOT Analysis
        5. 5.2.7.5 Key Strategies
      8. 5.2.8 Pfizer Inc. (US)
        1. 5.2.8.1 Financial Overview
        2. 5.2.8.2 Products Offered
        3. 5.2.8.3 Key Developments
        4. 5.2.8.4 SWOT Analysis
        5. 5.2.8.5 Key Strategies
      9. 5.2.9 AstraZeneca PLC (GB)
        1. 5.2.9.1 Financial Overview
        2. 5.2.9.2 Products Offered
        3. 5.2.9.3 Key Developments
        4. 5.2.9.4 SWOT Analysis
        5. 5.2.9.5 Key Strategies
    3. 5.3 Appendix
      1. 5.3.1 References
      2. 5.3.2 Related Reports
  6. 6 LIST OF FIGURES
    1. 6.1 MARKET SYNOPSIS
    2. 6.2 CHINA MARKET ANALYSIS BY ROUTE OF ADMINISTRATION
    3. 6.3 CHINA MARKET ANALYSIS BY INDICATION
    4. 6.4 CHINA MARKET ANALYSIS BY DRUG TYPE
    5. 6.5 CHINA MARKET ANALYSIS BY END USER
    6. 6.6 KEY BUYING CRITERIA OF MEDICAL DEVICE
    7. 6.7 RESEARCH PROCESS OF MRFR
    8. 6.8 DRO ANALYSIS OF MEDICAL DEVICE
    9. 6.9 DRIVERS IMPACT ANALYSIS: MEDICAL DEVICE
    10. 6.10 RESTRAINTS IMPACT ANALYSIS: MEDICAL DEVICE
    11. 6.11 SUPPLY / VALUE CHAIN: MEDICAL DEVICE
    12. 6.12 MEDICAL DEVICE, BY ROUTE OF ADMINISTRATION, 2024 (% SHARE)
    13. 6.13 MEDICAL DEVICE, BY ROUTE OF ADMINISTRATION, 2024 TO 2035 (USD Million)
    14. 6.14 MEDICAL DEVICE, BY INDICATION, 2024 (% SHARE)
    15. 6.15 MEDICAL DEVICE, BY INDICATION, 2024 TO 2035 (USD Million)
    16. 6.16 MEDICAL DEVICE, BY DRUG TYPE, 2024 (% SHARE)
    17. 6.17 MEDICAL DEVICE, BY DRUG TYPE, 2024 TO 2035 (USD Million)
    18. 6.18 MEDICAL DEVICE, BY END USER, 2024 (% SHARE)
    19. 6.19 MEDICAL DEVICE, BY END USER, 2024 TO 2035 (USD Million)
    20. 6.20 BENCHMARKING OF MAJOR COMPETITORS
  7. 7 LIST OF TABLES
    1. 7.1 LIST OF ASSUMPTIONS
  8. 7.1.1
    1. 7.2 China MARKET SIZE ESTIMATES; FORECAST
      1. 7.2.1 BY ROUTE OF ADMINISTRATION, 2025-2035 (USD Million)
      2. 7.2.2 BY INDICATION, 2025-2035 (USD Million)
      3. 7.2.3 BY DRUG TYPE, 2025-2035 (USD Million)
      4. 7.2.4 BY END USER, 2025-2035 (USD Million)
    2. 7.3 PRODUCT LAUNCH/PRODUCT DEVELOPMENT/APPROVAL
  9. 7.3.1
    1. 7.4 ACQUISITION/PARTNERSHIP
  10. 7.4.1

China Medical Device Market Segmentation

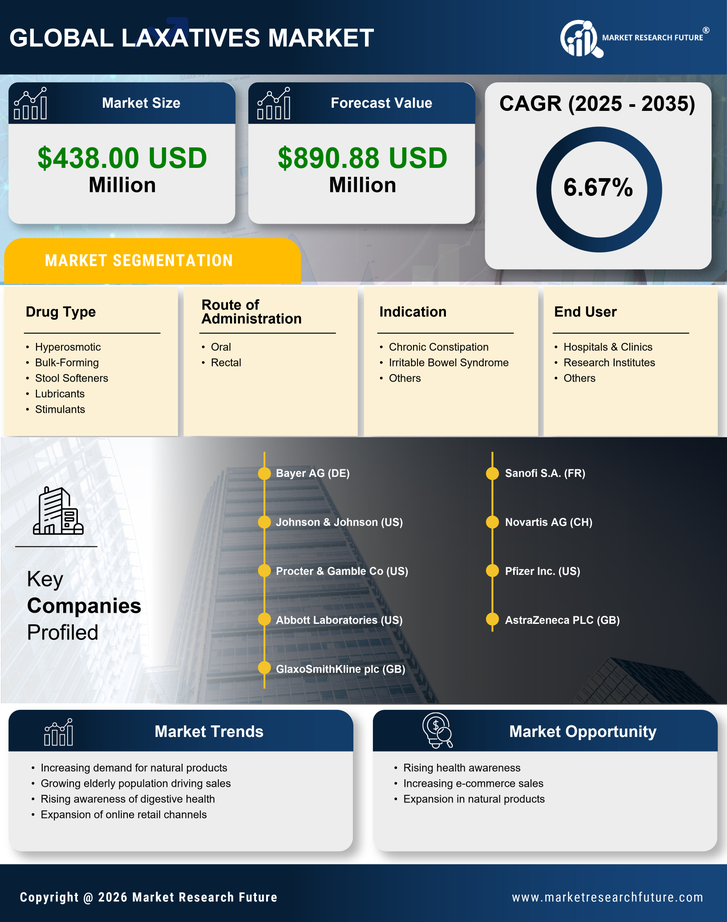
Medical Device By Route of Administration (USD Million, 2025-2035)

  • Oral
  • Rectal

Medical Device By Indication (USD Million, 2025-2035)

  • Chronic Constipation
  • Irritable Bowel Syndrome
  • Others

Medical Device By Drug Type (USD Million, 2025-2035)

  • Hyperosmotic
  • Bulk-Forming
  • Stool Softeners
  • Lubricants
  • Stimulants

Medical Device By End User (USD Million, 2025-2035)

  • Hospitals & Clinics
  • Research Institutes
  • Others

Compare Licence

×
Features License Type
Single User Multiuser License Enterprise User
Price $4,950 $5,950 $7,250
Maximum User Access Limit 1 User Upto 10 Users Unrestricted Access Throughout the Organization
Free Customization
Direct Access to Analyst
Deliverable Format
Platform Access
Discount on Next Purchase 10% 15% 15%
Printable Versions