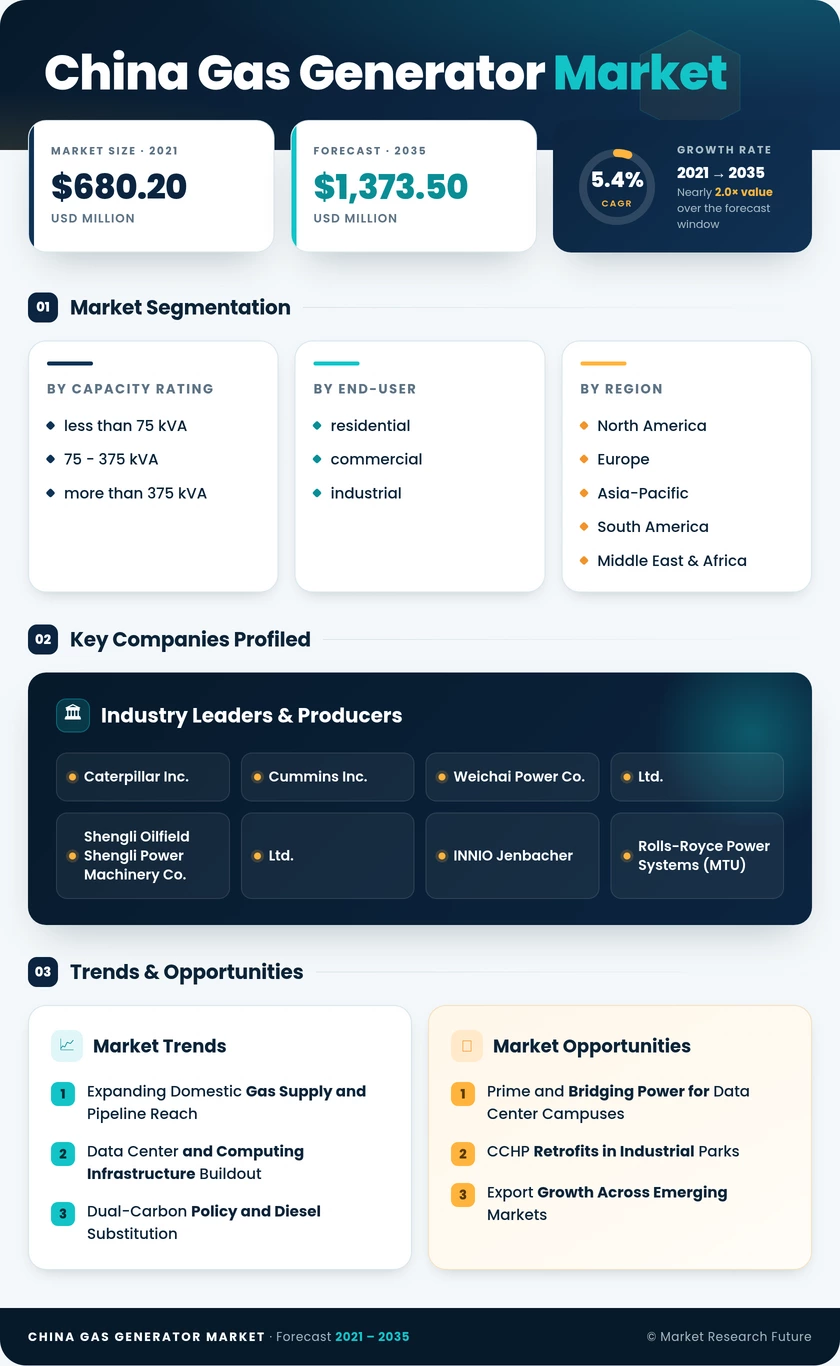
China Gas Generator Market (2026 - 2035)

ID: MRFR/EnP/53801-HCR 200 Pages Garvit Vyas Last Updated: October 31, 2026
China Gas Generator Market Research Report By Capacity Rating (Less than 75 kVA, 75–375 kVA, More than 375 kVA), By End-user (Residential, Commercial, Industrial) - Forecast to 2035
China Gas Generator Market
Market Size
Forecast Period2026-2035
CAGR (2026-2035)5.4%
2025 Market SizeUSD 812.4 million
2035 Market SizeUSD 1,373.5 million
Key Players
Caterpillar Inc.
Cummins Inc.
Weichai Power Co., Ltd.
Shengli Oilfield Shengli Power Machinery Co., Ltd.
INNIO Jenbacher
Rolls-Royce Power Systems
Opportunities
  • Prime and Bridging Power for Data Center Campuses
  • CCHP Retrofits in Industrial Parks
  • Export Growth Across Emerging Markets
  1. 1 Market Summary | |
  2. 2 Key Report Takeaways | |
    1. 2.1 By Capacity Rating | |
    2. 2.2 By End-user | |
    3. 2.3 By Region | |
  3. 3 Market Size and Forecast (2021–2035) | |
  4. 4 Driver Impact Analysis | |
    1. 4.1 Expanding Domestic Gas Supply and Pipeline Reach | |
    2. 4.2 Data Center and Computing Infrastructure Buildout | |
    3. 4.3 Dual-Carbon Policy and Diesel Substitution | |
    4. 4.4 Distributed Energy and CCHP Adoption in Industrial Parks | |
    5. 4.5 Stricter Emission Rules Raising Diesel Genset Costs | |
    6. 4.6 Coal Mine Methane and Associated Gas Utilization | |
  5. 5 Restraints Impact Analysis | |
    1. 5.1 Incomplete Gas Pipeline Coverage in Rural and Western Areas | |
    2. 5.2 Gas Price Volatility and LNG Import Exposure | |
    3. 5.3 Higher Upfront Cost Versus Diesel Gensets | |
    4. 5.4 Competition from Battery Energy Storage | |
    5. 5.5 Load-Acceptance Limits in Emergency Standby Duty | |
  6. 6 Opportunities | |
    1. 6.1 Prime and Bridging Power for Data Center Campuses | |
    2. 6.2 CCHP Retrofits in Industrial Parks | |
    3. 6.3 Export Growth Across Emerging Markets | |
    4. 6.4 Power-as-a-Service and Monitoring Data Models | |
    5. 6.5 Virtual-Pipeline Fuel Supply for Off-Grid Sites | |
  7. 7 Regional Market Share and Country-Level Analysis | |
    1. 7.1 North America | | |
      1. 7.1.1 US | | |
      2. 7.1.2 Canada | | |
      3. 7.1.3 Mexico | |
    2. 7.2 Europe | | |
      1. 7.2.1 Germany | | |
      2. 7.2.2 UK | | |
      3. 7.2.3 France | | |
      4. 7.2.4 Italy | | |
      5. 7.2.5 Spain | | |
      6. 7.2.6 Nordic Countries | | |
      7. 7.2.7 Russia | | |
      8. 7.2.8 Rest of Europe | |
    3. 7.3 Asia-Pacific | | |
      1. 7.3.1 China | | |
      2. 7.3.2 India | | |
      3. 7.3.3 Japan | | |
      4. 7.3.4 South Korea | | |
      5. 7.3.5 ASEAN | | |
      6. 7.3.6 Rest of Asia-Pacific | |
    4. 7.4 South America | | |
      1. 7.4.1 Brazil | | |
      2. 7.4.2 Argentina | | |
      3. 7.4.3 Rest of South America | |
    5. 7.5 Middle East & Africa | | |
      1. 7.5.1 Saudi Arabia | | |
      2. 7.5.2 UAE | | |
      3. 7.5.3 South Africa | | |
      4. 7.5.4 Egypt | | |
      5. 7.5.5 Rest of MEA | |
  8. 8 Future Outlook (2026–2035) | |
    1. 8.1 Hydrogen-Ready Engine Platforms | |
    2. 8.2 Digital Fleet Operations and Predictive Maintenance | |
    3. 8.3 AI-Driven Power Demand | |
    4. 8.4 Methane Accountability and ESG Reporting | |
  9. 9 Segmentation Analysis | |
    1. 9.1 By Capacity Rating | | |
      1. 9.1.1 less than 75 kVA | | |
      2. 9.1.2 75 - 375 kVA | | |
      3. 9.1.3 more than 375 kVA | |
    2. 9.2 By End-user | | |
      1. 9.2.1 residential | | |
      2. 9.2.2 commercial | | |
      3. 9.2.3 industrial | |
  10. 10 Competitive Landscape | |
    1. 10.1 Market Concentration Analysis | |
    2. 10.2 Competitive Benchmarking Matrix | |
    3. 10.3 Company Profiles | | |
      1. 10.3.1 Caterpillar Inc. | | |
      2. 10.3.2 Cummins Inc. | | |
      3. 10.3.3 Weichai Power Co., Ltd. | | |
      4. 10.3.4 CNPC Jichai Power Equipment Company | | |
      5. 10.3.5 Shengli Oilfield Shengli Power Machinery Co., Ltd. | | |
      6. 10.3.6 INNIO Jenbacher | | |
      7. 10.3.7 Rolls-Royce Power Systems (MTU) | | |
      8. 10.3.8 Rehlko (formerly Kohler Energy) | | |
      9. 10.3.9 Wärtsilä Corporation | | |
      10. 10.3.10 Guangxi Yuchai Machinery Co., Ltd. | | |
      11. 10.3.11 Generac Holdings Inc. | |
  11. 11 Recent News & Developments | |
  12. 12 Report Scope and Methodology | |
  13. 13 Detailed Sources and Citations | |
  14. 14 Frequently Asked Questions (FAQs) | | LIST OF TABLES | |
  15. TABLE 1 Market Size and Forecast, by Revenue (USD million), 2021–2035 | |
  16. TABLE 2 Driver Impact Analysis | |
  17. TABLE 3 Restraints Impact Analysis | |
  18. TABLE 4 Regional Summary, 2025 | |
  19. TABLE 5 North America, by Country, 2025 | |
  20. TABLE 6 Europe, by Country, 2025 | |
  21. TABLE 7 Asia-Pacific, by Country, 2025 | |
  22. TABLE 8 South America, by Country, 2025 | |
  23. TABLE 9 Middle East & Africa, by Country, 2025 | |
  24. TABLE 10 Market Size, by Capacity Rating, 2025 | |
  25. TABLE 11 Market Size, by End-user, 2025 | |
  26. TABLE 12 Competitive Benchmarking Matrix | |
  27. TABLE 13 Report Scope and Methodology | |
  28. TABLE 14 Detailed Sources and Citations | |
  29. TABLE 15 Segmentation Quick Reference | | LIST OF FIGURES | |
  30. FIGURE 1 Market Dynamics Overview – Drivers, Restraints and Opportunities | |
  31. FIGURE 2 Industry Value Chain Analysis | |
  32. FIGURE 3 Porter's Five Forces Analysis | |
  33. FIGURE 4 Market Size Trend, 2021–2035 (USD million) | |
  34. FIGURE 5 Revenue Share, by Capacity Rating, 2025 | |
  35. FIGURE 6 Revenue Share, by End-user, 2025 | |
  36. FIGURE 7 Regional Revenue Share, 2025 | |
  37. FIGURE 8 Competitive Landscape – Estimated Revenue Share Ranges

Segmentation Quick Reference

DimensionSub-SegmentsDominant SegmentFastest Growing Segment
By Capacity Ratingless than 75 kVA; 75 - 375 kVA; more than 375 kVAmore than 375 kVA (47.8% share)75 - 375 kVA (6.1% CAGR)
By End-userresidential; commercial; industrialindustrial (52.6% share)commercial (6.0% CAGR)
By RegionNorth America; Europe; Asia-Pacific; South America; Middle East & AfricaAsia-Pacific (79.4% share)Middle East & Africa (7.1% CAGR)

Market Segmentation Overview

By Capacity Rating

Sub-SegmentKey Trend
less than 75 kVABattery storage competition in short-duration backup
75 - 375 kVAContainerized sets for hospitals, hotels and edge data centers
more than 375 kVAMulti-megawatt CCHP and data center campus power

The more than 375 kVA class leads the China Gas Generator Market with a 47.8% share because CCHP plants, oilfields and data center campuses need multi-megawatt engines whose efficiency offsets their capital cost. The 75 - 375 kVA band grows fastest at a 6.1% CAGR, since PUE mandates and energy-intensity targets push mid-sized commercial sites toward packaged gas sets with heat recovery. The less than 75 kVA class trails, constrained by lithium battery systems that now cover most short-outage needs.

By End-user

Sub-SegmentKey Trend
residentialPremium homes in pipeline-served suburbs
commercialData center and hospital adoption under efficiency mandates
industrialCoal boiler replacement and methane-to-power projects

Industrial users lead with a 52.6% share, driven by long annual run hours in manufacturing parks, oilfields and coal mines where waste methane and coal boiler phase-outs make gas the default fuel. Commercial buyers grow fastest at a 6.0% CAGR as data centers and hospitals pursue PUE and energy-intensity compliance. Residential demand remains small and confined to premium homes with pipeline gas access.


Download PDF ×

We do not share your information with anyone. However, we may send you emails based on your report interest from time to time. You may contact us at any time to opt-out.