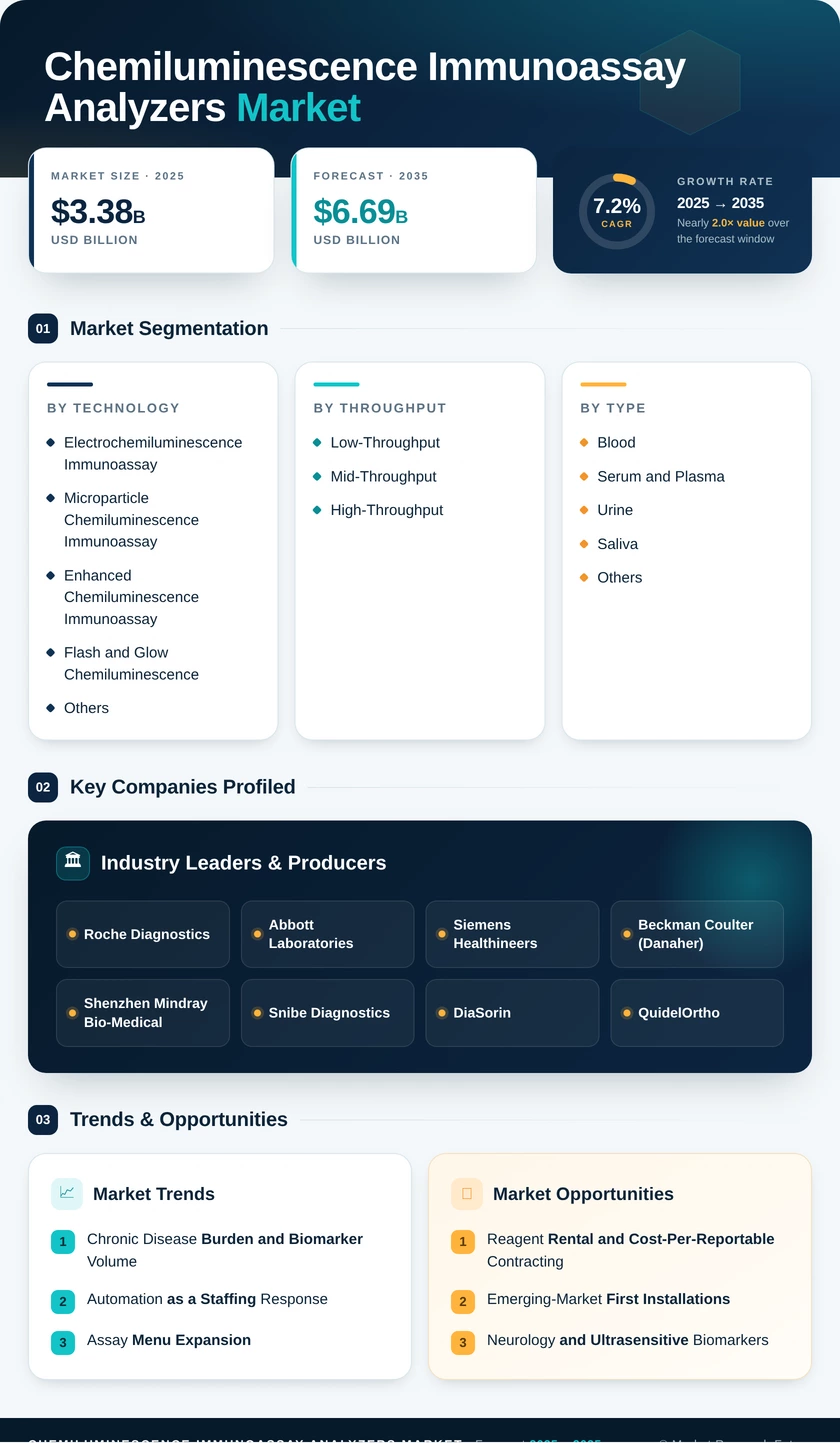
Chemiluminescence Immunoassay Analyzers Market (2026 - 2035)

Chemiluminescence Immunoassay (CLIA) Analyzers Market Research Report Information By Type (High Throughput, Medium Throughput, and Low Throughput), By Product (Reagents, Analyzer, and Consumables), By Application (Oncology & Endocrinology, Hepatitis and Retroviruses, Cardiac Markers, Infectious Disease, Bone and Mineral Disorders, Auto-Immune Diseases, Allergy, GI Stool Testing, Drug Discovery and Development), By End User (Hospitals & Clinics, Medical & Diagnostic Laboratories, and Pharmaceutical Companies) And By Region (North America, Europe, Asia-Pacific, And Rest Of The World) - Growth & Industry Forecast 2025 To 2035

Forecast Period
2026-2035
CAGR
7.2%
2025 Market Size
USD 3.38 Billion
2035 Market Size
USD 6.69 Billion
Healthcare ● Updated August 2026 Report ID: MRFR/HC/7311-CR | Pages: 78 | Author: Satyendra Maurya, Rahul Gotadki
  1. 1 Market Overview |
    1. 1.1 Study Assumptions & Market Definition |
    2. 1.2 Scope of the Study |
    3. 1.3 Research Methodology
  2. 2 Market Summary & Key Report Takeaways |
    1. 2.1 By Technology |
    2. 2.2 By Sector |
    3. 2.3 By Geography
  3. 3 Market Size & Forecast (2021–2035) |
    1. 3.1 Historical Market Size (2021–2024) |
    2. 3.2 Base Year Estimate (2025) |
    3. 3.3 Forecast Market Size (2026–2035) |
    4. 3.4 Year-over-Year Growth Analysis
  4. 4 Market Dynamics — Driver Impact Analysis |
    1. 4.1 Chronic Disease Burden and Biomarker Volume |
    2. 4.2 Automation as a Staffing Response |
    3. 4.3 Assay Menu Expansion |
    4. 4.4 Emerging-Market Public Procurement
  5. 5 Market Dynamics — Restraints Impact Analysis |
    1. 5.1 European Regulatory Compliance Costs |
    2. 5.2 Tender-Driven Price Compression |
    3. 5.3 Capital and Consumable Lock-In
  6. 6 Market Opportunity Analysis |
    1. 6.1 Reagent Rental and Cost-Per-Reportable Contracting |
    2. 6.2 Emerging-Market First Installations |
    3. 6.3 Neurology and Ultrasensitive Biomarkers |
    4. 6.4 Connectivity and Diagnostic Data Monetization |
    5. 6.5 Decentralized Satellite Laboratories |
    6. 6.6 Industry Value Chain Analysis |
    7. 6.7 Porter's Five Forces Analysis
  7. 7 Regional Market Share & Country-Level Analysis |
    1. 7.1 North America | |
      1. 7.1.1 US | |
      2. 7.1.2 Canada | |
      3. 7.1.3 Mexico |
    2. 7.2 Europe | |
      1. 7.2.1 Germany | |
      2. 7.2.2 UK | |
      3. 7.2.3 France | |
      4. 7.2.4 Italy | |
      5. 7.2.5 Spain | |
      6. 7.2.6 Nordic Countries | |
      7. 7.2.7 Russia | |
      8. 7.2.8 Rest of Europe |
    3. 7.3 Asia-Pacific | |
      1. 7.3.1 China | |
      2. 7.3.2 India | |
      3. 7.3.3 Japan | |
      4. 7.3.4 South Korea | |
      5. 7.3.5 ASEAN | |
      6. 7.3.6 Rest of Asia-Pacific |
    4. 7.4 South America | |
      1. 7.4.1 Brazil | |
      2. 7.4.2 Argentina | |
      3. 7.4.3 Rest of South America |
    5. 7.5 Middle East & Africa | |
      1. 7.5.1 Saudi Arabia | |
      2. 7.5.2 UAE | |
      3. 7.5.3 South Africa | |
      4. 7.5.4 Egypt | |
      5. 7.5.5 Rest of Middle East & Africa
  8. 8 Future Outlook (2026–2035) |
    1. 8.1 Machine Learning in Result Interpretation |
    2. 8.2 Assay Economics and Platform Lock-In |
    3. 8.3 Ultrasensitive and Multiplex Capability |
    4. 8.4 Sustainability and Consumable Waste
  9. 9 Market Segmentation Analysis |
    1. 9.1 By Technology | |
      1. 9.1.1 Electrochemiluminescence Immunoassay | |
      2. 9.1.2 Microparticle Chemiluminescence Immunoassay | |
      3. 9.1.3 Enhanced Chemiluminescence Immunoassay | |
      4. 9.1.4 Flash and Glow Chemiluminescence | |
      5. 9.1.5 Others |
    2. 9.2 By Throughput | |
      1. 9.2.1 Low-Throughput | |
      2. 9.2.2 Mid-Throughput | |
      3. 9.2.3 High-Throughput |
    3. 9.3 By Sample Type | |
      1. 9.3.1 Blood | |
      2. 9.3.2 Serum and Plasma | |
      3. 9.3.3 Urine | |
      4. 9.3.4 Saliva | |
      5. 9.3.5 Others |
    4. 9.4 By Application | |
      1. 9.4.1 Therapeutic Drug Monitoring and Toxicology | |
      2. 9.4.2 Infectious Diseases | |
      3. 9.4.3 Endocrinology | |
      4. 9.4.4 Oncology | |
      5. 9.4.5 Cardiology | |
      6. 9.4.6 Others |
    5. 9.5 By End User | |
      1. 9.5.1 Hospitals | |
      2. 9.5.2 Diagnostic and Reference Laboratories | |
      3. 9.5.3 Academic and Research Institutes | |
      4. 9.5.4 Pharmaceutical and Biotechnology Companies | |
      5. 9.5.5 Others |
    6. 9.6 By Connectivity | |
      1. 9.6.1 LIS and HL7 Integration | |
      2. 9.6.2 Middleware Integration | |
      3. 9.6.3 Standalone / Non-Integrated | |
      4. 9.6.4 Remote Monitoring and IoT | |
      5. 9.6.5 Cybersecurity and Compliance Features
  10. 10 Competitive Landscape |
    1. 10.1 Market Concentration Analysis (2026) |
    2. 10.2 Competitive Benchmarking Matrix |
    3. 10.3 Company Profiles | |
      1. 10.3.1 Roche Diagnostics | |
      2. 10.3.2 Abbott Laboratories | |
      3. 10.3.3 Siemens Healthineers | |
      4. 10.3.4 Beckman Coulter (Danaher) | |
      5. 10.3.5 Shenzhen Mindray Bio-Medical | |
      6. 10.3.6 Snibe Diagnostics | |
      7. 10.3.7 DiaSorin | |
      8. 10.3.8 QuidelOrtho | |
      9. 10.3.9 Autobio Diagnostics | |
      10. 10.3.10 bioMérieux | |
      11. 10.3.11 Fujirebio (H.U. Group) | |
      12. 10.3.12 Maccura Biotechnology
  11. 11 Recent News & Developments
  12. 12 Report Scope & Methodology |
    1. 12.1 Study Period & Base Year |
    2. 12.2 Valuation Currency & Conversion Assumptions |
    3. 12.3 Abbreviations
  13. 13 Detailed Sources & Citations
  14. 14 Frequently Asked Questions
  15. 15 LIST OF TABLES |
  16. TABLE 1 Global Market Size & Forecast, by Revenue (USD Billion), 2021–2035 |
  17. TABLE 2 Global Market — Year-over-Year Growth Analysis, 2021–2035 |
  18. TABLE 3 Driver Impact Analysis Matrix, 2026–2035 |
  19. TABLE 4 Restraint Impact Analysis Matrix, 2026–2035 |
  20. TABLE 5 Global Market Size, by Region, 2021–2035 (USD Billion) |
  21. TABLE 6 North America Market Size, by Country, 2021–2035 (USD Billion) |
  22. TABLE 7 Europe Market Size, by Country, 2021–2035 (USD Billion) |
  23. TABLE 8 Asia-Pacific Market Size, by Country, 2021–2035 (USD Billion) |
  24. TABLE 9 South America Market Size, by Country, 2021–2035 (USD Billion) |
  25. TABLE 10 Middle East & Africa Market Size, by Country, 2021–2035 (USD Billion) |
  26. TABLE 11 Global Market Size, by Technology, 2021–2035 (USD Billion) |
  27. TABLE 12 Global Market Size, by Throughput, 2021–2035 (USD Billion) |
  28. TABLE 13 Global Market Size, by Sample Type, 2021–2035 (USD Billion) |
  29. TABLE 14 Global Market Size, by Application, 2021–2035 (USD Billion) |
  30. TABLE 15 Global Market Size, by End User, 2021–2035 (USD Billion) |
  31. TABLE 16 Global Market Size, by Connectivity, 2021–2035 (USD Billion) |
  32. TABLE 17 North America Market Size, by Technology and Application, 2021–2035 (USD Billion) |
  33. TABLE 18 Europe Market Size, by Technology and End User, 2021–2035 (USD Billion) |
  34. TABLE 19 Asia-Pacific Market Size, by Throughput and Application, 2021–2035 (USD Billion) |
  35. TABLE 20 South America Market Size, by End User, 2021–2035 (USD Billion) |
  36. TABLE 21 Middle East & Africa Market Size, by Application, 2021–2035 (USD Billion) |
  37. TABLE 22 Competitive Benchmarking Matrix, 2026 |
  38. TABLE 23 Company Profiles — Key Players |
  39. TABLE 24 Recent Developments & Strategic Announcements, 2023–2025 |
  40. TABLE 25 Report Scope & Methodology Summary |
  41. TABLE 26 Detailed Sources & Citations Index
  42. 16 LIST OF FIGURES |
  43. FIGURE 1 Market Dynamics — Drivers, Restraints, Opportunities and Challenges |
  44. FIGURE 2 Industry Value Chain Analysis |
  45. FIGURE 3 Porter's Five Forces Analysis |
  46. FIGURE 4 Global Market Size Trend & Forecast, 2021–2035 (USD Billion) |
  47. FIGURE 5 Year-over-Year Growth Rate Curve, 2022–2035 (%) |
  48. FIGURE 6 Market Share by Technology, 2025 vs 2035 (%) |
  49. FIGURE 7 Market Share by Throughput, 2025 (%) |
  50. FIGURE 8 Market Share by Sample Type, 2025 (%) |
  51. FIGURE 9 Market Share by Application, 2025 vs 2035 (%) |
  52. FIGURE 10 Market Share by End User, 2025 (%) |
  53. FIGURE 11 Market Share by Connectivity, 2025 (%) |
  54. FIGURE 12 Regional Revenue Share Distribution, 2025 (%) |
  55. FIGURE 13 Regional CAGR Comparison, 2026–2035 (%) |
  56. FIGURE 14 North America Country-Level Revenue Split, 2025 (%) |
  57. FIGURE 15 Asia-Pacific Country-Level Revenue Split, 2025 (%) |
  58. FIGURE 16 Competitive Landscape — Estimated Revenue Share Bands, 2026 (%) |
  59. FIGURE 17 Competitive Positioning Quadrant — Menu Breadth vs Throughput |
  60. FIGURE 18 Strategic Developments Timeline, 2023–2025
Share::
Request Free Sample

Segmentation Quick Reference

DimensionSub-SegmentsDominant SegmentFastest Growing Segment
By TechnologyElectrochemiluminescence Immunoassay; Microparticle Chemiluminescence Immunoassay; Enhanced Chemiluminescence Immunoassay; Flash and Glow Chemiluminescence; OthersElectrochemiluminescence ImmunoassayMicroparticle Chemiluminescence Immunoassay
By ThroughputLow-Throughput; Mid-Throughput; High-ThroughputMid-ThroughputHigh-Throughput
By Sample TypeBlood; Serum and Plasma; Urine; Saliva; OthersBloodSaliva
By ApplicationTherapeutic Drug Monitoring and Toxicology; Infectious Diseases; Endocrinology; Oncology; Cardiology; OthersTherapeutic Drug Monitoring and ToxicologyOncology
By End UserHospitals; Diagnostic and Reference Laboratories; Academic and Research Institutes; Pharmaceutical and Biotechnology Companies; OthersHospitalsHospitals
By ConnectivityLIS and HL7 Integration; Cloud-Enabled Middleware; Standalone / Non-IntegratedLIS and HL7 IntegrationCloud-Enabled Middleware
By GeographyNorth America; Europe; Asia-Pacific; South America; Middle East & AfricaNorth AmericaAsia-Pacific


Market Segmentation Overview

By Technology

Sub-SegmentKey Trend
Electrochemiluminescence ImmunoassayMenu depth and calibration stability sustain core-lab preference
Microparticle Chemiluminescence ImmunoassayShorter incubation kinetics lift effective throughput per footprint
Enhanced Chemiluminescence ImmunoassayLarge legacy base drives service and reagent annuity revenue.
Flash and Glow ChemiluminescenceLow acquisition cost supports decentralized clinic placements.
OthersResearch-grade and specialty chemistries with limited clinical scale


Technology selection now hinges on assay availability more than detection chemistry. Laboratories evaluate whether a platform can absorb the next five years of clinical guideline changes without a second instrument purchase.

By Throughput

Sub-SegmentKey Trend
Low-ThroughputSatellite site and stat backup positioning
Mid-ThroughputStandard community hospital configuration worldwide
High-ThroughputReference-lab consolidation drives fastest expansion.


Throughput tiering maps closely to facility size, though hub-and-spoke network design increasingly places low-throughput units at spokes and high-throughput lines at hubs within a single procurement decision.

By Sample Type

Sub-SegmentKey Trend
BloodUniversal specimen underpinning routine panel volume
Serum and PlasmaPreferred matrix for hormone and tumor marker assays
UrineToxicology, pregnancy and drug-of-abuse screening
SalivaNon-invasive cortisol and pediatric testing gains traction
OthersCerebrospinal fluid and swab eluate applications


Matrix diversification broadens clinical reach without new hardware, provided vendors validate additional sample types on existing platforms.

By Application

Sub-SegmentKey Trend
Therapeutic Drug Monitoring and ToxicologyProtocol-mandated repeat testing creates predictable volume
Infectious DiseasesNational screening programmes sustain baseline demand.
EndocrinologyThyroid and fertility panels remain highest-count assays.
OncologyExtended surveillance guidelines accelerate marker volume.
CardiologyHigh-sensitivity troponin adoption reshapes emergency workflows.
OthersAllergy, autoimmune and bone metabolism panels


Application mix determines instrument economics. Facilities with heavy oncology and transplant caseloads justify premium platforms that lower-acuity hospitals cannot.

By End User

Sub-SegmentKey Trend
HospitalsInsourcing of previously referred panels drives dual leadership
Diagnostic and Reference LaboratoriesScale consolidation concentrates purchasing power.
Academic and Research InstitutesBiomarker discovery sustains flexible-platform demand.
Pharmaceutical and Biotechnology CompaniesClinical trial sample volumes require validated throughput.
OthersBlood banks, military and veterinary laboratories


Buyer sophistication is rising. Procurement committees now include informatics and finance leads alongside laboratory directors, shifting evaluation toward multi-year service economics.

By Connectivity

Sub-SegmentKey Trend
LIS and HL7 IntegrationAccreditation and traceability make integration non-optional
Cloud-Enabled MiddlewareRemote QC and predictive service create subscription revenue.
Standalone / Non-IntegratedPersists in small clinics and constrained infrastructure settings


Connectivity has moved from a differentiator to a baseline requirement in accredited settings, with cloud middleware emerging as the principal source of software-attached revenue growth.

By Region

Sub-SegmentKey Trend
North AmericaCore-lab consolidation and shortened replacement cycles
EuropeRegulatory-driven menu rebuilds and network aggregation
Asia-PacificPublic tender volume with sustained price compression
South AmericaPublic network modernization under currency constraints
Middle East & AfricaNational screening legacies and new tertiary hospital builds


Geographic strategy now diverges sharply by tier. Mature markets reward automation and menu depth, while emerging markets reward serviceability, price, and local reagent supply reliability.




Share::
Request Free Sample
Download PDF ×

We do not share your information with anyone. However, we may send you emails based on your report interest from time to time. You may contact us at any time to opt-out.