Ceramic Inks Market (2026 - 2035)

ID: MRFR/CnM/4559-HCR 100 Pages Priya Nagrale Last Updated: October 29, 2026
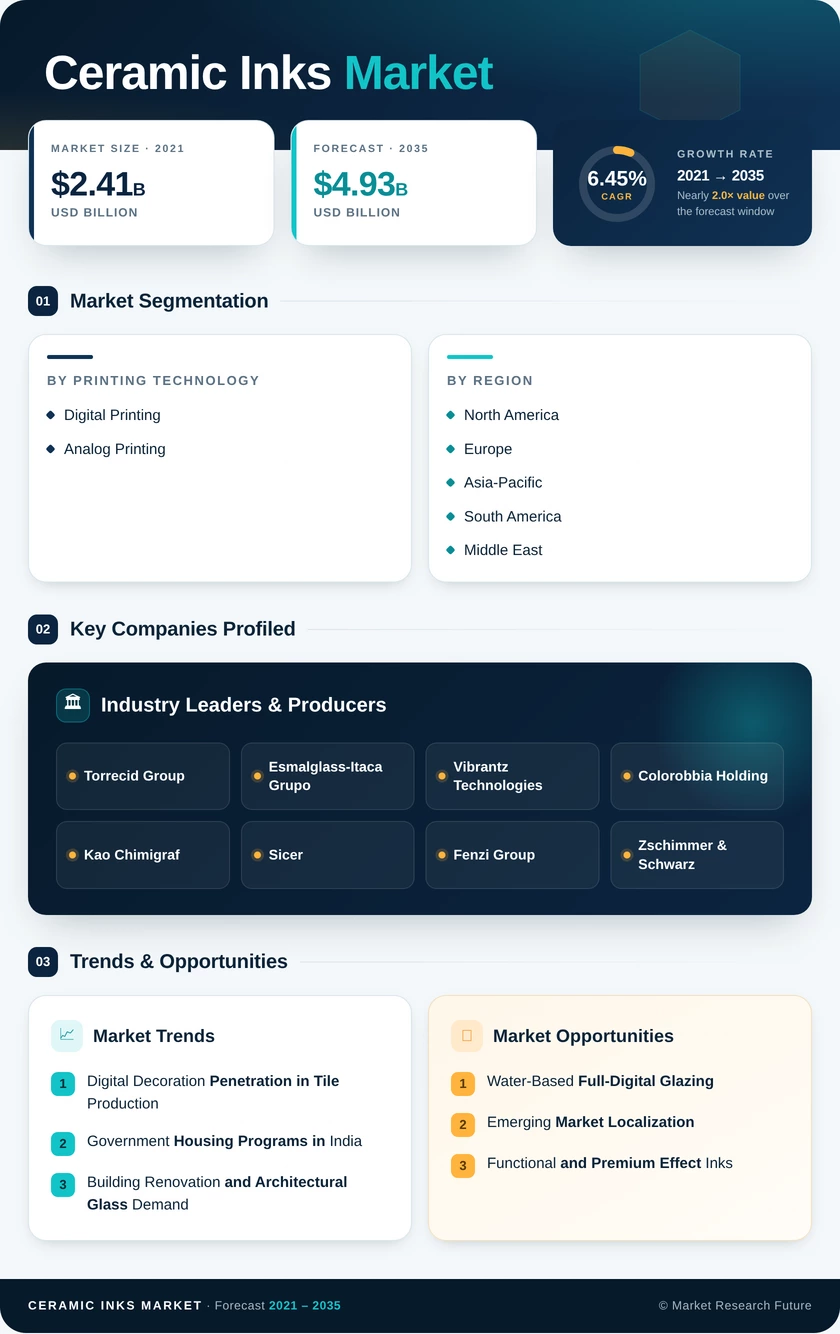
Ceramic Inks Market Research Report Information By Printing Technology (Digital Printing and Analog Printing), And By Region (North America, Europe, Asia-Pacific, and Rest of the World) – Market Forecast Till 2035.
Ceramic Inks Market
Market Size
Forecast Period2026-2035
CAGR (2026-2035)6.45%
2025 Market SizeUSD 2.64 Billion
2035 Market SizeUSD 4.93 Billion
Key Players
Torrecid Group
Esmalglass-Itaca Grupo
Vibrantz Technologies
Colorobbia Holding
Kao Chimigraf
Sicer
Opportunities
  • Water-Based Full-Digital Glazing
  • Emerging Market Localization
  • Functional and Premium Effect Inks
  1. 1 Market Summary | |
  2. 2 Key Report Takeaways | |
    1. 2.1 By Printing Technology | |
    2. 2.2 By Region | |
  3. 3 Market Size and Forecast (2021–2035) | |
    1. 3.1 Historical Market Size (2021–2025) | |
    2. 3.2 Forecast Market Size (2026–2035) | |
    3. 3.3 Year-over-Year Growth Analysis | |
  4. 4 Driver Impact Analysis | |
    1. 4.1 Digital Decoration Penetration in Tile Production | |
    2. 4.2 Government Housing Programs in India | |
    3. 4.3 Building Renovation and Architectural Glass Demand | |
    4. 4.4 Gulf Construction and Homeownership Targets | |
    5. 4.5 Food-Contact Compliance Driving Reformulation | |
    6. 4.6 Low-Emission, Water-Based Ink Transition | |
  5. 5 Restraints Impact Analysis | |
    1. 5.1 Contraction in Global Tile Output | |
    2. 5.2 High Cost of Analog-to-Digital Migration | |
    3. 5.3 Elevated Energy and Carbon Costs in Europe | |
    4. 5.4 Pigment Raw Material Supply Concentration | |
    5. 5.5 Regulatory Scrutiny of Solvents and Substances | |
  6. 6 Opportunities | |
    1. 6.1 Water-Based Full-Digital Glazing | |
    2. 6.2 Emerging Market Localization | |
    3. 6.3 Functional and Premium Effect Inks | |
    4. 6.4 Colour-Management Software and Service-Based Models | |
    5. 6.5 Automotive and Appliance Glass Digitization | |
  7. 7 Regional Market Share and Country-Level Analysis | |
    1. 7.1 North America | | |
      1. 7.1.1 United States | | |
      2. 7.1.2 Canada | | |
      3. 7.1.3 Mexico | |
    2. 7.2 Europe | | |
      1. 7.2.1 Germany | | |
      2. 7.2.2 United Kingdom | | |
      3. 7.2.3 France | | |
      4. 7.2.4 Italy | | |
      5. 7.2.5 Rest of Europe | |
    3. 7.3 Asia-Pacific | | |
      1. 7.3.1 China | | |
      2. 7.3.2 India | | |
      3. 7.3.3 Japan | | |
      4. 7.3.4 South Korea | | |
      5. 7.3.5 Rest of Asia-Pacific | |
    4. 7.4 South America | | |
      1. 7.4.1 Brazil | | |
      2. 7.4.2 Argentina | | |
      3. 7.4.3 Rest of South America | |
    5. 7.5 Middle East and Africa | | |
      1. 7.5.1 Saudi Arabia | | |
      2. 7.5.2 South Africa | | |
      3. 7.5.3 Rest of Middle East and Africa | |
  8. 8 Future Outlook (2026–2035) | |
    1. 8.1 AI-Assisted Colour Management and Closed-Loop Production | |
    2. 8.2 Low-Carbon Firing and Kiln Electrification | |
    3. 8.3 Disclosure-Driven Sustainability | |
    4. 8.4 Supply-Chain Regionalization | |
  9. 9 Segmentation Analysis | |
    1. 9.1 By Printing Technology | | |
      1. 9.1.1 Digital Printing | | |
      2. 9.1.2 Analog Printing | |
  10. 10 Competitive Landscape | |
    1. 10.1 Market Concentration Analysis | |
    2. 10.2 Competitive Benchmarking Matrix | |
    3. 10.3 Company Profiles | | |
      1. 10.3.1 Torrecid Group | | |
      2. 10.3.2 Esmalglass-Itaca Grupo | | |
      3. 10.3.3 Vibrantz Technologies | | |
      4. 10.3.4 Colorobbia Holding | | |
      5. 10.3.5 Kao Chimigraf | | |
      6. 10.3.6 Sicer | | |
      7. 10.3.7 Fenzi Group | | |
      8. 10.3.8 Zschimmer & Schwarz | | |
      9. 10.3.9 Smalticeram | | |
      10. 10.3.10 Tecglass | |
  11. 11 Recent News & Developments | |
  12. 12 Report Scope and Methodology | |
  13. 13 Detailed Sources and Citations | |
  14. 14 Frequently Asked Questions (FAQs) | | LIST OF TABLES | |
  15. TABLE 1 Global Market Size & Forecast, by Revenue (USD Billion), 2021–2035 | |
  16. TABLE 2 Global Market – Year-over-Year Growth Analysis, 2021–2035 | |
  17. TABLE 3 Driver Impact Analysis, 2026–2035 | |
  18. TABLE 4 Restraints Impact Analysis, 2026–2035 | |
  19. TABLE 5 Global Market Size, by Printing Technology, 2021–2035 (USD Billion) | |
  20. TABLE 6 Global Market Size, by Region, 2021–2035 (USD Billion) | |
  21. TABLE 7 North America Market Size, by Country, 2021–2035 (USD Billion) | |
  22. TABLE 8 Europe Market Size, by Country, 2021–2035 (USD Billion) | |
  23. TABLE 9 Asia-Pacific Market Size, by Country, 2021–2035 (USD Billion) | |
  24. TABLE 10 South America Market Size, by Country, 2021–2035 (USD Billion) | |
  25. TABLE 11 Middle East and Africa Market Size, by Country, 2021–2035 (USD Billion) | |
  26. TABLE 12 North America Market Size, by Printing Technology, 2021–2035 (USD Billion) | |
  27. TABLE 13 Europe Market Size, by Printing Technology, 2021–2035 (USD Billion) | |
  28. TABLE 14 Asia-Pacific Market Size, by Printing Technology, 2021–2035 (USD Billion) | |
  29. TABLE 15 South America Market Size, by Printing Technology, 2021–2035 (USD Billion) | |
  30. TABLE 16 Middle East and Africa Market Size, by Printing Technology, 2021–2035 (USD Billion) | |
  31. TABLE 17 Competitive Benchmarking Matrix, 2025 | |
  32. TABLE 18 Recent Developments & Strategic Announcements, 2023–2025 | |
  33. TABLE 19 Report Scope and Methodology | |
  34. TABLE 20 Detailed Sources and Citations | | LIST OF FIGURES | |
  35. FIGURE 1 Market Dynamics Overview – Drivers, Restraints, Opportunities | |
  36. FIGURE 2 Industry Value Chain Analysis | |
  37. FIGURE 3 Porter's Five Forces Analysis | |
  38. FIGURE 4 Global Market Size Trend, 2021–2035 (USD Billion) | |
  39. FIGURE 5 Market Share, by Printing Technology, 2025 vs 2035 (%) | |
  40. FIGURE 6 Market Share, by Region, 2025 (%) | |
  41. FIGURE 7 Regional Growth Comparison, CAGR 2026–2035 (%) | |
  42. FIGURE 8 Country-Level Market Share within Asia-Pacific, 2025 (%) | |
  43. FIGURE 9 Competitive Landscape – Estimated Revenue Share Ranges, 2025 | |
  44. FIGURE 10 Competitive Positioning Matrix

Segmentation Quick Reference

DimensionSub-SegmentsDominant SegmentFastest Growing Segment
By Printing TechnologyDigital Printing; Analog PrintingDigital Printing (7.3% CAGR)Digital Printing (7.3% CAGR)
By RegionNorth America; Europe; Asia-Pacific; South America; Middle East and AfricaAsia-Pacific (52.5% share)Middle East and Africa (8.1% CAGR)

Market Segmentation Overview

By Printing Technology

Sub-SegmentKey Trend
Digital PrintingSingle-pass printers, high-laydown digital glazes, and water-based inks replacing screen decoration
Analog PrintingRetained for long uniform runs in automotive glass, enamelled metal, and legacy tableware lines

Digital Printing leads this dimension and also grows fastest at a 7.3% CAGR, because drop-on-demand printheads eliminate screen changeovers and let tile and glass producers run unlimited designs without tooling costs. Analog Printing holds a 21.6% share where long, uniform runs still favour screen economics, such as automotive black bands. As digital inks gain automotive-grade certification and water-based formulations, Analog Printing's remaining strongholds will continue to narrow through 2035.


Download PDF ×

We do not share your information with anyone. However, we may send you emails based on your report interest from time to time. You may contact us at any time to opt-out.