• Cat-intel
  • MedIntelliX
  • Resources
  • About Us
  • English
    Chinese
    French
    Japanese
    Korean
    German
    Spanish

    Ceramic Coating Market Size

    ID: MRFR/CnM/2081-CR
    449 Pages
    Priya Nagrale
    August 2020

    Ceramic Coating Market Research Report Information By Type (Oxide, Carbide, Nitride, and Others), By Coating Method (Thermal Spray, Physical Vapor Deposition (PVD), Chemical Vapor Deposition (CVD), and Others), By End-Use (Transportation & Automotive, Energy, Aerospace & Defense, Industrial Goods, Healthcare, and Others) And By Region (North America, Europe, Asia-Pacific, And Rest Of Th...

    Share:
    Download PDF ×

    We do not share your information with anyone. However, we may send you emails based on your report interest from time to time. You may contact us at any time to opt-out.

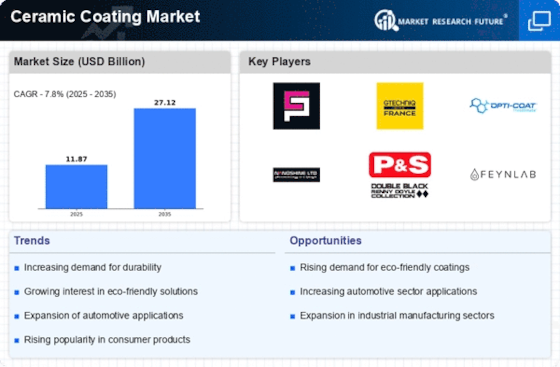
    Ceramic Coating Market Infographic
    $ 4,950.0
    $ 5,950.0
    $ 7,250.0

    Ceramic Coating Size

    Ceramic Coating Market Growth Projections and Opportunities

    The global ceramic coatings market is experiencing a noteworthy surge, anticipated to grow at a CAGR of 5.22% and potentially reach a value of USD 12,594.0 million by the end of the projected period. Volume-wise, the market size hit 1,428.2 kilotons in 2019 and is expected to escalate to 1,844.6 kilotons, exhibiting a CAGR of 4.27%. One of the key driving forces in this surge is the burgeoning demand from the automotive sector. With an increasing emphasis on reducing carbon footprint, along with the swift adoption of electric vehicles, there's a growing need for ceramic coatings. Additionally, the aerospace and defense industries are major contributors to this market due to the expansion of commercial aviation networks, the flourishing tourism sector, economic growth, and heightened air travel. The onset of the COVID-19 pandemic notably highlighted the utility of ceramic coatings, particularly in the healthcare realm. These coatings have seen increased use in healthcare settings. Moreover, their application in the energy and power sector, especially in solar and wind energy, has further stimulated market growth during this evaluation period. However, certain drawbacks linked with the use of ceramic coatings hinder the market's growth trajectory. The global ceramic coatings market is meticulously analyzed based on material type, technology, and end-use industry. Material types encompass oxide, silica, alumina-magnesia, carbide, nitride, and others. Notably, the oxide segment, valued at USD 2,307.7 million in 2019, holds a prominent position in the market. It serves as an undercoating in various protective products like varnishes, paints, and greasepaints. Moreover, their relatively lower cost compared to other materials has propelled their demand in the market. The global ceramic coatings market is divided based on technology into chemical vapor deposition, physical vapor deposition, thermal spray, and other methods. Notably, the physical vapor deposition segment has shown remarkable growth, boasting a robust CAGR of 5.85% during the review period. This surge can be attributed to the manifold advantages of physical vapor deposition coatings, such as enhanced hardness, reduced friction, and improved resistance to oxidation. Furthermore, the market is segmented by end-use industry, encompassing automotive, oil & gas, aerospace & defense, chemical, textile, energy & power, healthcare, and other sectors. In 2019, the automotive segment held more than a 25% share of the global market and displayed a CAGR of 5.35%. The swift adoption of electric vehicles, which utilize ceramic coatings in batteries, is projected to be a significant driver for market growth in this segment. The global ceramic coatings market extends across five major regions: North America, Europe, Asia-Pacific, Latin America, and the Middle East & Africa. Among these regions, Asia-Pacific took the lead, accounting for over 45% of the market share in 2019. This region is expected to showcase the highest CAGR of 6.56% during the review period. The substantial growth here can be attributed to rapid industrial expansion and the improved economic conditions of consumers across various industries in this region.
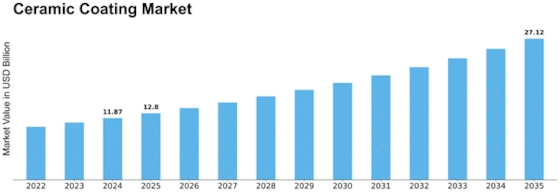
    Ceramic Coating Market Size Graph

    Market Summary

    As per Market Research Future Analysis, the Global Ceramic Coating Market was valued at USD 10.42 Billion in 2022 and is projected to reach USD 19.19 Billion by 2030, growing at a CAGR of 7.8% from 2023 to 2030. The increasing demand for ceramic coatings in the aerospace and defense sectors, particularly for turbine engines, is a significant driver of this growth. The oxide segment dominates the market due to its cost-effectiveness and protective properties, while the thermal spray method is the most widely used application technique. The Asia-Pacific region is expected to lead the market, driven by demand from developing countries like India and China.

    Key Market Trends & Highlights

    Key trends influencing the Ceramic Coating Market include advancements in aerospace applications and increasing solar panel usage.

    • Aerospace & Defense sector growth is driving demand for ceramic coatings, particularly in turbine engines, with temperature reductions of ~1500°C. The oxide segment holds the largest market share due to its affordability and protective capabilities against corrosion. Asia-Pacific is anticipated to dominate the market with a CAGR of 6.5%, fueled by the expanding automotive and steel industries. Thermal spray method is projected to expand rapidly, being the most common technique for wear resistance applications.

    Market Size & Forecast

    2022 Market Size USD 10.42 Billion
    2023 Market Size USD 11.01 Billion
    2030 Market Size USD 19.19 Billion
    CAGR (2023-2030) 7.8%
    Largest Regional Market Asia-Pacific.

    Major Players

    <p>Key players include Morgan Advanced Materials (U.K.), APS Materials, Inc. (U.S.), Bodycote (U.K.), Praxair S.T. Technology, Inc. (U.K.), Aremco Products, Inc. (U.S.), and Akzo Nobel N.V. (The Netherlands).</p>

    Market Trends

    Increasing Demand for Ceramic Coatings in Aerospace & Defense Industry to Fuel the Market.

    The aviation sector primarily includes commercial aircraft manufacture, selling, and operation, whereas defense relies on the nation's need for military weapons and systems designed for land, sea, and air operations. In 2019, the commercial aerospace industry encountered reductions in deliveries due to production-related problems in some aircraft models. For the commercial space industry, 2020 is likely to be a year of major milestones as the sector may see steady investment in new and established space technologies.

    Although the growth of the aerospace & defense industry is primarily driven by the U.S., over the past years few other countries such as China, France, India, Japan, the Middle East & Africa, and the UK have been contributing to the industry's success. 

    Additionally, For aircraft propulsion, auxiliary power systems, and other applications, turbine engines are mostly used. Thermal barrier coatings are isolating ceramic layers that are applied in a heat engine to metallic constituents. The low conductivity ceramic coatings insulate the underlying portion of air-cooled from the engine's hot gases. Ceramic coatings applied on gas turbine engines to airfoils have lowered the temperature of components by as much as 1900 C.

    Ceramic coatings are used as an incremental approach to improving the thrusts and efficiencies of aero-engines and

    gas turbines

    on the ground. These thermally insulating layers require temperature reduction by ~1500 C, which is used to increase the temperature parameters of aero-engine disks and blades and the aero-engine gas turbine parts combustor liners. Failure is not an option for aerospace components. Thus, the major application of these coatings in turbine engines is driving the ceramic coatings market trends.

    <p>The Global Ceramic Coating Market is poised for robust growth, driven by increasing demand across various industries for enhanced durability and performance of materials.</p>

    U.S. Department of Commerce

    Ceramic Coating Market Market Drivers

    Market Growth Projections

    The Global Ceramic Coating Market Industry is on a growth trajectory, with projections indicating a market value of 11.6 USD Billion in 2024 and an anticipated increase to 27.9 USD Billion by 2035. This growth is underpinned by a compound annual growth rate of 8.34% from 2025 to 2035, suggesting a robust demand across various sectors. The expansion is driven by technological advancements, increasing applications in automotive and aerospace industries, and a growing emphasis on sustainability. These factors collectively contribute to a dynamic market landscape, positioning ceramic coatings as a critical component in modern manufacturing and protection solutions.

    Growth in Aerospace Applications

    The aerospace sector significantly contributes to the Global Ceramic Coating Market Industry, as ceramic coatings are utilized for their thermal protection and wear resistance properties. These coatings are essential for components exposed to extreme temperatures and corrosive environments, enhancing the performance and safety of aircraft. The increasing focus on fuel efficiency and performance optimization in aerospace applications is likely to propel the market forward. With the industry's projected growth, the demand for advanced ceramic coatings is expected to rise, further solidifying their role in aerospace innovation.

    Rising Demand in Automotive Sector

    The Global Ceramic Coating Market Industry experiences a notable surge in demand from the automotive sector. As consumers increasingly seek durable and high-performance coatings for vehicles, ceramic coatings provide enhanced protection against scratches, UV rays, and chemical damage. This trend is reflected in the projected market value of 11.6 USD Billion in 2024, driven by the automotive industry's focus on improving vehicle longevity and aesthetics. Manufacturers are investing in advanced ceramic technologies to meet these demands, indicating a robust growth trajectory for the industry.

    Expansion in Industrial Applications

    The Global Ceramic Coating Market Industry is witnessing expansion in industrial applications, particularly in manufacturing and machinery. Ceramic coatings offer exceptional wear resistance, chemical stability, and thermal protection, making them ideal for components in harsh environments. Industries such as oil and gas, power generation, and manufacturing are increasingly adopting ceramic coatings to enhance equipment performance and longevity. This trend is likely to drive market growth, with projections indicating a market value of 27.9 USD Billion by 2035, reflecting the increasing reliance on advanced materials in industrial settings.

    Increasing Environmental Regulations

    The Global Ceramic Coating Market Industry is influenced by stringent environmental regulations aimed at reducing harmful emissions and promoting sustainable practices. Ceramic coatings, known for their eco-friendly properties, are increasingly favored as alternatives to traditional coatings that contain volatile organic compounds. This shift aligns with global sustainability goals and encourages manufacturers to adopt ceramic coatings in various applications. As industries strive to comply with these regulations, the demand for ceramic coatings is expected to rise, contributing to the overall growth of the market.

    Technological Advancements in Coating Processes

    Technological innovations in coating processes are transforming the Global Ceramic Coating Market Industry. Advanced application techniques, such as plasma spraying and chemical vapor deposition, are enhancing the efficiency and effectiveness of ceramic coatings. These innovations allow for more precise application, improved adhesion, and superior performance characteristics. As manufacturers adopt these cutting-edge technologies, the market is poised for growth, with a projected CAGR of 8.34% from 2025 to 2035. This trend indicates a shift towards higher-quality coatings that meet the evolving needs of various industries.

    Market Segment Insights

    Ceramic Coating Type Insights

    <p>The Ceramic Coating market segmentation, based on Type, includes oxide, carbide, nitride, and others. The oxide segment held the major market share and is likely to maintain its dominance during the forecast period. As compared to other counterparts such as carbide and nitride, oxides are cheaper. Oxide ceramic coatings protect metals against corrosion and are used as decorative and electrical insulators. Oxide ceramic coatings can be applied to steel and cast iron as well as to</p>

    <p>, copper, and zinc alloys.</p>

    <p>The carbide segment is expected to expand at a rapid pace during the forecast period. Carbide ceramic coatings are usually used for abrasion, corrosion, galling, and fretting resistance to wear. Using a plasma spray powder device, almost all carbides, oxides, borides, and nitrides can be coated, as the plasma temperature is more than the melting point of any known material.&nbsp;</p>

    Ceramic Coating Method Insights

    <p>Based on Method, the Ceramic Coating market segmentation includes physical vapor deposition (PVD), chemical vapor deposition (CVD), thermal spray, and others. The thermal spray segment held the key share of the market and is projected to expand rapidly during the forecast period. The most common technique of ceramic coatings is thermal spraying as most often they are made of metal oxides and their main use is for wear resistance. The application of thermally sprayed ceramics to metal substrates offers improved surface properties. Examples include thermal or electric insulation and resistance to wear and corrosion.</p>

    <p>Physical vapor deposition (PVD) is a thin-film coating process that usually produces coatings of ceramics with a thickness between 1 and 10μm range. PVD coatings are sometimes stronger and more resistant to corrosion than the electroplating process applied to coatings.</p>

    Ceramic Coating End-Use Insights

    <p>Based on End-Use, the Ceramic Coating market segmentation includes Transportation &amp; Automotive, Energy, Aerospace &amp; Defense, Industrial Goods, Healthcare, and Others. The transportation &amp; automotive segment accounted for the prime share of the market. The ceramic coating is applied to the body of a vehicle and forms a chemical bond with factory paint. When coated, it can be extracted only by abrasion and offers good protection to the vehicle's surface. They can protect the vehicle from dirt, chemical contaminants, and scratches. A ceramic- the coated vehicle is also easier to clean, and its body panels remain smooth and abrasive-free.</p>

    <p>The energy segment also held a significant share of the market. Ceramic coatings are majorly used in solar panels. They protect the solar panel glass from salt spray or mineral deposits that may cause corrosion and staining. These coatings also provide hydrophobic and self-cleaning properties to the surface of solar panels.</p>

    Get more detailed insights about Ceramic Coating Market Research Report - Global Forecast till 2030

    Regional Insights

    By region, the study provides market insights into North America, Europe, Asia-Pacific, and the Rest of the World. APAC is anticipated to dominate the market during the assessment tenure. The region is likely to expand at a CAGR of 6.5% during the prediction time. The growing demand from developing countries such as India, China, and Japan is likely to play a salient role in developing the industry during the forecast period. The rapid expansion of the steel industry and the automotive sector is predicted to augment the market during the projection tenure.

    Furthermore, the surging demand for ceramic coatings from aerospace, oil & gas, and energy power is expected to boost the market size in the coming time.

    Europe is expected to account for the second-largest market share during the forecast period. The expansion of the region can be attributed to the rapid development of large-scale automotive manufacturers and the rising R&D investment from local manufacturers to develop ceramic coatings technology. The region is estimated to acquire a market value of USD 2 billion while flourishing at a CAGR of 3% by 2027.

    North America is estimated to flourish at a CAGR of 4% during the forecast tenure. The region is anticipated to procure a market share of 20% in the coming time. The expansion of the region can be attributed to the rapid development of the automotive sector. Furthermore, the ongoing development in the aerospace sector can be another salient cause that can drive the market growth in the region during the assessment time.

    Key Players and Competitive Insights

    Major market players are spending a lot of money on R&D to increase their product lines, which will help the Ceramic Coating market grow even more. Market participants are also taking a range of strategic initiatives to grow their worldwide footprint, with key market developments such as new product launches, contractual agreements, mergers and acquisitions, increased investments, and collaboration with other organizations. Competitors in the Ceramic Coating industry must offer cost-effective items to expand and survive in an increasingly competitive and rising market environment.

    The major market players are investing a lot of money in R&D to expand their product lines, which will spur further market growth for Ceramic Coating. With significant market development like new product releases, contractual agreements, mergers and acquisitions, increased investments, and collaboration with other organizations, market participants are also undertaking various strategic activities to expand their presence. To grow and thrive in a market climate that is becoming more competitive and growing, competitors in the Ceramic Coating industry must offer affordable products.

    Manufacturing locally to cut operating costs is one of the main business tactics manufacturers use in the Ceramic Coating industry to benefit customers and expand the market sector. The Low-Profile Additives market has recently given medicine some of the most important advantages. Major Ceramic Coating market players, including Morgan Advanced Materials (U.K.), APS Materials, Inc. (U.S.), Bodycote (U.K.), Praxair S.T. Technology, Inc. (U.K.), Aremco Products, Inc. (U.S.), and others, are attempting to increase market demand by funding R&D initiatives.

    APS is a provider of spray coating solutions. It offers metallic, ceramic, and polymer coatings, and thermal sprays for biomedical, automotive, aerospace sectors, and more.

    Also, Aremco Products is a company that develops and produces high-temperature materials. It offers machinable ceramics, ceramic, and graphite adhesives, potting and casting materials, specialty, and protective coatings, mounting adhesives, conductive compounds, temperature tapes, etc. The company caters to the automotive, aerospace, chemical processing, metallurgical, power generation, and semiconductor industries.

    Key Companies in the Ceramic Coating Market market include

    Industry Developments

    • Q1 2024: High-Performance Ceramic Coatings Market Set to Soar with In 2024, several U.S. manufacturers expanded ceramic coating facilities and upgraded plasma spray systems to enhance production efficiency and meet stricter performance standards, driven by increased demand from aerospace engine upgrades and automotive lightweighting initiatives.
    • Q1 2025: High-Performance Ceramic Coatings Market Set to Soar with In 2025, U.S. companies introduced next-generation thermal spray and chemical vapor deposition technologies for ceramic coatings, improving coating adhesion, wear resistance, and high-temperature stability, with growth fueled by the surge in electric vehicle manufacturing and semiconductor production.

    Future Outlook

    Ceramic Coating Market Future Outlook

    <p>The Global Ceramic Coating Market is projected to grow at an 8.34% CAGR from 2024 to 2035, driven by advancements in automotive and aerospace applications, increasing demand for durable coatings, and environmental regulations.</p>

    New opportunities lie in:

    • <p>Develop eco-friendly ceramic coatings to meet regulatory demands. Invest in R&amp;D for high-performance coatings in aerospace applications. Expand distribution networks in emerging markets to capture new customer segments.</p>

    <p>By 2035, the Global Ceramic Coating Market is expected to achieve substantial growth, solidifying its position as a key industry player.</p>

    Market Segmentation

    Ceramic Coating Type Outlook

    • Oxide
    • Carbide
    • Nitride
    • Others

    Ceramic Coating Method Outlook

    • Thermal Spray
    • Physical Vapor Deposition (PVD)
    • Chemical Vapor Deposition (CVD)
    • Others

    Ceramic Coating End-Use Outlook

    • Transportation & Automotive
    • Energy
    • Aerospace & Defense
    • Industrial Goods
    • Healthcare
    • Others

    Ceramic Coating Regional Outlook

    • {"North America"=>["US"
    • "Canada"]}
    • {"Europe"=>["Germany"
    • "France"
    • "UK"
    • "Italy"
    • "Spain"
    • "Rest of Europe"]}
    • {"Asia-Pacific"=>["China"
    • "Japan"
    • "India"
    • "Australia"
    • "South Korea"
    • "Rest of Asia-Pacific"]}
    • {"Rest of the World"=>["Middle East"
    • "Africa"
    • "Latin America"]}

    Report Scope

    Attribute/MetricDetails
    Market Size 2022USD  10.42 Billion
    Market Size 2023USD 11.01 Billion
    Market Size 2030USD 19.19 Billion
    Compound Annual Growth Rate (CAGR)7.8% (2023-2030)
    Base Year2023
    Market Forecast Period2023-2030
    Historical Data2018 & 2020
    Market Forecast UnitsValue (USD Billion)
    Report CoverageRevenue Forecast, Market Competitive Landscape, Growth Factors, and Trends
    Segments CoveredType, Coating Method, End-use, and Region
    Geographies CoveredNorth America, Europe, Asia Pacific, and the Rest of the World
    Countries CoveredThe U.S, Canada, Germany, France, the UK, Italy, Spain, China, Japan, India, Australia, South Korea, and Brazil
    Key Companies ProfiledMorgan Advanced Materials (U.K.), APS Materials, Inc. (U.S.), Bodycote (U.K.), Praxair S.T. Technology, Inc. (U.K.), Aremco Products, Inc. (U.S.), Akzo Nobel N.V. (The Netherlands), Saint-Gobain (France), MBI Coatings (U.S.), Nano-Care Deutschland AG (Germany), Ceramic Polymer GmbH (Germany), Oerlikon Group (Switzerland)
    Key Market OpportunitiesGrowing Penetration of Ceramic Coatings in Emerging Economies to Offer Significant Opportunities.
    Key Market DynamicsRapid Expansion of Transportation & Automotive Sector to Boost the Market.

    Market Highlights

    Author

    Priya Nagrale
    Senior Research Analyst

    She holds an experience of about 6+ years in market research and business consulting, working under the spectrum of information communication technology, telecommunications and semiconductor domains. aarti conceptualizes and implements a scalable business strategy and provides strategic leadership to the clients. her expertise lies in market estimation, competitive intelligence, pipeline analysis, customer assessment, etc.

    Leave a Comment

    Latest Comments

    John Doe

    This is a great article! Really helped me understand the topic better.

    Posted on July 23, 2025, 10:15 AM
    Jane Smith

    Thanks for sharing this. I’ve bookmarked it for later reference.

    Posted on July 22, 2025, 7:45 PM

    FAQs

    How much is the Ceramic Coating market?

    The Ceramic Coating market size was valued at USD 10.42 Billion in 2022.

    What is the growth rate of the Ceramic Coating Market?

    The Ceramic Coatingmarket is projected to grow at a CAGR of 7.8% during the forecast period, 2023-2030.

    Which region held the largest market share in the Ceramic Coating market?

    Asia Pacific had the largest share of the Ceramic Coating market.

    Who are the key players in the Ceramic Coating market?

    The key players in the Ceramic Coating market are Morgan Advanced Materials (U.K.), APS Materials, Inc. (U.S.), Bodycote (U.K.), Praxair S.T. Technology, Inc. (U.K.), Aremco Products, Inc. (U.S.), Akzo Nobel N.V. (The Netherlands), Saint-Gobain (France), MBI Coatings (U.S.), Nano-Care Deutschland AG (Germany), Ceramic Polymer GmbH (Germany), Oerlikon Group (Switzerland)

    Which Type led the Ceramic Coating market?

    The Oxide categories dominated the Ceramic Coating market in 2023.

    Which Method led the Ceramic Coating market?

    The thermal spray had the largest share in the market for Ceramic Coating.

    1. --- '1 Executive Summary
      1. MARKET ATTRACTIVENESS ANALYSIS 20
        1. GLOBAL CERAMIC COATINGS MARKET, BY MATERIAL TYPE 20
        2. GLOBAL CERAMIC COATINGS MARKET, BY TECHNOLOGY 21
        3. GLOBAL CERAMIC COATINGS MARKET, BY END-USE INDUSTRY 22
        4. GLOBAL CERAMIC COATINGS MARKET, BY REGION 23
    2. Market Introduction
      1. DEFINITION 24
      2. Scope of the Study 24
      3. MARKET STRUCTURE 25
    3. Research Methodology
      1. RESEARCH PROCESS 26
      2. PRIMARY RESEARCH 27
      3. SECONDARY RESEARCH 28
      4. MARKET SIZE ESTIMATION 28
      5. TOP-DOWN AND Bottom-up Approach 29
      6. FORECAST MODEL 30
      7. LIST OF ASSUMPTIONS 31
    4. MARKET DYNAMICS
      1. INTRODUCTION 32
      2. DRIVERS 32
        1. USE OF CERAMIC COATINGS IN THE AUTOMOTIVE INDUSTRY 32
        2. HIGH DEMAND IN THE AEROSPACE & DEFENSE INDUSTRY 34
        3. GROWING DEMAND FROM HEALTHCARE AND ENERGY & POWER INDUSTRIES 34
      3. RESTRAINTS 36
        1. DISADVANTAGES ASSOCIATED WITH CERAMIC COATINGS 36
      4. OPPORTUNITIES 37
        1. EMERGING MARKETS FOR CERAMIC COATINGS 37
      5. CHALLENGE 38
        1. AVAILABILITY OF SUBSTITUTES 38
    5. MARKET FACTOR ANALYSIS
      1. SUPPLY CHAIN ANALYSIS 39
        1. RAW MATERIALS SUPPLIERS 39
        2. MANUFACTURERS 40
        3. DISTRIBUTION & SALES CHANNEL 40
        4. END-USE INDUSTRY 40
      2. PORTER’S FIVE FORCES ANALYSIS 41
        1. THREAT OF NEW ENTRANTS 41
        2. BARGAINING POWER OF SUPPLIERS 41
        3. THREAT OF SUBSTITUTES 42
        4. BARGAINING POWER OF BUYERS 42
        5. INTENSITY OF RIVALRY 42
      3. IMPACT OF COVID 19 OUTBREAK ON GLOBAL MARKET 42
        1. OVERVIEW OF SUPPLY SCENARIO 42
        2. IMPACT OF COVID-19 ON SUPPLY CHAINS 43
        3. QUALITATIVE ANALYSIS ON CHANGE IN DEMAND FROM END-USE INDUSTRIES 43
        4. IMPACT OF COVID-19 ON THE GLOBAL ECONOMY 45
    6. GLOBAL CERAMIC COATING MARKET, BY MATERIAL TYPE
      1. INTRODUCTION 46
      2. OXIDE 48
      3. SILICA 49
      4. ALUMINA-MAGNESIA 50
      5. CARBIDE 51
      6. NITRIDE 52
      7. OTHERS 53
    7. GLOBAL CERAMIC COATING MARKET, BY TECHNOLOGY
      1. INTRODUCTION 54
      2. THERMAL SPRAY 56
      3. PHYSICAL VAPOR DEPOSITION 57
      4. CHEMICAL VAPOR DEPOSITION 58
      5. OTHERS 59
    8. GLOBAL CERAMIC COATING MARKET, BY END-USE INDUSTRY
      1. INTRODUCTION 60
      2. AUTOMOTIVE 62
      3. OIL & GAS 64
      4. AEROSPACE & DEFENSE 65
      5. CHEMICAL 66
      6. TEXTILE 67
      7. ENERGY & POWER 68
      8. HEALTHCARE 69
      9. OTHERS 70
    9. GLOBAL CERAMIC COATING MARKET, BY REGION
      1. INTRODUCTION 71
      2. NORTH AMERICA 73
        1. US 77
        2. CANADA 80
      3. EUROPE 83
        1. GERMANY 87
        2. UK 90
        3. FRANCE 93
        4. RUSSIA 96
        5. SPAIN 99
        6. ITALY 102
        7. POLAND 105
        8. REST OF EUROPE 108
      4. ASIA-PACIFIC 111
        1. CHINA 115
        2. INDIA 118
        3. SOUTH KOREA 121
        4. JAPAN 124
        5. AUSTRALIA & NEW ZEALAND 127
        6. REST OF ASIA PACIFIC 130
      5. LATIN AMERICA 133
        1. BRAZIL 137
        2. MEXICO 140
        3. ARGENTINA 143
        4. REST OF LATIN AMERICA 146
      6. MIDDLE EAST & AFRICA 149
        1. TURKEY 153
        2. SOUTH AFRICA 156
        3. GCC COUNTRIES 159
        4. REST OF MIDDLE EAST & AFRICA 162
    10. Competitive Landscape
      1. COMPETITIVE OVERVIEW 165
      2. MARKET STRATEGY ANALYSIS 165
      3. COMPETITIVE BENCHMARKING 166
    11. COMPANY PROFILES
      1. MORGAN ADVANCED MATERIALS 167
        1. COMPANY OVERVIEW 167
        2. FINANCIAL OVERVIEW 167
        3. PRODUCTS OFFERED 168
        4. KEY DEVELOPMENTS 168
        5. SWOT ANALYSIS 168
        6. KEY STRATEGIES 169
      2. BODYCOTE 170
        1. COMPANY OVERVIEW 170
        2. FINANCIAL OVERVIEW 170
        3. PRODUCTS OFFERED 171
        4. KEY DEVELOPMENTS 171
        5. SWOT ANALYSIS 171
        6. KEY STRATEGIES 171
      3. AKZO NOBEL N.V. 172
        1. COMPANY OVERVIEW 172
        2. FINANCIAL OVERVIEW 172
        3. PRODUCTS OFFERED 173
        4. KEY DEVELOPMENTS 173
        5. SWOT ANALYSIS 173
        6. KEY STRATEGIES 173
      4. SAINT-GOBAIN 174
        1. COMPANY OVERVIEW 174
        2. FINANCIAL OVERVIEW 174
        3. PRODUCTS OFFERED 175
        4. KEY DEVELOPMENTS 175
        5. SWOT ANALYSIS 175
        6. KEY STRATEGIES 175
      5. OERLIKON GROUP 176
        1. COMPANY OVERVIEW 176
        2. FINANCIAL OVERVIEW 176
        3. PRODUCTS OFFERED 177
        4. KEY DEVELOPMENTS 177
        5. SWOT ANALYSIS 177
        6. KEY STRATEGIES 177
      6. APS MATERIALS, INC. 178
        1. COMPANY OVERVIEW 178
        2. FINANCIAL OVERVIEW 178
        3. PRODUCTS OFFERED 178
        4. KEY DEVELOPMENTS 178
        5. SWOT ANALYSIS 179
        6. KEY STRATEGIES 179
      7. PRAXAIR S.T. TECHNOLOGY, INC. 180
        1. COMPANY OVERVIEW 180
        2. FINANCIAL OVERVIEW 180
        3. PRODUCTS OFFERED 180
        4. KEY DEVELOPMENTS 180
        5. SWOT ANALYSIS 181
        6. KEY STRATEGIES 181
      8. AREMCO PRODUCTS, INC. 182
        1. COMPANY OVERVIEW 182
        2. FINANCIAL OVERVIEW 182
        3. PRODUCTS OFFERED 182
        4. KEY DEVELOPMENTS 183
        5. SWOT ANALYSIS 183
        6. KEY STRATEGIES 183
      9. MBI COATINGS 184
        1. COMPANY OVERVIEW 184
        2. FINANCIAL OVERVIEW 184
        3. PRODUCTS OFFERED 184
        4. KEY DEVELOPMENTS 184
        5. SWOT ANALYSIS 185
        6. KEY STRATEGIES 185
      10. NANO-CARE DEUTSCHLAND AG 186
        1. COMPANY OVERVIEW 186
        2. FINANCIAL OVERVIEW 186
        3. PRODUCTS OFFERED 186
        4. KEY DEVELOPMENTS 186
        5. SWOT ANALYSIS 187
        6. KEY STRATEGIES 187
      11. CERAMIC POLYMER GMBH 188
        1. COMPANY OVERVIEW 188
        2. FINANCIAL OVERVIEW 188
        3. PRODUCTS OFFERED 188
        4. KEY DEVELOPMENTS 188
        5. SWOT ANALYSIS 189
        6. KEY STRATEGIES 189
    12. List of Tables and Figures
      1. 12 LIST OF TABLES
      2. TABLE 1 LIST OF ASSUMPTIONS 31
      3. TABLE 2 GLOBAL CERAMIC COATING, BY MATERIAL TYPE, 2020-2027 (USD MILLION) 46
      4. TABLE 3 GLOBAL CERAMIC COATING MARKET, BY MATERIAL TYPE, 2020-2027 (KILOTONS) 47
      5. TABLE 4 GLOBAL CERAMIC COATING MARKET FOR OXIDE, BY REGION, 2020-2027 (USD MILLION) 48
      6. TABLE 5 GLOBAL CERAMIC COATING MARKET FOR OXIDE, BY REGION, 2020-2027 (KILOTONS) 48
      7. TABLE 6 GLOBAL CERAMIC COATING MARKET FOR SILICA, BY REGION, 2020-2027 (USD MILLION) 49
      8. TABLE 7 GLOBAL CERAMIC COATING MARKET FOR SILICA, BY REGION, 2020-2027 (KILOTONS) 49
      9. TABLE 8 GLOBAL CERAMIC COATING MARKET FOR ALUMINA-MAGNESIA, BY REGION, 2020-2027 (USD MILLION) 50
      10. TABLE 9 GLOBAL CERAMIC COATING MARKET FOR ALUMINA-MAGNESIA, BY REGION, 2020-2027 (KILOTONS) 50
      11. TABLE 10 GLOBAL CERAMIC COATING MARKET FOR CARBIDE, BY REGION, 2020-2027 (USD MILLION) 51
      12. TABLE 11 GLOBAL CERAMIC COATING MARKET FOR CARBIDE, BY REGION, 2020-2027 (KILOTONS) 51
      13. TABLE 12 GLOBAL CERAMIC COATING MARKET FOR NITRIDE, BY REGION, 2020-2027 (USD MILLION) 52
      14. TABLE 13 GLOBAL CERAMIC COATING MARKET FOR NITRIDE, BY REGION, 2020-2027 (KILOTONS) 52
      15. TABLE 14 GLOBAL CERAMIC COATING MARKET FOR OTHERS, BY REGION, 2020-2027 (USD MILLION) 53
      16. TABLE 15 GLOBAL CERAMIC COATING MARKET FOR OTHERS, BY REGION, 2020-2027 (KILOTONS) 53
      17. TABLE 16 GLOBAL CERAMIC COATING, BY TECHNOLOGY, 2020-2027 (USD MILLION) 54
      18. TABLE 17 GLOBAL CERAMIC COATING MARKET, BY TECHNOLOGY, 2020-2027 (KILOTONS) 55
      19. TABLE 18 GLOBAL CERAMIC COATING MARKET FOR THERMAL SPRAY, BY REGION, 2020-2027 (USD MILLION) 56
      20. TABLE 19 GLOBAL CERAMIC COATING MARKET FOR THERMAL SPRAY, BY REGION, 2020-2027 (KILOTONS) 56
      21. TABLE 20 GLOBAL CERAMIC COATING MARKET FOR PHYSICAL VAPOR DEPOSITION, BY REGION, 2020-2027 (USD MILLION) 57
      22. TABLE 21 GLOBAL CERAMIC COATING MARKET FOR PHYSICAL VAPOR DEPOSITION, BY REGION, 2020-2027 (KILOTONS) 57
      23. TABLE 22 GLOBAL CERAMIC COATING MARKET FOR CHEMICAL VAPOR DEPOSITION, BY REGION, 2020-2027 (USD MILLION) 58
      24. TABLE 23 GLOBAL CERAMIC COATING MARKET FOR CHEMICAL VAPOR DEPOSITION, BY REGION, 2020-2027 (KILOTONS) 58
      25. TABLE 24 GLOBAL CERAMIC COATING MARKET FOR OTHERS, BY REGION, 2020-2027 (USD MILLION) 59
      26. TABLE 25 GLOBAL CERAMIC COATING MARKET FOR OTHERS, BY REGION, 2020-2027 (KILOTONS) 59
      27. TABLE 26 GLOBAL CERAMIC COATING, BY END-USE INDUSTRY, 2020-2027 (USD MILLION) 61
      28. TABLE 27 GLOBAL CERAMIC COATING MARKET, BY END-USE INDUSTRY, 2020-2027 (KILOTONS) 62
      29. TABLE 28 GLOBAL CERAMIC COATING MARKET FOR AUTOMOBILE, BY REGION, 2020-2027 (USD MILLION) 63
      30. TABLE 29 GLOBAL CERAMIC COATING MARKET FOR AUTOMOBILE, BY REGION, 2020-2027 (KILOTONS) 63
      31. TABLE 30 GLOBAL CERAMIC COATING MARKET FOR OIL & GAS, BY REGION, 2020-2027 (USD MILLION) 64
      32. TABLE 31 GLOBAL CERAMIC COATING MARKET FOR OIL & GAS, BY REGION, 2020-2027 (KILOTONS) 64
      33. TABLE 32 GLOBAL CERAMIC COATING MARKET FOR AEROSPACE & DEFENSE, BY REGION, 2020-2027 (USD MILLION) 65
      34. TABLE 33 GLOBAL CERAMIC COATING MARKET FOR AEROSPACE & DEFENSE, BY REGION, 2020-2027 (KILOTONS) 65
      35. TABLE 34 GLOBAL CERAMIC COATING MARKET FOR CHEMICAL, BY REGION, 2020-2027 (USD MILLION) 66
      36. TABLE 35 GLOBAL CERAMIC COATING MARKET FOR CHEMICAL, BY REGION, 2020-2027 (KILOTONS) 66
      37. TABLE 36 GLOBAL CERAMIC COATING MARKET FOR TEXTILE, BY REGION, 2020-2027 (USD MILLION) 67
      38. TABLE 37 GLOBAL CERAMIC COATING MARKET FOR TEXTILE, BY REGION, 2020-2027 (KILOTONS) 67
      39. TABLE 38 GLOBAL CERAMIC COATING MARKET FOR ENERGY & POWER, BY REGION, 2020-2027 (USD MILLION) 68
      40. TABLE 39 GLOBAL CERAMIC COATING MARKET FOR ENERGY & POWER, BY REGION, 2020-2027 (KILOTONS) 68
      41. TABLE 40 GLOBAL CERAMIC COATING MARKET FOR HEALTHCARE, BY REGION, 2020-2027 (USD MILLION) 69
      42. TABLE 41 GLOBAL CERAMIC COATING MARKET FOR HEALTHCARE, BY REGION, 2020-2027 (KILOTONS) 69
      43. TABLE 42 GLOBAL CERAMIC COATING MARKET FOR OTHERS, BY REGION, 2020-2027 (USD MILLION) 70
      44. TABLE 43 GLOBAL CERAMIC COATING MARKET FOR OTHERS, BY REGION, 2020-2027 (KILOTONS) 70
      45. TABLE 44 GLOBAL CERAMIC COATING MARKET, BY REGION, 2020-2027 (USD MILLION) 72
      46. TABLE 45 GLOBAL CERAMIC COATING MARKET, BY REGION, 2020-2027 (KILOTONS) 73
      47. TABLE 46 NORTH AMERICA CERAMIC COATING MARKET, BY COUNTRY, 2020-2027 (USD MILLION) 73
      48. TABLE 47 NORTH AMERICA CERAMIC COATING MARKET, BY COUNTRY, 2020-2027 (KILOTONS) 73
      49. TABLE 48 NORTH AMERICA CERAMIC COATING MARKET, BY MATERIAL TYPE, 2020-2027 (USD MILLION) 74
      50. TABLE 49 NORTH AMERICA CERAMIC COATING MARKET, BY MATERIAL TYPE, 2020-2027 (KILOTONS) 74
      51. TABLE 50 NORTH AMERICA CERAMIC COATING MARKET, BY TECHNOLOGY, 2020-2027 (USD MILLION) 75
      52. TABLE 51 NORTH AMERICA CERAMIC COATING MARKET, BY TECHNOLOGY, 2020-2027 (KILOTONS) 75
      53. TABLE 52 NORTH AMERICA CERAMIC COATING MARKET, BY END-USE INDUSTRY, 2020-2027 (USD MILLION) 76
      54. TABLE 53 NORTH AMERICA CERAMIC COATING MARKET, BY END-USE INDUSTRY, 2020-2027 (KILOTONS) 76
      55. TABLE 54 US CERAMIC COATING MARKET, BY MATERIAL TYPE, 2020-2027 (USD MILLION) 77
      56. TABLE 55 US CERAMIC COATING MARKET, BY MATERIAL TYPE, 2020-2027 (KILOTONS) 77
      57. TABLE 56 US CERAMIC COATING MARKET, BY TECHNOLOGY, 2020-2027 (USD MILLION) 78
      58. TABLE 57 US CERAMIC COATING MARKET, BY TECHNOLOGY, 2020-2027 (KILOTONS) 78
      59. TABLE 58 US CERAMIC COATING MARKET, BY END-USE INDUSTRY, 2020-2027 (USD MILLION) 79
      60. TABLE 59 US CERAMIC COATING MARKET, BY END-USE INDUSTRY, 2020-2027 (KILOTONS) 79
      61. TABLE 60 CANADA CERAMIC COATING MARKET, BY MATERIAL TYPE, 2020-2027 (USD MILLION) 80
      62. TABLE 61 CANADA CERAMIC COATING MARKET, BY MATERIAL TYPE, 2020-2027 (KILOTONS) 80
      63. TABLE 62 CANADA CERAMIC COATING MARKET, BY TECHNOLOGY, 2020-2027 (USD MILLION) 81
      64. TABLE 63 CANADA CERAMIC COATING MARKET, BY TECHNOLOGY, 2020-2027 (KILOTONS) 81
      65. TABLE 64 CANADA CERAMIC COATING MARKET, BY END-USE INDUSTRY, 2020-2027 (USD MILLION) 82
      66. TABLE 65 CANADA CERAMIC COATING MARKET, BY END-USE INDUSTRY, 2020-2027 (KILOTONS) 82
      67. TABLE 66 EUROPE CERAMIC COATING MARKET, BY COUNTRY, 2020-2027 (USD MILLION) 83
      68. TABLE 67 EUROPE CERAMIC COATING MARKET, BY COUNTRY, 2020-2027 (KILOTONS) 83
      69. TABLE 68 EUROPE CERAMIC COATING MARKET, BY MATERIAL TYPE, 2020-2027 (USD MILLION) 84
      70. TABLE 69 EUROPE CERAMIC COATING MARKET, BY MATERIAL TYPE, 2020-2027 (KILOTONS) 84
      71. TABLE 70 EUROPE CERAMIC COATING MARKET, BY TECHNOLOGY, 2020-2027 (USD MILLION) 85
      72. TABLE 71 EUROPE CERAMIC COATING MARKET, BY TECHNOLOGY, 2020-2027 (KILOTONS) 85
      73. TABLE 72 EUROPE CERAMIC COATING MARKET, BY END-USE INDUSTRY, 2020-2027 (USD MILLION) 86
      74. TABLE 73 EUROPE CERAMIC COATING MARKET, BY END-USE INDUSTRY, 2020-2027 (KILOTONS) 86
      75. TABLE 74 GERMANY CERAMIC COATING MARKET, BY MATERIAL TYPE, 2020-2027 (USD MILLION) 87
      76. TABLE 75 GERMANY CERAMIC COATING MARKET, BY MATERIAL TYPE, 2020-2027 (KILOTONS) 87
      77. TABLE 76 GERMANY CERAMIC COATING MARKET, BY TECHNOLOGY, 2020-2027 (USD MILLION) 88
      78. TABLE 77 GERMANY CERAMIC COATING MARKET, BY TECHNOLOGY, 2020-2027 (KILOTONS) 88
      79. TABLE 78 GERMANY CERAMIC COATING MARKET, BY END-USE INDUSTRY, 2020-2027 (USD MILLION) 89
      80. TABLE 79 GERMANY CERAMIC COATING MARKET, BY END-USE INDUSTRY, 2020-2027 (KILOTONS) 89
      81. TABLE 80 UK CERAMIC COATING MARKET, BY MATERIAL TYPE, 2020-2027 (USD MILLION) 90
      82. TABLE 81 UK CERAMIC COATING MARKET, BY MATERIAL TYPE, 2020-2027 (KILOTONS) 90
      83. TABLE 82 UK CERAMIC COATING MARKET, BY TECHNOLOGY, 2020-2027 (USD MILLION) 91
      84. TABLE 83 UK CERAMIC COATING MARKET, BY TECHNOLOGY, 2020-2027 (KILOTONS) 91
      85. TABLE 84 UK CERAMIC COATING MARKET, BY END-USE INDUSTRY, 2020-2027 (USD MILLION) 92
      86. TABLE 85 UK CERAMIC COATING MARKET, BY END-USE INDUSTRY, 2020-2027 (KILOTONS) 92
      87. TABLE 86 FRANCE CERAMIC COATING MARKET, BY MATERIAL TYPE, 2020-2027 (USD MILLION) 93
      88. TABLE 87 FRANCE CERAMIC COATING MARKET, BY MATERIAL TYPE, 2020-2027 (KILOTONS) 93
      89. TABLE 88 FRANCE CERAMIC COATING MARKET, BY TECHNOLOGY, 2020-2027 (USD MILLION) 94
      90. TABLE 89 FRANCE CERAMIC COATING MARKET, BY TECHNOLOGY, 2020-2027 (KILOTONS) 94
      91. TABLE 90 FRANCE CERAMIC COATING MARKET, BY END-USE INDUSTRY, 2020-2027 (USD MILLION) 95
      92. TABLE 91 FRANCE CERAMIC COATING MARKET, BY END-USE INDUSTRY, 2020-2027 (KILOTONS) 95
      93. TABLE 92 RUSSIA CERAMIC COATING MARKET, BY MATERIAL TYPE, 2020-2027 (USD MILLION) 96
      94. TABLE 93 RUSSIA CERAMIC COATING MARKET, BY MATERIAL TYPE, 2020-2027 (KILOTONS) 96
      95. TABLE 94 RUSSIA CERAMIC COATING MARKET, BY TECHNOLOGY, 2020-2027 (USD MILLION) 97
      96. TABLE 95 RUSSIA CERAMIC COATING MARKET, BY TECHNOLOGY, 2020-2027 (KILOTONS) 97
      97. TABLE 96 RUSSIA CERAMIC COATING MARKET, BY END-USE INDUSTRY, 2020-2027 (USD MILLION) 98
      98. TABLE 97 RUSSIA CERAMIC COATING MARKET, BY END-USE INDUSTRY, 2020-2027 (KILOTONS) 98
      99. TABLE 98 SPAIN CERAMIC COATING MARKET, BY MATERIAL TYPE, 2020-2027 (USD MILLION) 99
      100. TABLE 99 SPAIN CERAMIC COATING MARKET, BY MATERIAL TYPE, 2020-2027 (KILOTONS) 99
      101. TABLE 100 SPAIN CERAMIC COATING MARKET, BY TECHNOLOGY, 2020-2027 (USD MILLION) 100
      102. TABLE 101 SPAIN CERAMIC COATING MARKET, BY TECHNOLOGY, 2020-2027 (KILOTONS) 100
      103. TABLE 102 SPAIN CERAMIC COATING MARKET, BY END-USE INDUSTRY, 2020-2027 (USD MILLION) 101
      104. TABLE 103 SPAIN CERAMIC COATING MARKET, BY END-USE INDUSTRY, 2020-2027 (KILOTONS) 101
      105. TABLE 104 ITALY CERAMIC COATING MARKET, BY MATERIAL TYPE, 2020-2027 (USD MILLION) 102
      106. TABLE 105 ITALY CERAMIC COATING MARKET, BY MATERIAL TYPE, 2020-2027 (KILOTONS) 102
      107. TABLE 106 ITALY CERAMIC COATING MARKET, BY TECHNOLOGY, 2020-2027 (USD MILLION) 103
      108. TABLE 107 ITALY CERAMIC COATING MARKET, BY TECHNOLOGY, 2020-2027 (KILOTONS) 103
      109. TABLE 108 ITALY CERAMIC COATING MARKET, BY END-USE INDUSTRY, 2020-2027 (USD MILLION) 104
      110. TABLE 109 ITALY CERAMIC COATING MARKET, BY END-USE INDUSTRY, 2020-2027 (KILOTONS) 104
      111. TABLE 110 POLAND CERAMIC COATING MARKET, BY MATERIAL TYPE, 2020-2027 (USD MILLION) 105
      112. TABLE 111 POLAND CERAMIC COATING MARKET, BY MATERIAL TYPE, 2020-2027 (KILOTONS) 105
      113. TABLE 112 POLAND CERAMIC COATING MARKET, BY TECHNOLOGY, 2020-2027 (USD MILLION) 106
      114. TABLE 113 POLAND CERAMIC COATING MARKET, BY TECHNOLOGY, 2020-2027 (KILOTONS) 106
      115. TABLE 114 POLAND CERAMIC COATING MARKET, BY END-USE INDUSTRY, 2020-2027 (USD MILLION) 107
      116. TABLE 115 POLAND CERAMIC COATING MARKET, BY END-USE INDUSTRY, 2020-2027 (KILOTONS) 107
      117. TABLE 116 REST OF EUROPE CERAMIC COATING MARKET, BY MATERIAL TYPE, 2020-2027 (USD MILLION) 108
      118. TABLE 117 REST OF EUROPE CERAMIC COATING MARKET, BY MATERIAL TYPE, 2020-2027 (KILOTONS) 108
      119. TABLE 118 REST OF EUROPE CERAMIC COATING MARKET, BY TECHNOLOGY, 2020-2027 (USD MILLION) 109
      120. TABLE 119 REST OF EUROPE CERAMIC COATING MARKET, BY TECHNOLOGY, 2020-2027 (KILOTONS) 109
      121. TABLE 120 REST OF EUROPE CERAMIC COATING MARKET, BY END-USE INDUSTRY, 2020-2027 (USD MILLION) 110
      122. TABLE 121 REST OF EUROPE CERAMIC COATING MARKET, BY END-USE INDUSTRY, 2020-2027 (KILOTONS) 110
      123. TABLE 122 ASIA-PACIFIC CERAMIC COATING MARKET, BY COUNTRY, 2020-2027 (USD MILLION) 111
      124. TABLE 123 ASIA-PACIFIC CERAMIC COATING MARKET, BY COUNTRY, 2020-2027 (KILOTONS) 111
      125. TABLE 124 ASIA-PACIFIC CERAMIC COATING MARKET, BY MATERIAL TYPE, 2020-2027 (USD MILLION) 112
      126. TABLE 125 ASIA-PACIFIC CERAMIC COATING MARKET, BY MATERIAL TYPE, 2020-2027 (KILOTONS) 112
      127. TABLE 126 ASIA-PACIFIC CERAMIC COATING MARKET, BY TECHNOLOGY, 2020-2027 (USD MILLION) 113
      128. TABLE 127 ASIA-PACIFIC CERAMIC COATING MARKET, BY TECHNOLOGY, 2020-2027 (KILOTONS) 113
      129. TABLE 128 ASIA-PACIFIC CERAMIC COATING MARKET, BY END-USE INDUSTRY, 2020-2027 (USD MILLION) 114
      130. TABLE 129 ASIA-PACIFIC CERAMIC COATING MARKET, BY END-USE INDUSTRY, 2020-2027 (KILOTONS) 114
      131. TABLE 130 CHINA CERAMIC COATING MARKET, BY MATERIAL TYPE, 2020-2027 (USD MILLION) 115
      132. TABLE 131 CHINA CERAMIC COATING MARKET, BY MATERIAL TYPE, 2020-2027 (KILOTONS) 115
      133. TABLE 132 CHINA CERAMIC COATING MARKET, BY TECHNOLOGY, 2020-2027 (USD MILLION) 116
      134. TABLE 133 CHINA CERAMIC COATING MARKET, BY TECHNOLOGY, 2020-2027 (KILOTONS) 116
      135. TABLE 134 CHINA CERAMIC COATING MARKET, BY END-USE INDUSTRY, 2020-2027 (USD MILLION) 117
      136. TABLE 135 CHINA CERAMIC COATING MARKET, BY END-USE INDUSTRY, 2020-2027 (KILOTONS) 117
      137. TABLE 136 INDIA CERAMIC COATING MARKET, BY MATERIAL TYPE, 2020-2027 (USD MILLION) 118
      138. TABLE 137 INDIA CERAMIC COATING MARKET, BY MATERIAL TYPE, 2020-2027 (KILOTONS) 118
      139. TABLE 138 INDIA CERAMIC COATING MARKET, BY TECHNOLOGY, 2020-2027 (USD MILLION) 119
      140. TABLE 139 INDIA CERAMIC COATING MARKET, BY TECHNOLOGY, 2020-2027 (KILOTONS) 119
      141. TABLE 140 INDIA CERAMIC COATING MARKET, BY END-USE INDUSTRY, 2020-2027 (USD MILLION) 120
      142. TABLE 141 INDIA CERAMIC COATING MARKET, BY END-USE INDUSTRY, 2020-2027 (KILOTONS) 120
      143. TABLE 142 SOUTH KOREA CERAMIC COATING MARKET, BY MATERIAL TYPE, 2020-2027 (USD MILLION) 121
      144. TABLE 143 SOUTH KOREA CERAMIC COATING MARKET, BY MATERIAL TYPE, 2020-2027 (KILOTONS) 121
      145. TABLE 144 SOUTH KOREA CERAMIC COATING MARKET, BY TECHNOLOGY, 2020-2027 (USD MILLION) 122
      146. TABLE 145 SOUTH KOREA CERAMIC COATING MARKET, BY TECHNOLOGY, 2020-2027 (KILOTONS) 122
      147. TABLE 146 SOUTH KOREA CERAMIC COATING MARKET, BY END-USE INDUSTRY, 2020-2027 (USD MILLION) 123
      148. TABLE 147 SOUTH KOREA CERAMIC COATING MARKET, BY END-USE INDUSTRY, 2020-2027 (KILOTONS) 123
      149. TABLE 148 JAPAN CERAMIC COATING MARKET, BY MATERIAL TYPE, 2020-2027 (USD MILLION) 124
      150. TABLE 149 JAPAN CERAMIC COATING MARKET, BY MATERIAL TYPE, 2020-2027 (KILOTONS) 124
      151. TABLE 150 JAPAN CERAMIC COATING MARKET, BY TECHNOLOGY, 2020-2027 (USD MILLION) 125
      152. TABLE 151 JAPAN CERAMIC COATING MARKET, BY TECHNOLOGY, 2020-2027 (KILOTONS) 125
      153. TABLE 152 JAPAN CERAMIC COATING MARKET, BY END-USE INDUSTRY, 2020-2027 (USD MILLION) 126
      154. TABLE 153 JAPAN CERAMIC COATING MARKET, BY END-USE INDUSTRY, 2020-2027 (KILOTONS) 126
      155. TABLE 154 AUSTRALIA & NEW ZEALAND CERAMIC COATING MARKET, BY MATERIAL TYPE, 2020-2027 (USD MILLION) 127
      156. TABLE 155 AUSTRALIA & NEW ZEALAND CERAMIC COATING MARKET, BY MATERIAL TYPE, 2020-2027 (KILOTONS) 127
      157. TABLE 156 AUSTRALIA & NEW ZEALAND CERAMIC COATING MARKET, BY TECHNOLOGY, 2020-2027 (USD MILLION) 128
      158. TABLE 157 AUSTRALIA & NEW ZEALAND CERAMIC COATING MARKET, BY TECHNOLOGY, 2020-2027 (KILOTONS) 128
      159. TABLE 158 AUSTRALIA & NEW ZEALAND CERAMIC COATING MARKET, BY END-USE INDUSTRY, 2020-2027 (USD MILLION) 129
      160. TABLE 159 AUSTRALIA & NEW ZEALAND CERAMIC COATING MARKET, BY END-USE INDUSTRY, 2020-2027 (KILOTONS) 129
      161. TABLE 160 REST OF ASIA PACIFIC CERAMIC COATING MARKET, BY MATERIAL TYPE, 2020-2027 (USD MILLION) 130
      162. TABLE 161 REST OF ASIA PACIFIC CERAMIC COATING MARKET, BY MATERIAL TYPE, 2020-2027 (KILOTONS) 130
      163. TABLE 162 REST OF ASIA PACIFIC CERAMIC COATING MARKET, BY TECHNOLOGY, 2020-2027 (USD MILLION) 131
      164. TABLE 163 REST OF ASIA PACIFIC CERAMIC COATING MARKET, BY TECHNOLOGY, 2020-2027 (KILOTONS) 131
      165. TABLE 164 REST OF ASIA PACIFIC CERAMIC COATING MARKET, BY END-USE INDUSTRY, 2020-2027 (USD MILLION) 132
      166. TABLE 165 REST OF ASIA PACIFIC CERAMIC COATING MARKET, BY END-USE INDUSTRY, 2020-2027 (KILOTONS) 132
      167. TABLE 166 LATIN AMERICA CERAMIC COATING MARKET, BY COUNTRY, 2020-2027 (USD MILLION) 133
      168. TABLE 167 LATIN AMERICA CERAMIC COATING MARKET, BY COUNTRY, 2020-2027 (KILOTONS) 133
      169. TABLE 168 LATIN AMERICA CERAMIC COATING MARKET, BY MATERIAL TYPE, 2020-2027 (USD MILLION) 134
      170. TABLE 169 LATIN AMERICA CERAMIC COATING MARKET, BY MATERIAL TYPE, 2020-2027 (KILOTONS) 134
      171. TABLE 170 LATIN AMERICA CERAMIC COATING MARKET, BY TECHNOLOGY, 2020-2027 (USD MILLION) 135
      172. TABLE 171 LATIN AMERICA CERAMIC COATING MARKET, BY TECHNOLOGY, 2020-2027 (KILOTONS) 135
      173. TABLE 172 LATIN AMERICA CERAMIC COATING MARKET, BY END-USE INDUSTRY, 2020-2027 (USD MILLION) 136
      174. TABLE 173 LATIN AMERICA CERAMIC COATING MARKET, BY END-USE INDUSTRY, 2020-2027 (KILOTONS) 136
      175. TABLE 174 BRAZIL CERAMIC COATING MARKET, BY MATERIAL TYPE, 2020-2027 (USD MILLION) 137
      176. TABLE 175 BRAZIL CERAMIC COATING MARKET, BY MATERIAL TYPE, 2020-2027 (KILOTONS) 137
      177. TABLE 176 BRAZIL CERAMIC COATING MARKET, BY TECHNOLOGY, 2020-2027 (USD MILLION) 138
      178. TABLE 177 BRAZIL CERAMIC COATING MARKET, BY TECHNOLOGY, 2020-2027 (KILOTONS) 138
      179. TABLE 178 BRAZIL CERAMIC COATING MARKET, BY END-USE INDUSTRY, 2020-2027 (USD MILLION) 139
      180. TABLE 179 BRAZIL CERAMIC COATING MARKET, BY END-USE INDUSTRY, 2020-2027 (KILOTONS) 139
      181. TABLE 180 MEXICO CERAMIC COATING MARKET, BY MATERIAL TYPE, 2020-2027 (USD MILLION) 140
      182. TABLE 181 MEXICO CERAMIC COATING MARKET, BY MATERIAL TYPE, 2020-2027 (KILOTONS) 140
      183. TABLE 182 MEXICO CERAMIC COATING MARKET, BY TECHNOLOGY, 2020-2027 (USD MILLION) 141
      184. TABLE 183 MEXICO CERAMIC COATING MARKET, BY TECHNOLOGY, 2020-2027 (KILOTONS) 141
      185. TABLE 184 MEXICO CERAMIC COATING MARKET, BY END-USE INDUSTRY, 2020-2027 (USD MILLION) 142
      186. TABLE 185 MEXICO CERAMIC COATING MARKET, BY END-USE INDUSTRY, 2020-2027 (KILOTONS) 142
      187. TABLE 186 ARGENTINA CERAMIC COATING MARKET, BY MATERIAL TYPE, 2020-2027 (USD MILLION) 143
      188. TABLE 187 ARGENTINA CERAMIC COATING MARKET, BY MATERIAL TYPE, 2020-2027 (KILOTONS) 143
      189. TABLE 188 ARGENTINA CERAMIC COATING MARKET, BY TECHNOLOGY, 2020-2027 (USD MILLION) 144
      190. TABLE 189 ARGENTINA CERAMIC COATING MARKET, BY TECHNOLOGY, 2020-2027 (KILOTONS) 144
      191. TABLE 190 ARGENTINA CERAMIC COATING MARKET, BY END-USE INDUSTRY, 2020-2027 (USD MILLION) 145
      192. TABLE 191 ARGENTINA CERAMIC COATING MARKET, BY END-USE INDUSTRY, 2020-2027 (KILOTONS) 145
      193. TABLE 192 REST OF LATIN AMERICA CERAMIC COATING MARKET, BY MATERIAL TYPE, 2020-2027 (USD MILLION) 146
      194. TABLE 193 REST OD LATIN AMERICA CERAMIC COATING MARKET, BY MATERIAL TYPE, 2020-2027 (KILOTONS) 146
      195. TABLE 194 REST OF LATIN AMERICA CERAMIC COATING MARKET, BY TECHNOLOGY, 2020-2027 (USD MILLION) 147
      196. TABLE 195 REST OD LATIN AMERICA CERAMIC COATING MARKET, BY TECHNOLOGY, 2020-2027 (KILOTONS) 147
      197. TABLE 196 REST OF LATIN AMERICA CERAMIC COATING MARKET, BY END-USE INDUSTRY, 2020-2027 (USD MILLION) 148
      198. TABLE 197 REST OF LATIN AMERICA CERAMIC COATING MARKET, BY END-USE INDUSTRY, 2020-2027 (KILOTONS) 148
      199. TABLE 198 MIDDLE EAST & AFRICA CERAMIC COATING MARKET, BY COUNTRY, 2020-2027 (USD MILLION) 149
      200. TABLE 199 MIDDLE EAST & AFRICA CERAMIC COATING MARKET, BY COUNTRY, 2020-2027 (KILOTONS) 149
      201. TABLE 200 MIDDLE EAST & AFRICA CERAMIC COATING MARKET, BY MATERIAL TYPE, 2020-2027 (USD MILLION) 150
      202. TABLE 201 MIDDLE EAST & AFRICA CERAMIC COATING MARKET, BY MATERIAL TYPE, 2020-2027 (KILOTONS) 150
      203. TABLE 202 MIDDLE EAST & AFRICA CERAMIC COATING MARKET, BY TECHNOLOGY, 2020-2027 (USD MILLION) 151
      204. TABLE 203 MIDDLE EAST & AFRICA CERAMIC COATING MARKET, BY TECHNOLOGY, 2020-2027 (KILOTONS) 151
      205. TABLE 204 MIDDLE EAST & AFRICA CERAMIC COATING MARKET, BY END-USE INDUSTRY, 2020-2027 (USD MILLION) 152
      206. TABLE 205 MIDDLE EAST & AFRICA CERAMIC COATING MARKET, BY END-USE INDUSTRY, 2020-2027 (KILOTONS) 152
      207. TABLE 206 TURKEY CERAMIC COATING MARKET, BY MATERIAL TYPE, 2020-2027 (USD MILLION) 153
      208. TABLE 207 TURKEY CERAMIC COATING MARKET, BY MATERIAL TYPE, 2020-2027 (KILOTONS) 153
      209. TABLE 208 TURKEY CERAMIC COATING MARKET, BY TECHNOLOGY, 2020-2027 (USD MILLION) 154
      210. TABLE 209 TURKEY CERAMIC COATING MARKET, BY TECHNOLOGY, 2020-2027 (KILOTONS) 154
      211. TABLE 210 TURKEY CERAMIC COATING MARKET, BY END-USE INDUSTRY, 2020-2027 (USD MILLION) 155
      212. TABLE 211 TURKEY CERAMIC COATING MARKET, BY END-USE INDUSTRY, 2020-2027 (KILOTONS) 155
      213. TABLE 212 SOUTH AFRICA CERAMIC COATING MARKET, BY MATERIAL TYPE, 2020-2027 (USD MILLION) 156
      214. TABLE 213 SOUTH AFRICA CERAMIC COATING MARKET, BY MATERIAL TYPE, 2020-2027 (KILOTONS) 156
      215. TABLE 214 SOUTH AFRICA CERAMIC COATING MARKET, BY TECHNOLOGY, 2020-2027 (USD MILLION) 157
      216. TABLE 215 SOUTH AFRICA CERAMIC COATING MARKET, BY TECHNOLOGY, 2020-2027 (KILOTONS) 157
      217. TABLE 216 SOUTH AFRICA CERAMIC COATING MARKET, BY END-USE INDUSTRY, 2020-2027 (USD MILLION) 158
      218. TABLE 217 SOUTH AFRICA CERAMIC COATING MARKET, BY END-USE INDUSTRY, 2020-2027 (KILOTONS) 158
      219. TABLE 218 GCC COUNTRIES CERAMIC COATING MARKET, BY MATERIAL TYPE, 2020-2027 (USD MILLION) 159
      220. TABLE 219 GCC COUNTRIES CERAMIC COATING MARKET, BY MATERIAL TYPE, 2020-2027 (KILOTONS) 159
      221. TABLE 220 GCC COUNTRIES CERAMIC COATING MARKET, BY TECHNOLOGY, 2020-2027 (USD MILLION) 160
      222. TABLE 221 GCC COUNTRIES CERAMIC COATING MARKET, BY TECHNOLOGY, 2020-2027 (KILOTONS) 160
      223. TABLE 222 GCC COUNTRIES CERAMIC COATING MARKET, BY END-USE INDUSTRY, 2020-2027 (USD MILLION) 161
      224. TABLE 223 GCC COUNTRIES CERAMIC COATING MARKET, BY END-USE INDUSTRY, 2020-2027 (KILOTONS) 161
      225. TABLE 224 REST OF MIDDLE EAST & AFRICA CERAMIC COATING MARKET, BY MATERIAL TYPE, 2020-2027 (USD MILLION) 162
      226. TABLE 225 REST OF MIDDLE EAST & AFRICA CERAMIC COATING MARKET, BY MATERIAL TYPE, 2020-2027 (KILOTONS) 162
      227. TABLE 226 REST OF MIDDLE EAST & AFRICACERAMIC COATING MARKET, BY TECHNOLOGY, 2020-2027 (USD MILLION) 163
      228. TABLE 227 REST OF MIDDLE EAST & AFRICA CERAMIC COATING MARKET, BY TECHNOLOGY, 2020-2027 (KILOTONS) 163
      229. TABLE 228 REST OF MIDDLE EAST & AFRICA CERAMIC COATING MARKET, BY END-USE INDUSTRY, 2020-2027 (USD MILLION) 164
      230. TABLE 229 REST OF MIDDLE EAST & AFRICA CERAMIC COATING MARKET, BY END-USE INDUSTRY, 2020-2027 (KILOTONS) 164
      231. TABLE 230 MORGAN ADVANCED MATERIALS: PRODUCTS OFFERED 168
      232. TABLE 231 BODYCOTE: PRODUCTS OFFERED 171
      233. TABLE 232 AKZO NOBEL N.V.: PRODUCTS OFFERED 173
      234. TABLE 233 SAINT-GOBAIN: PRODUCTS OFFERED 175
      235. TABLE 234 OERLIKON GROUP: PRODUCTS OFFERED 177
      236. TABLE 235 APS MATERIALS, INC.: PRODUCTS OFFERED 178
      237. TABLE 236 PRAXAIR S.T. TECHNOLOGY, INC.: PRODUCTS OFFERED 180
      238. TABLE 237 AREMCO PRODUCTS, INC.: PRODUCTS OFFERED 182
      239. TABLE 238 MBI COATINGS: PRODUCTS OFFERED 184
      240. TABLE 239 NANO-CARE DEUTSCHLAND AG: PRODUCTS OFFERED 186
      241. TABLE 240 CERAMIC POLYMER GMBH: PRODUCTS OFFERED 188 13 LIST OF FIGURES
      242. FIGURE 1 MARKET SYNOPSIS 19
      243. FIGURE 2 MARKET ATTRACTIVENESS ANALYSIS: GLOBAL CERAMIC COATINGS MARKET, 2020 20
      244. FIGURE 3 GLOBAL CERAMIC COATINGS MARKET ANALYSIS BY MATERIAL TYPE 20
      245. FIGURE 4 GLOBAL CERAMIC COATINGS MARKET ANALYSIS BY TECHNOLOGY 21
      246. FIGURE 5 GLOBAL CERAMIC COATINGS MARKET ANALYSIS BY END-USE INDUSTRY 22
      247. FIGURE 6 GLOBAL CERAMIC COATINGS MARKET ANALYSIS BY REGION 23
      248. FIGURE 7 GLOBAL CERAMIC COATINGS MARKET: MARKET STRUCTURE 25
      249. FIGURE 8 RESEARCH PROCESS OF MRFR 26
      250. FIGURE 9 MARKET DYNAMICS OVERVIEW 32
      251. FIGURE 10 COUNTRY-WISE TOP 10 AUTOMOTIVE PRODUCERS, 2020 33
      252. FIGURE 11 GLOBAL ELECTRIC VEHICLE GROWTH IN MILLIONS 33
      253. FIGURE 12 ENERGY CONSUMPTION BY REGIONS 35
      254. FIGURE 13 INSTALLED GLOBAL WIND ENERGY PRODUCTION CAPACITY, MW (2020-2027) 35
      255. FIGURE 14 DRIVERS IMPACT ANALYSIS 36
      256. FIGURE 15 RESTRAINT IMPACT ANALYSIS 37
      257. FIGURE 16 SUPPLY CHAIN ANALYSIS FOR GLOBAL CERAMIC COATINGS MARKET 39
      258. FIGURE 17 PORTER''S FIVE FORCES ANALYSIS OF THE GLOBAL CERAMIC COATINGS MARKET 41
      259. FIGURE 18 TOP 10 AFFECTED COUNTRIES 45
      260. FIGURE 19 GLOBAL CERAMIC COATING MARKET, BY MATERIAL TYPE, 2020-2027 (USD MILLION) 46
      261. FIGURE 20 GLOBAL CERAMIC COATING MARKET, BY MATERIAL TYPE, 2020-2027 (KILOTONS) 47
      262. FIGURE 21 GLOBAL CERAMIC COATING MARKET, BY TECHNOLOGY, 2020-2027 (USD MILLION) 54
      263. FIGURE 22 GLOBAL CERAMIC COATING MARKET, BY TECHNOLOGY, 2020-2027 (KILOTONS) 55
      264. FIGURE 23 GLOBAL CERAMIC COATING MARKET, BY END-USE INDUSTRY, 2020-2027 (USD MILLION) 60
      265. FIGURE 24 GLOBAL CERAMIC COATING MARKET, BY END-USE INDUSTRY, 2020-2027 (KILOTONS) 61
      266. FIGURE 25 GLOBAL CERAMIC COATING MARKET BY REGION, 2020-2027 (USD MILLION) 71
      267. FIGURE 26 GLOBAL CERAMIC COATING MARKET BY REGION, 2020-2027 (KILOTONS) 72
      268. FIGURE 27 BENCHMARKING OF MAJOR COMPETITORS 166
      269. FIGURE 28 MORGAN ADVANCED MATERIALS: FINANCIAL OVERVIEW SNAPSHOT 167
      270. FIGURE 29 MORGAN ADVANCED MATERIALS: SWOT ANALYSIS 168
      271. FIGURE 30 BODYCOTE: FINANCIAL OVERVIEW SNAPSHOT 170
      272. FIGURE 31 BODYCOTE: SWOT ANALYSIS 171
      273. FIGURE 32 AKZO NOBEL N.V.: FINANCIAL OVERVIEW SNAPSHOT 172
      274. FIGURE 33 AKZO NOBEL N.V.: SWOT ANALYSIS 173
      275. FIGURE 34 SAINT-GOBAIN: FINANCIAL OVERVIEW SNAPSHOT 174
      276. FIGURE 35 SAINT-GOBAIN: SWOT ANALYSIS 175
      277. FIGURE 36 OERLIKON GROUP: FINANCIAL OVERVIEW SNAPSHOT 176
      278. FIGURE 37 OERLIKON GROUP: SWOT ANALYSIS 177
      279. FIGURE 38 APS MATERIALS, INC.: SWOT ANALYSIS 179
      280. FIGURE 39 PRAXAIR S.T. TECHNOLOGY, INC.: SWOT ANALYSIS 181
      281. FIGURE 40 AREMCO PRODUCTS INC.: SWOT ANALYSIS 183
      282. FIGURE 41 MBI COATINGS: SWOT ANALYSIS 185
      283. FIGURE 42 NANO-CARE DEUTSCHLAND AG: SWOT ANALYSIS 187
      284. FIGURE 43 CERAMIC POLYMER GMBH: SWOT ANALYSIS 189'

    Ceramic Coatings Type Outlook (USD Billion, 2018-2030)

    Oxide

    Carbide

    Nitride

    Others

    Ceramic Coatings Method Outlook (USD Billion, 2018-2030)

    THERMAL SPRAY

    Physical Vapor Deposition (PVD)

    Chemical Vapor Deposition (CVD)

    Others

    Ceramic Coatings End-use Outlook (USD Billion, 2018-2030)

    Transportation & Automotive

    Energy

    Others

    Ceramic Coatings Regional Outlook (USD Billion, 2018-2030)

    North America Outlook (USD Billion, 2018-2030)

    North America Ceramic Coatings by Type

    Oxide

    Carbide

    Nitride

    Others

    North America Ceramic Coatings by Method

    THERMAL SPRAY

    Physical Vapor Deposition (PVD)

    Chemical Vapor Deposition (CVD)

    Others

    North America Ceramic Coatings by End-use

    Transportation & Automotive

    Energy

    Others

    US Outlook (USD Billion, 2018-2030)

    US Ceramic Coatings by Type

    Oxide

    Carbide

    Nitride

    Others

    US Ceramic Coatings by Method

    THERMAL SPRAY

    Physical Vapor Deposition (PVD)

    Chemical Vapor Deposition (CVD)

    Others

    US Ceramic Coatings by End-use

    Transportation & Automotive

    Energy

    Others

    CANADA Outlook (USD Billion, 2018-2030)

    CANADA Ceramic Coatings by Type

    Oxide

    Carbide

    Nitride

    Others

    CANADA Ceramic Coatings by Method

    THERMAL SPRAY

    Physical Vapor Deposition (PVD)

    Chemical Vapor Deposition (CVD)

    Others

    CANADA Ceramic Coatings by End-use

    Transportation & Automotive

    Energy

    Others

    Europe Outlook (USD Billion, 2018-2030)

    Europe Ceramic Coatings by Type

    Oxide

    Carbide

    Nitride

    Others

    Europe Ceramic Coatings by Method

    THERMAL SPRAY

    Physical Vapor Deposition (PVD)

    Chemical Vapor Deposition (CVD)

    Others

    Europe Ceramic Coatings by End-use

    Transportation & Automotive

    Energy

    Others

    Germany Outlook (USD Billion, 2018-2030)

    Germany Ceramic Coatings by Type

    Oxide

    Carbide

    Nitride

    Others

    Germany Ceramic Coatings by Method

    THERMAL SPRAY

    Physical Vapor Deposition (PVD)

    Chemical Vapor Deposition (CVD)

    Others

    Germany Ceramic Coatings by End-use

    Transportation & Automotive

    Energy

    Others

    France Outlook (USD Billion, 2018-2030)

    France Ceramic Coatings by Type

    Oxide

    Carbide

    Nitride

    Others

    France Ceramic Coatings by Method

    THERMAL SPRAY

    Physical Vapor Deposition (PVD)

    Chemical Vapor Deposition (CVD)

    Others

    France Ceramic Coatings by End-use
    •  
      •  

    Transportation & Automotive

    Energy

    Others

    •  

    UK Outlook (USD Billion, 2018-2030)

    UK Ceramic Coatings by Type

    Oxide

    Carbide

    Nitride

    Others

    UK Ceramic Coatings by Method

    THERMAL SPRAY

    Physical Vapor Deposition (PVD)

    Chemical Vapor Deposition (CVD)

    Others

    UK Ceramic Coatings by End-use

    Transportation & Automotive

    Energy

    Others

    ITALY Outlook (USD Billion, 2018-2030)

    ITALY Ceramic Coatings by Type

    Oxide

    Carbide

    Nitride

    Others

    ITALY Ceramic Coatings by Method

    THERMAL SPRAY

    Physical Vapor Deposition (PVD)

    Chemical Vapor Deposition (CVD)

    Others

    ITALY Ceramic Coatings by End-use

    Transportation & Automotive

    Energy

    Others

    SPAIN Outlook (USD Billion, 2018-2030)

    Spain Ceramic Coatings by Type

    Oxide

    Carbide

    Nitride

    Others

    Spain Ceramic Coatings by Method

    THERMAL SPRAY

    Physical Vapor Deposition (PVD)

    Chemical Vapor Deposition (CVD)

    Others

    Spain Ceramic Coatings by End-use

    Transportation & Automotive

    Energy

    Others

    Rest Of Europe Outlook (USD Billion, 2018-2030)

    REST OF EUROPE Ceramic Coatings by Type

    Oxide

    Carbide

    Nitride

    Others

    REST OF EUROPE Ceramic Coatings by Method

    THERMAL SPRAY

    Physical Vapor Deposition (PVD)

    Chemical Vapor Deposition (CVD)

    Others

    REST OF EUROPE Ceramic Coatings by End-use

    Transportation & Automotive

    Energy

    Others

    Asia-Pacific Outlook (USD Billion, 2018-2030)

    Asia-Pacific Ceramic Coatings by Type

    Oxide

    Carbide

    Nitride

    Others

    Asia-Pacific Ceramic Coatings by Method

    THERMAL SPRAY

    Physical Vapor Deposition (PVD)

    Chemical Vapor Deposition (CVD)

    Others

    Asia-Pacific Ceramic Coatings by End-use

    Transportation & Automotive

    Energy

    Others

    China Outlook (USD Billion, 2018-2030)

    China Ceramic Coatings by Type

    Oxide

    Carbide

    Nitride

    Others

    China Ceramic Coatings by Method

    THERMAL SPRAY

    Physical Vapor Deposition (PVD)

    Chemical Vapor Deposition (CVD)

    Others

    China Ceramic Coatings by End-use

    Transportation & Automotive

    Energy

    Others

    Japan Outlook (USD Billion, 2018-2030)

    Japan Ceramic Coatings by Type

    Oxide

    Carbide

    Nitride

    Others

    Japan Ceramic Coatings by Method

    THERMAL SPRAY

    Physical Vapor Deposition (PVD)

    Chemical Vapor Deposition (CVD)

    Others

    Japan Ceramic Coatings by End-use

    Transportation & Automotive

    Energy

    Others

    India Outlook (USD Billion, 2018-2030)

    India Ceramic Coatings by Type

    Oxide

    Carbide

    Nitride

    Others

    India Ceramic Coatings by Method

    THERMAL SPRAY

    Physical Vapor Deposition (PVD)

    Chemical Vapor Deposition (CVD)

    India Ceramic Coatings by End-use

    Transportation & Automotive

    Energy

    Others

    Others

    Australia Outlook (USD Billion, 2018-2030)

    Australia Ceramic Coatings by Type

    Oxide

    Carbide

    Nitride

    Others

    Australia Ceramic Coatings by Method

    THERMAL SPRAY

    Physical Vapor Deposition (PVD)

    Chemical Vapor Deposition (CVD)

    Australia Ceramic Coatings by End-use

    Transportation & Automotive

    Energy

    Others

    Rest of Asia-Pacific Outlook (USD Billion, 2018-2030)

    Rest of Asia-Pacific Low-Profile Additives by Type

    Oxide

    Carbide

    Nitride

    Polyesters

    Others

    Rest of Asia-Pacific Low-Profile Additives by Method

    THERMAL SPRAY

    Physical Vapor Deposition (PVD)

    Chemical Vapor Deposition (CVD)

    Others

    Rest of Asia-Pacific Low-Profile Additives by End-use

    Transportation & Automotive

    Energy

    Others

    Rest of the World Outlook (USD Billion, 2018-2030)

    Rest of the World Ceramic Coatings by Type

    Oxide

    Carbide

    Nitride

    Others

    Rest of the World Ceramic Coatings by Method

    THERMAL SPRAY

    Physical Vapor Deposition (PVD)

    Chemical Vapor Deposition (CVD)

    Others

    Rest of the World Ceramic Coatings by End-use

    Transportation & Automotive

    Energy

    Others

    • Middle East Outlook (USD Billion, 2018-2030)
    Middle East Ceramic Coatings by Type

    Oxide

    Carbide

    Nitride

    Polyesters

    Others

    Middle East Ceramic Coatings by Method

    THERMAL SPRAY

    Physical Vapor Deposition (PVD)

    Chemical Vapor Deposition (CVD)

    Others

    Middle East Ceramic Coatings by End-use

    Transportation & Automotive

    Energy

    Others

    Africa Outlook (USD Billion, 2018-2030)

    Africa Ceramic Coatings by Type

    Oxide

    Carbide

    Nitride

    Others

    Africa Ceramic Coatings by Method

    THERMAL SPRAY

    Physical Vapor Deposition (PVD)

    Chemical Vapor Deposition (CVD)

    Others

    Africa Ceramic Coatings by End-use

    Transportation & Automotive

    Energy

    Others

    Latin America Outlook (USD Billion, 2018-2030)

    Latin America Ceramic Coatings by Type

    Oxide

    Carbide

    Nitride

    Others

    Latin America Ceramic Coatings by Method

    THERMAL SPRAY

    Physical Vapor Deposition (PVD)

    Chemical Vapor Deposition (CVD)

    Others

    Latin America Ceramic Coatings by End-use

    Transportation & Automotive

    Energy

    Others

    Infographic

    Free Sample Request

    Kindly complete the form below to receive a free sample of this Report

    Get Free Sample

    Customer Strories

    “I am very pleased with how market segments have been defined in a relevant way for my purposes (such as "Portable Freezers & refrigerators" and "last-mile"). In general the report is well structured. Thanks very much for your efforts.”

    Victoria Milne

    Founder
    Case Study
    Chemicals and Materials