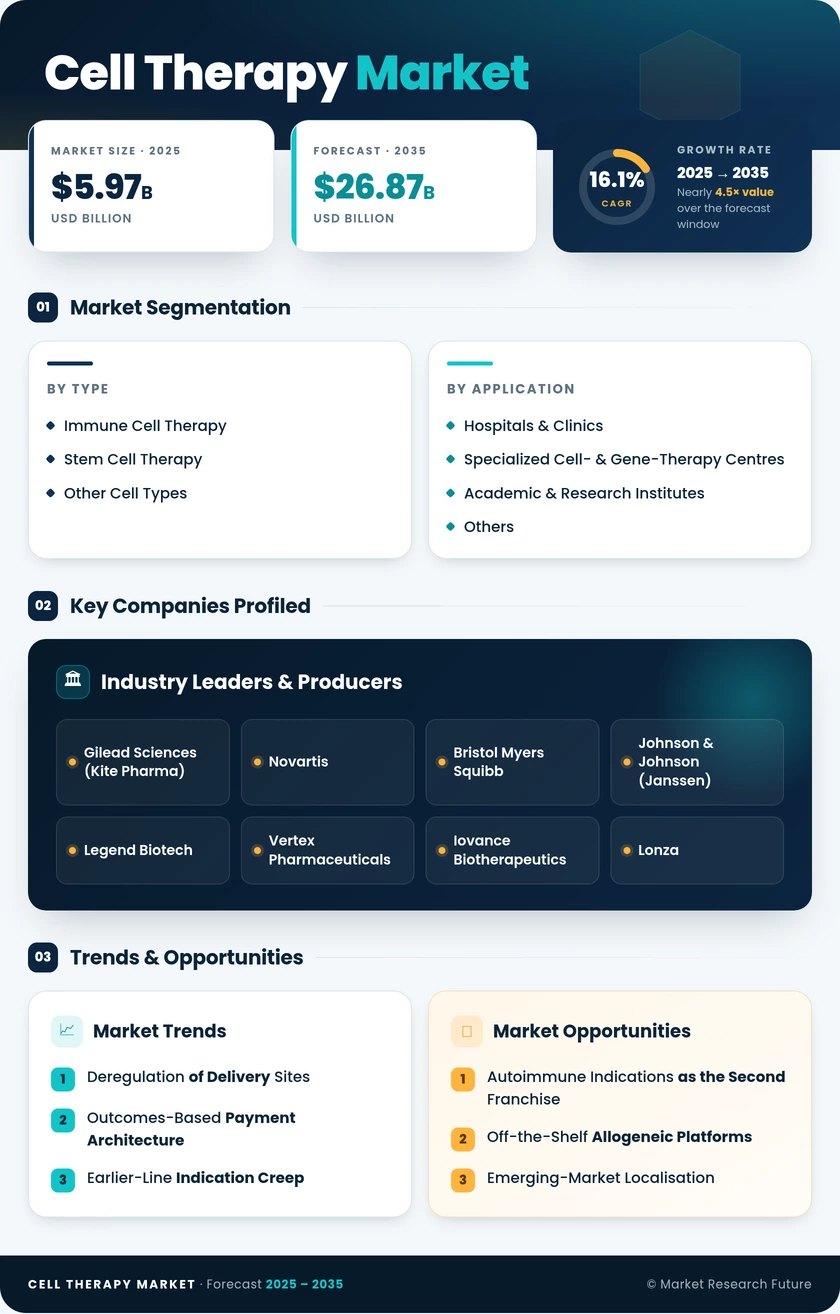
Cell Therapy Market (2026 - 2035)

Cell Therapy Market Research Report: Size, Share, Trend Analysis By Applications (Oncology, Cardiovascular Disease, Neurological Disorders, Orthopedic Disorders), By Types (Autologous Cell Therapy, Allogeneic Cell Therapy, Stem Cell Therapy), By Delivery Method (Intravenous Injection, Subcutaneous Injection, Intradermal Injection, Intramuscular Injection), By End Users (Hospitals, Research Institutions, Ambulatory Surgical Centers) and By Regional (North America, Europe, South America, Asia Pacific, Middle East and Africa) - Growth Outlook & Industry Forecast 2025 To 2035

Forecast Period
2026-2035
CAGR
16.1%
2025 Market Size
USD 5.97 Billion
2035 Market Size
USD 26.87 Billion
Life Sciences ● Updated August 2026 Report ID: MRFR/LS/3630-CR | Pages: 95 | Author: Vikita Thakur, Kinjoll Dey
  1. 1 Market Overview |
    1. 1.1 Study Assumptions & Market Definition |
    2. 1.2 Scope of the Study |
    3. 1.3 Research Methodology
  2. 2 Market Summary & Key Report Takeaways |
    1. 2.1 By Therapy Type |
    2. 2.2 By Sector |
    3. 2.3 By Geography
  3. 3 Global Market Size & Forecast (2021–2035) |
    1. 3.1 Historical Market Size (2021–2025) |
    2. 3.2 Current & Forecast Market Size (2026–2035) |
    3. 3.3 Market Size by Revenue (USD Billion) |
    4. 3.4 Year-over-Year Growth Analysis
  4. 4 Market Drivers Analysis |
    1. 4.1 Deregulation of Delivery Sites |
    2. 4.2 Outcomes-Based Payment Architecture |
    3. 4.3 Earlier-Line Indication Creep |
    4. 4.4 Manufacturing Throughput Economics
  5. 5 Market Restraints Analysis |
    1. 5.1 Price and the Budget-Impact Ceiling |
    2. 5.2 Tightening Evidentiary Standards |
    3. 5.3 Delivery Infrastructure Lag
  6. 6 Market Opportunity Analysis |
    1. 6.1 Autoimmune Indications as the Second Franchise |
    2. 6.2 Off-the-Shelf Allogeneic Platforms |
    3. 6.3 Emerging-Market Localisation |
    4. 6.4 Registry-Linked Data Monetisation |
    5. 6.5 Decentralised and Point-of-Care Manufacturing |
    6. 6.6 Industry Value Chain Analysis |
    7. 6.7 Porter's Five Forces Analysis
  7. 7 Regional Analysis |
    1. 7.1 North America | |
      1. 7.1.1 US | |
      2. 7.1.2 Canada | |
      3. 7.1.3 Mexico |
    2. 7.2 Europe | |
      1. 7.2.1 Germany | |
      2. 7.2.2 UK | |
      3. 7.2.3 France | |
      4. 7.2.4 Italy | |
      5. 7.2.5 Spain | |
      6. 7.2.6 Nordic Countries | |
      7. 7.2.7 Russia | |
      8. 7.2.8 Rest of Europe |
    3. 7.3 Asia-Pacific | |
      1. 7.3.1 China | |
      2. 7.3.2 India | |
      3. 7.3.3 Japan | |
      4. 7.3.4 South Korea | |
      5. 7.3.5 ASEAN | |
      6. 7.3.6 Rest of Asia-Pacific |
    4. 7.4 South America | |
      1. 7.4.1 Brazil | |
      2. 7.4.2 Argentina | |
      3. 7.4.3 Rest of South America |
    5. 7.5 Middle East & Africa | |
      1. 7.5.1 Saudi Arabia | |
      2. 7.5.2 UAE | |
      3. 7.5.3 South Africa | |
      4. 7.5.4 Egypt | |
      5. 7.5.5 Rest of Middle East & Africa
  8. 8 Future Outlook (2026–2035) |
    1. 8.1 Automation Replaces Artisanal Manufacturing |
    2. 8.2 Outpatient Delivery Becomes Standard |
    3. 8.3 Evidence Standards Reset the Competitive Bar |
    4. 8.4 Payment Innovation Goes Multinational
  9. 9 Segmentation Analysis |
    1. 9.1 By Therapy Type | |
      1. 9.1.1 Autologous Cell Therapy | |
      2. 9.1.2 Allogeneic Cell Therapy |
    2. 9.2 By Cell Type | |
      1. 9.2.1 Immune Cell Therapy | |
      2. 9.2.2 Stem Cell Therapy | |
      3. 9.2.3 Other Cell Types |
    3. 9.3 By Application | |
      1. 9.3.1 Oncology | |
      2. 9.3.2 Cardiovascular | |
      3. 9.3.3 Neurological Disorders | |
      4. 9.3.4 Musculoskeletal | |
      5. 9.3.5 Dermatology & Wound Care | |
      6. 9.3.6 Other Applications |
    4. 9.4 By End User | |
      1. 9.4.1 Hospitals & Clinics | |
      2. 9.4.2 Specialized Cell- & Gene-Therapy Centres | |
      3. 9.4.3 Academic & Research Institutes | |
      4. 9.4.4 Others
  10. 10 Competitive Landscape |
    1. 10.1 Market Share Analysis (2026) |
    2. 10.2 Competitive Benchmarking Matrix |
    3. 10.3 Company Profiles | |
      1. 10.3.1 Gilead Sciences (Kite Pharma) | |
      2. 10.3.2 Novartis | |
      3. 10.3.3 Bristol Myers Squibb | |
      4. 10.3.4 Johnson & Johnson (Janssen) | |
      5. 10.3.5 Legend Biotech | |
      6. 10.3.6 Vertex Pharmaceuticals | |
      7. 10.3.7 Iovance Biotherapeutics | |
      8. 10.3.8 Lonza | |
      9. 10.3.9 Mesoblast | |
      10. 10.3.10 Adaptimmune Therapeutics | |
      11. 10.3.11 Allogene Therapeutics | |
      12. 10.3.12 JW Therapeutics
  11. 11 Recent Developments & News
  12. 12 Report Scope & Methodology |
    1. 12.1 Study Period & Base Year |
    2. 12.2 Data Sources & Citations |
    3. 12.3 Abbreviations
  13. 13 Detailed Sources and Citations
  14. 14 Frequently Asked Questions (FAQs)
  15. 15 LIST OF TABLES |
  16. TABLE 1 Global Cell Therapy Market Size & Forecast, by Revenue (USD Billion), 2021–2035 |
  17. TABLE 2 Global Cell Therapy Market – Year-over-Year Growth Analysis, 2021–2035 |
  18. TABLE 3 Global Cell Therapy Market – Driver Impact Analysis, 2026–2035 |
  19. TABLE 4 Global Cell Therapy Market – Restraint Impact Analysis, 2026–2035 |
  20. TABLE 5 Global Cell Therapy Market Size, by Therapy Type, 2021–2035 (USD Billion) |
  21. TABLE 6 Global Cell Therapy Market Size, by Cell Type, 2021–2035 (USD Billion) |
  22. TABLE 7 Global Cell Therapy Market Size, by Application, 2021–2035 (USD Billion) |
  23. TABLE 8 Global Cell Therapy Market Size, by End User, 2021–2035 (USD Billion) |
  24. TABLE 9 Global Cell Therapy Market Size, by Region, 2021–2035 (USD Billion) |
  25. TABLE 10 North America Cell Therapy Market Size, by Country, 2021–2035 (USD Billion) |
  26. TABLE 11 Europe Cell Therapy Market Size, by Country, 2021–2035 (USD Billion) |
  27. TABLE 12 Asia-Pacific Cell Therapy Market Size, by Country, 2021–2035 (USD Billion) |
  28. TABLE 13 South America Cell Therapy Market Size, by Country, 2021–2035 (USD Billion) |
  29. TABLE 14 Middle East & Africa Cell Therapy Market Size, by Country, 2021–2035 (USD Billion) |
  30. TABLE 15 North America Cell Therapy Market Size, by Therapy Type, 2021–2035 (USD Billion) |
  31. TABLE 16 North America Cell Therapy Market Size, by Application, 2021–2035 (USD Billion) |
  32. TABLE 17 North America Cell Therapy Market Size, by End User, 2021–2035 (USD Billion) |
  33. TABLE 18 Europe Cell Therapy Market Size, by Therapy Type, 2021–2035 (USD Billion) |
  34. TABLE 19 Europe Cell Therapy Market Size, by Application, 2021–2035 (USD Billion) |
  35. TABLE 20 Europe Cell Therapy Market Size, by End User, 2021–2035 (USD Billion) |
  36. TABLE 21 Asia-Pacific Cell Therapy Market Size, by Therapy Type, 2021–2035 (USD Billion) |
  37. TABLE 22 Asia-Pacific Cell Therapy Market Size, by Application, 2021–2035 (USD Billion) |
  38. TABLE 23 Asia-Pacific Cell Therapy Market Size, by End User, 2021–2035 (USD Billion) |
  39. TABLE 24 South America Cell Therapy Market Size, by Application, 2021–2035 (USD Billion) |
  40. TABLE 25 Middle East & Africa Cell Therapy Market Size, by Application, 2021–2035 (USD Billion) |
  41. TABLE 26 US Cell Therapy Market Size, by Therapy Type, 2021–2035 (USD Billion) |
  42. TABLE 27 China Cell Therapy Market Size, by Therapy Type, 2021–2035 (USD Billion) |
  43. TABLE 28 Japan Cell Therapy Market Size, by Application, 2021–2035 (USD Billion) |
  44. TABLE 29 Germany Cell Therapy Market Size, by End User, 2021–2035 (USD Billion) |
  45. TABLE 30 Competitive Benchmarking Matrix – Global Cell Therapy Market, 2026 |
  46. TABLE 31 Company Profiles – Key Players, Global Cell Therapy Market |
  47. TABLE 32 Recent Developments & Strategic Announcements, 2023–2026 |
  48. TABLE 33 Report Scope & Methodology Summary |
  49. TABLE 34 Detailed Sources and Citations
  50. 16 LIST OF FIGURES |
  51. FIGURE 1 Global Cell Therapy Market – Market Dynamics Overview (Drivers, Restraints, Opportunities) |
  52. FIGURE 2 Global Cell Therapy Market – Industry Value Chain Analysis |
  53. FIGURE 3 Global Cell Therapy Market – Porter's Five Forces Analysis |
  54. FIGURE 4 Global Cell Therapy Market Size Trend & Forecast, 2021–2035 (USD Billion) |
  55. FIGURE 5 Global Cell Therapy Market – Year-over-Year Growth Rate, 2022–2035 (%) |
  56. FIGURE 6 Market Share by Therapy Type, 2025 vs 2035 (%) |
  57. FIGURE 7 Market Share by Cell Type, 2025 vs 2035 (%) |
  58. FIGURE 8 Market Share by Application, 2025 (%) |
  59. FIGURE 9 Market Share by End User, 2025 (%) |
  60. FIGURE 10 Regional Market Share Distribution, 2025 (%) |
  61. FIGURE 11 Regional CAGR Comparison, 2026–2035 (%) |
  62. FIGURE 12 North America Country-Level Share Distribution, 2025 (%) |
  63. FIGURE 13 Europe Country-Level Share Distribution, 2025 (%) |
  64. FIGURE 14 Asia-Pacific Country-Level Share Distribution, 2025 (%) |
  65. FIGURE 15 Competitive Landscape – Estimated Revenue Share Bands, 2025 (%) |
  66. FIGURE 16 Competitive Positioning Matrix – Portfolio Breadth vs Manufacturing Scale |
  67. FIGURE 17 Regulatory Milestone Timeline, 2023–2026 |
  68. FIGURE 18 Reimbursement Pathway Coverage Map, 2026
Share::
Request Free Sample

Segmentation Quick Reference

DimensionSub-SegmentsDominant SegmentFastest Growing Segment
By Therapy TypeAutologous Cell Therapy; Allogeneic Cell TherapyAutologous Cell TherapyAllogeneic Cell Therapy
By Cell TypeImmune Cell Therapy; Stem Cell Therapy; Other Cell TypesImmune Cell TherapyStem Cell Therapy
By ApplicationOncology; Cardiovascular; Neurological Disorders; Musculoskeletal; Dermatology & Wound Care; Other ApplicationsOncologyNeurological Disorders
By End UserHospitals & Clinics; Specialized Cell- & Gene-Therapy Centres; Academic & Research Institutes; OthersHospitals & ClinicsSpecialized Cell- & Gene-Therapy Centres
By GeographyNorth America; Europe; Asia-Pacific; South America; Middle East & AfricaNorth AmericaAsia-Pacific


Market Segmentation Overview

By Therapy Type

Sub-SegmentKey Trend
Autologous Cell TherapyLabel expansion into earlier treatment lines and outpatient administration following REMS removal
Allogeneic Cell TherapyBreakthrough designations in T-cell malignancies where autologous collection is not feasible


Autologous products carry the installed clinical evidence base and will hold majority revenue through the early 2030s. Allogeneic constructs are competing on logistics rather than efficacy — eliminating collection, bridging therapy, and manufacturing wait entirely.

By Cell Type

Sub-SegmentKey Trend
Immune Cell TherapyCAR-T, TIL and engineered TCR platforms consolidating around fewer, better-differentiated products
Stem Cell TherapyFirst US mesenchymal stromal cell approval reopening a category after prolonged regulatory drought
Other Cell TypesNiche dermal and chondrocyte products serving established musculoskeletal indications


Immune-cell platforms fund the sector's manufacturing infrastructure while stem-cell products supply the growth rate. Neurological and graft-versus-host indications are the categories to watch.

By Application

Sub-SegmentKey Trend
OncologyHaematologic malignancy moving toward standard-of-care positioning in second line
CardiovascularPost-infarction myocardial repair programs in mid-stage development
Neurological DisordersLate-stage Parkinson's disease pipeline with objective, quantifiable endpoints
MusculoskeletalCartilage and tendon repair products with established procedural reimbursement
Dermatology & Wound CareChronic wound and burn indications supported by device-adjacent coding
Other ApplicationsAutoimmune and ophthalmic candidates entering pivotal development


Oncology's dominance is structural, not permanent. Autoimmune and neurological indications address populations large enough to change the sector's manufacturing economics outright.

By End User

Sub-SegmentKey Trend
Hospitals & ClinicsCommunity site integration accelerating after certification requirements were withdrawn
Specialized Cell- & Gene-Therapy CentresPayer preference for dedicated infrastructure with documented outcome tracking
Academic & Research InstitutesPoint-of-care manufacturing of licensed constructs at fractional pricing
OthersAmbulatory infusion providers entering as toxicity profiles improve


Hospitals retain the majority because they own the apheresis and cryopreservation assets. Dedicated centres grow faster because payers negotiating outcomes-based contracts want consistent, auditable data collection.




Share::
Request Free Sample
Download PDF ×

We do not share your information with anyone. However, we may send you emails based on your report interest from time to time. You may contact us at any time to opt-out.