Certified Global Research Member
Isomar fd.webp Wcrc 57.webp
Key Questions Answered
  • Global Market Outlook
  • In-depth analysis of global and regional trends
  • Analyze and identify the major players in the market, their market share, key developments, etc.
  • To understand the capability of the major players based on products offered, financials, and strategies.
  • Identify disrupting products, companies, and trends.
  • To identify opportunities in the market.
  • Analyze the key challenges in the market.
  • Analyze the regional penetration of players, products, and services in the market.
  • Comparison of major players’ financial performance.
  • Evaluate strategies adopted by major players.
  • Recommendations
Why Choose Market Research Future?
  • Vigorous research methodologies for specific market.
  • Knowledge partners across the globe
  • Large network of partner consultants.
  • Ever-increasing/ Escalating data base with quarterly monitoring of various markets
  • Trusted by fortune 500 companies/startups/ universities/organizations
  • Large database of 5000+ markets reports.
  • Effective and prompt pre- and post-sales support.

Calf Milk Replacers Market Research Report Information By Type (Medicated, Non Medicated), By Source (Dairy Based and Non-Dairy Based), By Form (Liquid And Powder) And By Region (North America, Europe, Asia-Pacific, And Rest Of The World) –Market Forecast Till 2032


ID: MRFR/F-B & N/3753-HCR | 110 Pages | Author: Pradeep Nandi| April 2024

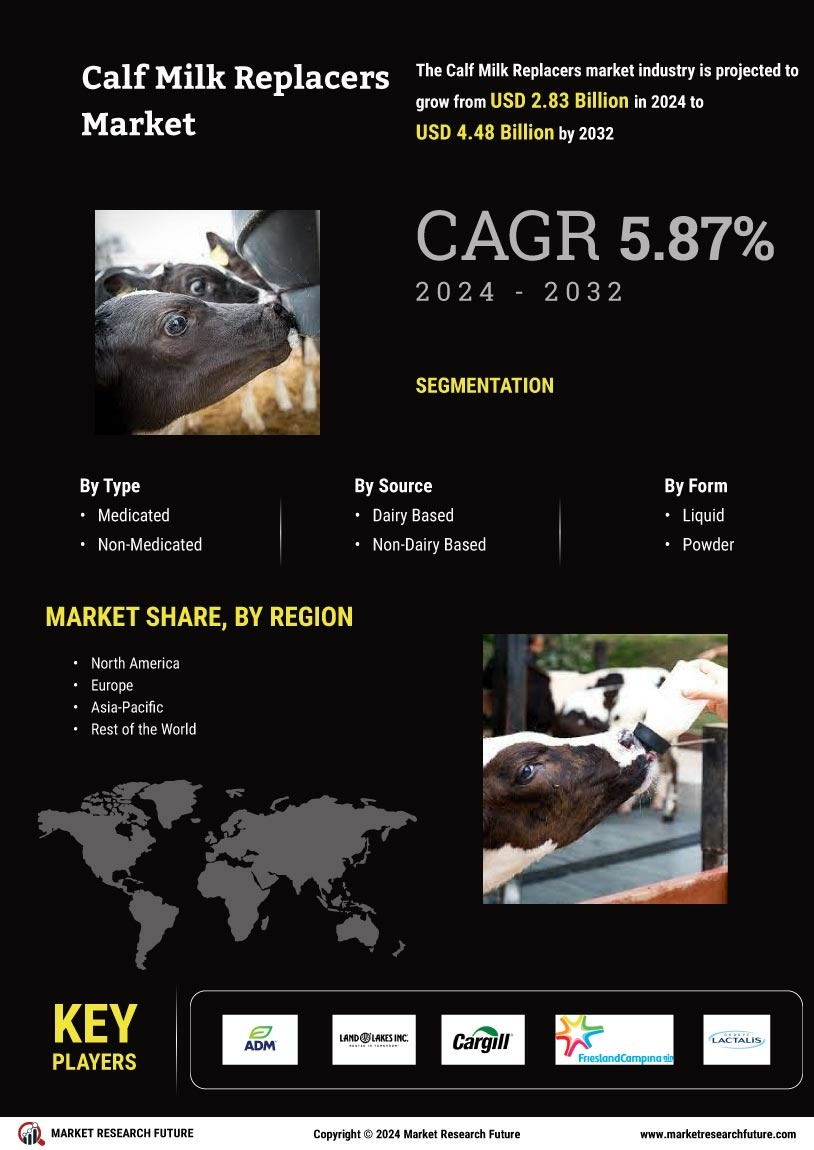
Calf Milk Replacers Market Segmentation


Calf Milk ReplacersCalf Milk Replacers Type Outlook (USD Billion, 2018-2032)


  • Medicated


  • Non Medicated


Calf Milk Replacers Source Outlook (USD Billion, 2018-2032)


  • Dairy Based


  • Non-Dairy Based


Calf Milk Replacers Form Outlook (USD Billion, 2018-2032)


  • Liquid


  • Powder


Calf Milk Replacers Regional Outlook (USD Billion, 2018-2032)


  • North America Outlook (USD Billion, 2018-2032)


    • North America Calf Milk Replacers by Type


      • Medicated


      • Non-Medicated


    • North America Calf Milk by Source


      • Dairy Based


      • Non-Dairy Based


    • North America Calf Milk Replacers by Form


      • Liquid


      • Powder


    • US Outlook (USD Billion, 2018-2032)


    • US Calf Milk Replacers by Type


      • Medicated


      • Non Medicated


    • US Calf Milk by Source


      • Dairy Based


      • Non-Dairy Based


    • US Calf Milk Replacers by Form


      • Liquid


      • Powder


    • CANADA Outlook (USD Billion, 2018-2032)


    • CANADA Calf Milk Replacers by Type


      • Medicated


      • Non Medicated


    • CANADA Calf Milk by Source


      • Dairy Based


      • Non-Dairy Based


    • CANADA Calf Milk Replacers by Form


      • Liquid


      • Powder


  • Europe Outlook (USD Billion, 2018-2032)


    • Europe Calf Milk Replacers by Type


      • Medicated


      • Non Medicated


    • Europe Calf Milk by Source


      • Dairy Based


      • Non-Dairy Based


    • Europe Calf Milk Replacers by Form


      • Liquid


      • Powder


    • Germany Outlook (USD Billion, 2018-2032)


    • Germany Calf Milk Replacers by Type


      • Medicated


      • Non Medicated


    • Germany Calf Milk by Source


      • Dairy Based


      • Non-Dairy Based


    • Germany Calf Milk Replacers by Form


      • Liquid


      • Powder


    • France Outlook (USD Billion, 2018-2032)


    • France Calf Milk Replacers by Type


      • Medicated


      • Non Medicated


    • France Calf Milk by Source


      • Dairy Based


      • Non-Dairy Based


    • France Calf Milk Replacers by Form


      • Liquid


      • Powder


    • UK Outlook (USD Billion, 2018-2032)


    • UK Calf Milk Replacers by Type


      • Medicated


      • Non Medicated


    • UK Calf Milk by Source


      • Dairy Based


      • Non-Dairy Based


    • UK Calf Milk Replacers by Form


      • Liquid


      • Powder


    • ITALY Outlook (USD Billion, 2018-2032)


    • ITALY Calf Milk Replacers by Type


      • Medicated


      • Non Medicated


    • ITALY Calf Milk by Source


      • Dairy Based


      • Non-Dairy Based


    • ITALY Calf Milk Replacers by Form


      • Liquid


      • Powder


    • SPAIN Outlook (USD Billion, 2018-2032)


    • Spain Calf Milk Replacers by Type


      • Medicated


      • Non Medicated


    • Spain Calf Milk by Source


      • Dairy Based


      • Non-Dairy Based


    • Spain Calf Milk Replacers by Form


      • Liquid


      • Powder


    • Rest Of Europe Outlook (USD Billion, 2018-2032)


    • Rest Of Europe Calf Milk Replacers by Type


      • Medicated


      • Non Medicated


    • Rest of Europe Calf Milk by Source


      • Dairy Based


      • Non-Dairy Based


    • REST OF EUROPE Calf Milk Replacers by Form


      • Liquid


      • Powder


  • Asia-Pacific Outlook (USD Billion, 2018-2032)


    • Asia-Pacific Calf Milk Replacers by Type


      • Medicated


      • Non Medicated


    • Asia Pacific Calf Milk by Source


      • Dairy Based


      • Non-Dairy Based


    • Asia-Pacific Calf Milk Replacers by Form


      • Liquid


      • Powder


    • China Outlook (USD Billion, 2018-2032)


    • China Calf Milk Replacers by Type


      • Medicated


      • Non Medicated


    • China Calf Milk by Source


      • Dairy Based


      • Non-Dairy Based


    • China Calf Milk Replacers by Form


      • Liquid


      • Powder


    • Japan Outlook (USD Billion, 2018-2032)


    • Japan Calf Milk Replacers by Type


      • Medicated


      • Non Medicated


    • Japan Calf Milk by Source


      • Dairy Based


      • Non-Dairy Based


    • Japan Calf Milk Replacers by Form


      • Liquid


      • Powder


    • India Outlook (USD Billion, 2018-2032)


    • India Calf Milk Replacers by Type


      • Medicated


      • Non Medicated


    • India Calf Milk by Source


      • Dairy Based


      • Non-Dairy Based


    • India Calf Milk Replacers by Form


      • Liquid


      • Powder


    • Australia Outlook (USD Billion, 2018-2032)


    • Australia Calf Milk Replacers by Type


      • Medicated


      • Non Medicated


    • Australia Calf Milk by Source


      • Dairy Based


      • Non-Dairy Based


    • Australia Calf Milk Replacers by Form


      • Liquid


      • Powder


    • Rest of Asia-Pacific Outlook (USD Billion, 2018-2032)


    • Rest of Asia-Pacific Calf Milk Replacers by Type


      • Medicated


      • Non Medicated


    • Rest of Asia-Pacific Calf Milk by Source


      • Dairy Based


      • Non-Dairy Based


    • Rest of Asia-Pacific Calf Milk Replacers by Form


      • Liquid


      • Powder


  • Rest of the World Outlook (USD Billion, 2018-2032)


    • Rest of the World Calf Milk Replacers by Type


      • Medicated


      • Non Medicated


    • Rest of the World Calf Milk by Source


      • Dairy Based


      • Non-Dairy Based


    • Rest of the World Calf Milk Replacers by Form


      • Liquid


      • Powder


    • Middle East Outlook (USD Billion, 2018-2032)


    • Middle East Calf Milk Replacers by Type


      • Medicated


      • Non Medicated


    • Middle East Calf Milk by Source


      • Dairy Based


      • Non-Dairy Based


    • Middle East Calf Milk Replacers by Form


      • Liquid


      • Powder


    • Africa Outlook (USD Billion, 2018-2032)


    • Africa Calf Milk Replacers by Type


      • Medicated


      • Non Medicated


    • Africa Calf Milk by Source


      • Dairy Based


      • Non-Dairy Based


    • Africa Calf Milk Replacers by Form


      • Liquid


      • Powder


    • Latin America Outlook (USD Billion, 2018-2032)


    • Latin America Calf Milk Replacers by Type


      • Medicated


      • Non Medicated


    • Latin America Calf Milk by Source


      • Dairy Based


      • Non-Dairy Based


    • Latin America Calf Milk Replacers by Form


      • Liquid


      • Powder


Leading companies partner with us for data-driven Insights
client_1 client_2 client_3 client_4 client_5 client_6 client_7 client_8 client_9 client_10
Please fill in Business Email for Quick Response

TABLE OF CONTENTS

1 Executive Summary

2 Scope of the Report

2.1 Market Definition

2.2 Scope of the Study

2.2.1 Research Objectives

2.2.2 Assumptions & Limitations

2.3 Market Structure

3 Market Research Methodology

3.1 Research Process

3.2 Secondary Research

3.3 Primary Research

3.4 Forecast Model

4 Market Landscape

4.1 Supply Chain Analysis

4.1.1 Raw Material Suppliers

4.1.2 Manufacturers/Producers

4.1.3 Distributors/Retailers/Wholesalers/E-Commerce

4.1.4 End Users

4.2 Porter’s Five Forces Analysis

4.2.1 Threat of New Entrants

4.2.2 Bargaining Power of Buyers

4.2.3 Bargaining Power of Suppliers

4.2.4 Threat of Substitutes

4.2.5 Rivalry

5 Market Dynamics of the Global Diary Desserts Market

5.1 Introduction

5.2 Drivers

5.3 Restraints

5.4 Opportunities

5.5 Challenges

6. Global Diary Desserts Market, by Type

6.1 Introduction

6.2 Ice creams

6.2.1 Market Estimates & Forecast, 2023–2032

6.2.2 Market Estimates & Forecast, by Region, 2023–2032

6.3 Yoghurt

6.3.1 Market Estimates & Forecast, 2023–2032

6.3.2 Market Estimates & Forecast, by Region, 2023–2032

6.4 Custards

6.4.1 Market Estimates & Forecast, 2023–2032

6.4.2 Market Estimates & Forecast, by Region, 2023–2032

6.5 Others

6.5.1 Market Estimates & Forecast, 2023–2032

6.5.2 Market Estimates & Forecast, by Region, 2023–2032

7. Global Diary Desserts Market, by Distribution Channel

7.1 Introduction

7.2 Store-Based

7.2.1 Supermarkets & Hypermarkets

7.2.1.1 Market Estimates & Forecast, 2023–2032

7.2.1.2 Market Estimates & Forecast, by Region, 2023–2032

7.2.2 Convenience Stores

7.2.2.1 Market Estimates & Forecast, 2023–2032

7.2.2.2 Market Estimates & Forecast, by Region, 2023–2032

7.2.4 Others

7.2.4.1 Market Estimates & Forecast, 2023–2032

7.2.4.2 Market Estimates & Forecast, by Region, 2023–2032

7.3 Non-Store-Based

7.3.1 Market Estimates & Forecast, 2023–2032

7.3.2 Market Estimates & Forecast, by Region, 2023–2032

8. Global Diary Desserts Market, by Region

8.1 Introduction

8.2 North America

8.2.1 Market Estimates & Forecast, 2023–2032

8.2.2 Market Estimates & Forecast, by Type, 2023–2032

8.2.3 Market Estimates & Forecast, by Distribution Channel, 2023–2032

8.2.4 US

8.2.4.1 Market Estimates & Forecast, 2023–2032

8.2.4.2 Market Estimates & Forecast, by Type, 2023–2032

8.2.4.3 Market Estimates & Forecast, by Distribution Channel, 2023–2032

8.2.5 Canada

8.2.5.1 Market Estimates & Forecast, 2023–2032

8.2.5.2 Market Estimates & Forecast, by Type, 2023–2032

8.2.5.3 Market Estimates & Forecast, by Distribution Channel, 2023–2032

8.2.6 Mexico

8.2.6.1 Market Estimates & Forecast, 2023–2032

8.2.6.2 Market Estimates & Forecast, by Type, 2023–2032

8.2.6.3 Market Estimates & Forecast, by Distribution Channel, 2023–2032

8.3 Europe

8.3.1 Market Estimates & Forecast, 2023–2032

8.3.2 Market Estimates & Forecast, by Type, 2023–2032

8.2.3 Market Estimates & Forecast, by Distribution Channel, 2023–2032

8.3.4 Germany

8.3.4.1 Market Estimates & Forecast, 2023–2032

8.3.4.2 Market Estimates & Forecast, by Type, 2023–2032

8.2.4.3 Market Estimates & Forecast, by Distribution Channel, 2023–2032

8.3.5 France

8.3.5.1 Market Estimates & Forecast, 2023–2032

8.3.5.2 Market Estimates & Forecast, by Type, 2023–2032

8.3.5.3 Market Estimates & Forecast, by Distribution Channel, 2023–2032

8.3.6 Italy

8.3.6.1 Market Estimates & Forecast, 2023–2032

8.3.6.2 Market Estimates & Forecast, by Type, 2023–2032

8.3.6.3 Market Estimates & Forecast, by Distribution Channel, 2023–2032

8.3.7 Spain

8.3.7.1 Market Estimates & Forecast, 2023–2032

8.3.7.2 Market Estimates & Forecast, by Type, 2023–2032

8.3.7.3 Market Estimates & Forecast, by Distribution Channel, 2023–2032

8.3.8 UK

8.3.8.1 Market Estimates & Forecast, 2023–2032

9.3.8.2 Market Estimates & Forecast, by Type, 2023–2032

8.3.8.3 Market Estimates & Forecast, by Distribution Channel, 2023–2032

8.3.9 Rest of Europe

8.3.9.1 Market Estimates & Forecast, 2023–2032

8.3.9.2 Market Estimates & Forecast, by Type, 2023–2032

8.3.9.3 Market Estimates & Forecast, by Distribution Channel, 2023–2032

8.4 Asia-Pacific

8.4.1 Market Estimates & Forecast, 2023–2032

8.4.2 Market Estimates & Forecast, by Type, 2023–2032

8.4.3 Market Estimates & Forecast, by Distribution Channel, 2023–2032

8.4.4 China

8.4.4.1 Market Estimates & Forecast, 2023–2032

8.4.4.2 Market Estimates & Forecast, by Type, 2023–2032

8.4.4.3 Market Estimates & Forecast, by Distribution Channel, 2023–2032

8.4.5 India

8.4.5.1 Market Estimates & Forecast, 2023–2032

8.4.5.2 Market Estimates & Forecast, by Type, 2023–2032

8.4.5.3 Market Estimates & Forecast, by Distribution Channel, 2023–2032

8.4.6 Japan

8.4.6.1 Market Estimates & Forecast, 2023–2032

8.4.6.2 Market Estimates & Forecast, by Type, 2023–2032

8.4.6.3 Market Estimates & Forecast, by Distribution Channel, 2023–2032

8.4.7 Australia & New Zealand

8.4.7.1 Market Estimates & Forecast, 2023–2032

8.4.7.2 Market Estimates & Forecast, by Type, 2023–2032

8.4.7.3 Market Estimates & Forecast, by Distribution Channel, 2023–2032

8.4.8 Rest of Asia-Pacific

8.4.8.1 Market Estimates & Forecast, 2023–2032

8.4.8.2 Market Estimates & Forecast, by Type, 2023–2032

8.4.8.3 Market Estimates & Forecast, by Distribution Channel, 2023–2032

8.5 Rest of the World (RoW)

8.5.1 Market Estimates & Forecast, 2023–2032

8.5.2 Market Estimates & Forecast, by Type, 2023–2032

8.5.3 Market Estimates & Forecast, by Distribution Channel, 2023–2032

8.5.4 South America

8.5.4.1 Market Estimates & Forecast, 2023–2032

8.5.4.2 Market Estimates & Forecast, by Type, 2023–2032

8.5.4.3 Market Estimates & Forecast, by Distribution Channel, 2023–2032

8.5.5 Middle East

8.5.5.1 Market Estimates & Forecast, 2023–2032

8.5.5.2 Market Estimates & Forecast, by Type, 2023–2032

8.5.5.3 Market Estimates & Forecast, by Distribution Channel, 2023–2032

8.5.6 Africa

8.5.6.1 Market Estimates & Forecast, 2023–2032

8.5.6.2 Market Estimates & Forecast, by Type, 2023–2032

8.5.6.3 Market Estimates & Forecast, by Distribution Channel, 2023–2032

9. Company Landscape

9.1 Introduction

9.2 Market Key Strategies

9.3 Key Development Analysis

(Expansions/Mergers & Acquisitions/Joint Ventures/New Product Developments/Agreements/Investments)

10. Company Profiles

10.1 Arla Foods amba

10.1.1 Company Overview

10.1.2 Financial Updates

10.1.3 Product/Business Segment Overview

10.1.4 Key Strategies

10.1.5 Key Developments

10.1.6 SWOT Analysis

10.2 Britannia Industries Limited

10.2.1 Company Overview

10.2.2 Financial Updates

10.2.3 Product/Business Segment Overview

10.2.4 Key Strategies

10.2.5 Key Developments

10.2.6 SWOT Analysis

10.3 Gujarat Cooperative Milk Marketing Federation Ltd

10.3.1 Company Overview

10.3.2 Financial Updates

10.3.3 Product/Business Segment Overview

10.3.4 Key Strategies

10.3.5 Key Developments

10.3.6 SWOT Analysis

10.4 Mother Dairy Fruit & Vegetable Pvt Ltd

10.4.1 Company Overview

10.4.2 Financial Updates

10.4.3 Product/Business Segment Overview

10.4.4 Key Strategies

10.4.5 Key Developments

10.4.6 SWOT Analysis

10.5 Lactalis Group

10.5.1 Company Overview

10.5.2 Financial Updates

10.5.3 Product/Business Segment Overview

10.5.4 Key Strategies

10.5.5 Key Developments

10.5.6 SWOT Analysis

10.6 Parag Milk Foods Ltd

10.6.1 Company Overview

10.6.2 Financial Updates

10.6.3 Product/Business Segment Overview

10.6.4 Key Strategies

10.6.5 Key Developments

10.6.6 SWOT Analysis

10.7 Nestlé SA

10.7.1 Company Overview

10.7.2 Financial Updates

10.7.3 Product/Business Segment Overview

10.7.4 Key Strategies

10.7.5 Key Developments

10.7.6 SWOT Analysis

10.8 Grupo Leche Pascual SA

10.8.1 Company Overview

10.8.2 Financial Updates

10.8.3 Product/Business Segment Overview

10.8.4 Key Strategies

10.8.5 Key Developments

10.8.6 SWOT Analysis

10.9 The Whitewave Foods Company

10.9.1 Company Overview

10.9.2 Financial Updates

10.9.3 Product/Business Segment Overview

10.9.4 Key Strategies

10.9.5 Key Developments

10.9.6 SWOT Analysis

10.10 Danone S.A.

10.10.1 Company Overview

10.10.2 Financial Updates

10.10.3 Product/Business Segment Overview

10.10.4 Key Strategies

10.10.5 Key Developments

10.10.6 SWOT Analysis

10.11 Unipex Dairy Products CO., LTD., P.O.

10.11.1 Company Overview

10.11.2 Financial Updates

10.11.3 Product/Business Segment Overview

10.11.4 Key Strategies

10.11.5 Key Developments

10.11.6 SWOT Analysis

10.12 Dean Foods Company

10.12.1 Company Overview

10.12.2 Financial Updates

10.12.3 Product/Business Segment Overview

10.12.4 Key Strategies

10.12.5 Key Developments

10.12.6 SWOT Analysis

10.13 Royal FrieslandCampina N.V.

10.13.1 Company Overview

10.13.2 Financial Updates

10.13.3 Product/Business Segment Overview

10.13.4 Key Strategies

10.13.5 Key Developments

10.13.6 SWOT Analysis

10.14 Parmalat S.p.A

10.14.1 Company Overview

10.14.2 Financial Updates

10.14.3 Product/Business Segment Overview

10.14.4 Key Strategies

10.14.5 Key Developments

10.14.6 SWOT Analysis

10.15 Baskin-Robbins

10.15.1 Company Overview

10.15.2 Financial Updates

10.15.3 Product/Business Segment Overview

10.15.4 Key Strategies

10.15.5 Key Developments

10.15.6 SWOT Analysis

13. Conclusion

LIST OF TABLES

Table 1 Global Diary Desserts Market, by Region, 2023–2032 (USD Million)

Table 2 Global Diary Desserts Market, by Type, 2023–2032 (USD Million)

Table 3 Global Diary Desserts Market, by Distribution Channel, 2023–2032 (USD Million)

Table 4 North America: Diary Desserts Market, by Country, 2023–2032 (USD Million)

Table 5 North America: Diary Desserts Market, by Type, 2023–2032 (USD Million)

Table 6 North America: Diary Desserts Market, by Distribution Channel, 2023–2032 (USD Million)

Table 7 US: Diary Desserts Market, by Type, 2023–2032 (USD Million)

Table 8 US: Diary Desserts Market, by Distribution Channel, 2023–2032 (USD Million)

Table 9 Canada: Diary Desserts Market, by Type, 2023–2032 (USD Million)

Table 10 Canada: Diary Desserts Market, by Distribution Channel, 2023–2032 (USD Million)

Table 11 Mexico: Diary Desserts Market, by Type, 2023–2032 (USD Million)

Table 12 Mexico: Diary Desserts Market, by Distribution Channel, 2023–2032 (USD Million)

Table 13 Europe: Diary Desserts Market, by Country, 2023–2032 (USD Million)

Table 14 Europe: Diary Desserts Market, by Type, 2023–2032 (USD Million)

Table 15 Europe: Diary Desserts Market, by Distribution Channel, 2023–2032 (USD Million)

Table 16 Germany: Diary Desserts Market, by Type, 2023–2032 (USD Million)

Table 17 Germany: Diary Desserts Market, by Distribution Channel, 2023–2032 (USD Million)

Table 18 France: Diary Desserts Market, by Type, 2023–2032 (USD Million)

Table 19 France: Diary Desserts Market, by Distribution Channel, 2023–2032 (USD Million)

Table 20 Italy: Diary Desserts Market, by Type, 2023–2032 (USD Million)

Table 21 Italy: Diary Desserts Market, by Distribution Channel, 2023–2032 (USD Million)

Table 22 Spain: Diary Desserts Market, by Type, 2023–2032 (USD Million)

Table 23 Spain: Diary Desserts Market, by Distribution Channel, 2023–2032 (USD Million)

Table 24 UK: Diary Desserts Market, by Type, 2023–2032 (USD Million)

Table 25 UK: Diary Desserts Market, by Distribution Channel, 2023–2032 (USD Million)

Table 26 Rest of Europe: Diary Desserts Market, by Type, 2023–2032 (USD Million)

Table 27 Rest of Europe: Diary Desserts Market, by Distribution Channel, 2023–2032 (USD Million)

Table 28 Asia-Pacific: Diary Desserts Market, by Country, 2023–2032 (USD Million)

Table 29 Asia-Pacific: Diary Desserts Market, by Type, 2023–2032 (USD Million)

Table 30 Asia-Pacific: Diary Desserts Market, by Distribution Channel, 2023–2032 (USD Million)

Table 31 China: Diary Desserts Market, by Type, 2023–2032 (USD Million)

Table 32 China: Diary Desserts Market, by Distribution Channel, 2023–2032 (USD Million)

Table 33 India: Diary Desserts Market, by Type, 2023–2032 (USD Million)

Table 34 India: Diary Desserts Market, by Distribution Channel, 2023–2032 (USD Million)

Table 35 Japan: Diary Desserts Market, by Type, 2023–2032 (USD Million)

Table 36 Japan: Diary Desserts Market, by Distribution Channel, 2023–2032 (USD Million)

Table 37 Australia & New Zealand: Diary Desserts Market, by Type, 2023–2032 (USD Million)

Table 38 Australia & New Zealand: Diary Desserts Market, by Distribution Channel, 2023–2032 (USD Million)

Table 39 Rest of Asia-Pacific: Diary Desserts Market, by Type, 2023–2032 (USD Million)

Table 40 Rest of Asia-Pacific: Diary Desserts Market, by Distribution Channel, 2023–2032 (USD Million)

Table 41 Rest of the World (RoW): Diary Desserts Market, by Country, 2023–2032 (USD Million)

Table 42 Rest of the World (RoW): Diary Desserts Market, by Type, 2023–2032 (USD Million)

Table 43 Rest of the World (RoW): Diary Desserts Market, by Distribution Channel, 2023–2032 (USD Million)

Table 44 South America: Diary Desserts Market, by Type, 2023–2032 (USD Million)

Table 45 South America: Diary Desserts Market, by Distribution Channel, 2023–2032 (USD Million)

Table 46 Middle East: Diary Desserts Market, by Type, 2023–2032 (USD Million)

Table 47 Middle East: Diary Desserts Market, by Distribution Channel, 2023–2032 (USD Million)

Table 48 Africa: Diary Desserts Market, by Type, 2023–2032 (USD Million)

Table 49 Africa: Diary Desserts Market, by Distribution Channel, 2023–2032 (USD Million)

LIST OF FIGURES

FIGURE 1 Global Diary Desserts Market Segmentation

FIGURE 2 Forecast Research Methodology

FIGURE 3 Five Forces Analysis of the Global Diary Desserts Market

FIGURE 4 Value Chain of the Global Diary Desserts Market

FIGURE 5 Share of the Global Diary Desserts Market in 2022, by Country (%)

FIGURE 6 Global Diary Desserts Market, by Region, 2023–2032,

FIGURE 7 Global Diary Desserts Market Size, by Type, 2022

FIGURE 8 Share of the Global Diary Desserts Market, by Type, 2023–2032 (%)

FIGURE 9 Global Diary Desserts Market Size, by Distribution Channel, 2022

FIGURE 10 Share of the Global Diary Desserts Market, by Distribution Channel, 2023–2032 (%)

Purchase Option
Single User $ 4,950
Multiuser License $ 5,950
Enterprise User $ 7,250
Compare Licenses
Tailored for You
  • Dedicated Research on any specifics segment or region.
  • Focused Research on specific players in the market.
  • Custom Report based only on your requirements.
  • Flexibility to add or subtract any chapter in the study.
  • Historic data from 2014 and forecasts outlook till 2040.
  • Flexibility of providing data/insights in formats (PDF, PPT, Excel).
  • Provide cross segmentation in applicable scenario/markets.