Request Free Sample ×

Kindly complete the form below to receive a free sample of this Report

* Please use a valid business email

Leading companies partner with us for data-driven Insights

clients tt-cursor
Hero Background

Brazil Frozen Fruits Market

ID: MRFR/FnB/45443-HCR
128 Pages
Snehal Singh
Last Updated: April 06, 2026

Brazil Frozen Fruits Market Size, Share, Industry Trend & Analysis Research Report By Recent Trends (Vegan and Plant-Based Focus, Innovation in Freezing Techniques, Organic, Non-GMO, and Clean Label Products) andBy Recent Developments (Increased fruit variety with minimally processed, single-serve options, Addition of banana and coconut flavor to frozen fruits, Expansion of frozen food containing frozen foods, snacks, and more)- Forecast to 2035

Share:
Download PDF ×

We do not share your information with anyone. However, we may send you emails based on your report interest from time to time. You may contact us at any time to opt-out.

Brazil Frozen Fruits Market Infographic
Purchase Options
  1. 1 SECTION I: EXECUTIVE SUMMARY AND KEY HIGHLIGHTS
  2.   1.1 EXECUTIVE SUMMARY
  3.     1.1.1 Market Overview
  4.     1.1.2 Key Findings
  5.     1.1.3 Market Segmentation
  6.     1.1.4 Competitive Landscape
  7.     1.1.5 Challenges and Opportunities
  8.     1.1.6 Future Outlook
  9. 2 SECTION II: SCOPING, METHODOLOGY AND MARKET STRUCTURE
  10.   2.1 MARKET INTRODUCTION
  11.     2.1.1 Definition
  12.     2.1.2 Scope of the study
  13.       2.1.2.1 Research Objective
  14.       2.1.2.2 Assumption
  15.       2.1.2.3 Limitations
  16.   2.2 RESEARCH METHODOLOGY
  17.     2.2.1 Overview
  18.     2.2.2 Data Mining
  19.     2.2.3 Secondary Research
  20.     2.2.4 Primary Research
  21.       2.2.4.1 Primary Interviews and Information Gathering Process
  22.       2.2.4.2 Breakdown of Primary Respondents
  23.     2.2.5 Forecasting Model
  24.     2.2.6 Market Size Estimation
  25.       2.2.6.1 Bottom-Up Approach
  26.       2.2.6.2 Top-Down Approach
  27.     2.2.7 Data Triangulation
  28.     2.2.8 Validation
  29. 3 SECTION III: QUALITATIVE ANALYSIS
  30.   3.1 MARKET DYNAMICS
  31.     3.1.1 Overview
  32.     3.1.2 Drivers
  33.     3.1.3 Restraints
  34.     3.1.4 Opportunities
  35.   3.2 MARKET FACTOR ANALYSIS
  36.     3.2.1 Value chain Analysis
  37.     3.2.2 Porter's Five Forces Analysis
  38.       3.2.2.1 Bargaining Power of Suppliers
  39.       3.2.2.2 Bargaining Power of Buyers
  40.       3.2.2.3 Threat of New Entrants
  41.       3.2.2.4 Threat of Substitutes
  42.       3.2.2.5 Intensity of Rivalry
  43.     3.2.3 COVID-19 Impact Analysis
  44.       3.2.3.1 Market Impact Analysis
  45.       3.2.3.2 Regional Impact
  46.       3.2.3.3 Opportunity and Threat Analysis
  47. 4 SECTION IV: QUANTITATIVE ANALYSIS
  48.   4.1 Chemicals and Materials, BY Type (USD Million)
  49.     4.1.1 Berries
  50.     4.1.2 Tropical Fruits
  51.     4.1.3 Stone Fruits
  52.     4.1.4 Citrus Fruits
  53.     4.1.5 Bananas
  54.   4.2 Chemicals and Materials, BY Form (USD Million)
  55.     4.2.1 Whole Fruits
  56.     4.2.2 Sliced Fruits
  57.     4.2.3 Puree
  58.     4.2.4 Diced Fruits
  59.   4.3 Chemicals and Materials, BY End Use (USD Million)
  60.     4.3.1 Food Processing
  61.     4.3.2 Smoothie Preparation
  62.     4.3.3 Baking
  63.     4.3.4 Snacking
  64.   4.4 Chemicals and Materials, BY Distribution Channel (USD Million)
  65.     4.4.1 Online Retail
  66.     4.4.2 Supermarkets
  67.     4.4.3 Convenience Stores
  68.     4.4.4 Specialty Stores
  69. 5 SECTION V: COMPETITIVE ANALYSIS
  70.   5.1 Competitive Landscape
  71.     5.1.1 Overview
  72.     5.1.2 Competitive Analysis
  73.     5.1.3 Market share Analysis
  74.     5.1.4 Major Growth Strategy in the Chemicals and Materials
  75.     5.1.5 Competitive Benchmarking
  76.     5.1.6 Leading Players in Terms of Number of Developments in the Chemicals and Materials
  77.     5.1.7 Key developments and growth strategies
  78.       5.1.7.1 New Product Launch/Service Deployment
  79.       5.1.7.2 Merger & Acquisitions
  80.       5.1.7.3 Joint Ventures
  81.     5.1.8 Major Players Financial Matrix
  82.       5.1.8.1 Sales and Operating Income
  83.       5.1.8.2 Major Players R&D Expenditure. 2023
  84.   5.2 Company Profiles
  85.     5.2.1 Dole Food Company (US)
  86.       5.2.1.1 Financial Overview
  87.       5.2.1.2 Products Offered
  88.       5.2.1.3 Key Developments
  89.       5.2.1.4 SWOT Analysis
  90.       5.2.1.5 Key Strategies
  91.     5.2.2 Ardo (BE)
  92.       5.2.2.1 Financial Overview
  93.       5.2.2.2 Products Offered
  94.       5.2.2.3 Key Developments
  95.       5.2.2.4 SWOT Analysis
  96.       5.2.2.5 Key Strategies
  97.     5.2.3 Kraft Heinz Company (US)
  98.       5.2.3.1 Financial Overview
  99.       5.2.3.2 Products Offered
  100.       5.2.3.3 Key Developments
  101.       5.2.3.4 SWOT Analysis
  102.       5.2.3.5 Key Strategies
  103.     5.2.4 Pinnacle Foods (US)
  104.       5.2.4.1 Financial Overview
  105.       5.2.4.2 Products Offered
  106.       5.2.4.3 Key Developments
  107.       5.2.4.4 SWOT Analysis
  108.       5.2.4.5 Key Strategies
  109.     5.2.5 Greenyard (BE)
  110.       5.2.5.1 Financial Overview
  111.       5.2.5.2 Products Offered
  112.       5.2.5.3 Key Developments
  113.       5.2.5.4 SWOT Analysis
  114.       5.2.5.5 Key Strategies
  115.     5.2.6 SunOpta (CA)
  116.       5.2.6.1 Financial Overview
  117.       5.2.6.2 Products Offered
  118.       5.2.6.3 Key Developments
  119.       5.2.6.4 SWOT Analysis
  120.       5.2.6.5 Key Strategies
  121.     5.2.7 Chiquita Brands International (US)
  122.       5.2.7.1 Financial Overview
  123.       5.2.7.2 Products Offered
  124.       5.2.7.3 Key Developments
  125.       5.2.7.4 SWOT Analysis
  126.       5.2.7.5 Key Strategies
  127.     5.2.8 Birds Eye (UK)
  128.       5.2.8.1 Financial Overview
  129.       5.2.8.2 Products Offered
  130.       5.2.8.3 Key Developments
  131.       5.2.8.4 SWOT Analysis
  132.       5.2.8.5 Key Strategies
  133.   5.3 Appendix
  134.     5.3.1 References
  135.     5.3.2 Related Reports
  136. 6 LIST OF FIGURES
  137.   6.1 MARKET SYNOPSIS
  138.   6.2 BRAZIL MARKET ANALYSIS BY TYPE
  139.   6.3 BRAZIL MARKET ANALYSIS BY FORM
  140.   6.4 BRAZIL MARKET ANALYSIS BY END USE
  141.   6.5 BRAZIL MARKET ANALYSIS BY DISTRIBUTION CHANNEL
  142.   6.6 KEY BUYING CRITERIA OF CHEMICALS AND MATERIALS
  143.   6.7 RESEARCH PROCESS OF MRFR
  144.   6.8 DRO ANALYSIS OF CHEMICALS AND MATERIALS
  145.   6.9 DRIVERS IMPACT ANALYSIS: CHEMICALS AND MATERIALS
  146.   6.10 RESTRAINTS IMPACT ANALYSIS: CHEMICALS AND MATERIALS
  147.   6.11 SUPPLY / VALUE CHAIN: CHEMICALS AND MATERIALS
  148.   6.12 CHEMICALS AND MATERIALS, BY TYPE, 2024 (% SHARE)
  149.   6.13 CHEMICALS AND MATERIALS, BY TYPE, 2024 TO 2035 (USD Million)
  150.   6.14 CHEMICALS AND MATERIALS, BY FORM, 2024 (% SHARE)
  151.   6.15 CHEMICALS AND MATERIALS, BY FORM, 2024 TO 2035 (USD Million)
  152.   6.16 CHEMICALS AND MATERIALS, BY END USE, 2024 (% SHARE)
  153.   6.17 CHEMICALS AND MATERIALS, BY END USE, 2024 TO 2035 (USD Million)
  154.   6.18 CHEMICALS AND MATERIALS, BY DISTRIBUTION CHANNEL, 2024 (% SHARE)
  155.   6.19 CHEMICALS AND MATERIALS, BY DISTRIBUTION CHANNEL, 2024 TO 2035 (USD Million)
  156.   6.20 BENCHMARKING OF MAJOR COMPETITORS
  157. 7 LIST OF TABLES
  158.   7.1 LIST OF ASSUMPTIONS
  159.     7.1.1
  160.   7.2 Brazil MARKET SIZE ESTIMATES; FORECAST
  161.     7.2.1 BY TYPE, 2025-2035 (USD Million)
  162.     7.2.2 BY FORM, 2025-2035 (USD Million)
  163.     7.2.3 BY END USE, 2025-2035 (USD Million)
  164.     7.2.4 BY DISTRIBUTION CHANNEL, 2025-2035 (USD Million)
  165.   7.3 PRODUCT LAUNCH/PRODUCT DEVELOPMENT/APPROVAL
  166.     7.3.1
  167.   7.4 ACQUISITION/PARTNERSHIP
  168.     7.4.1

Brazil Chemicals and Materials Market Segmentation

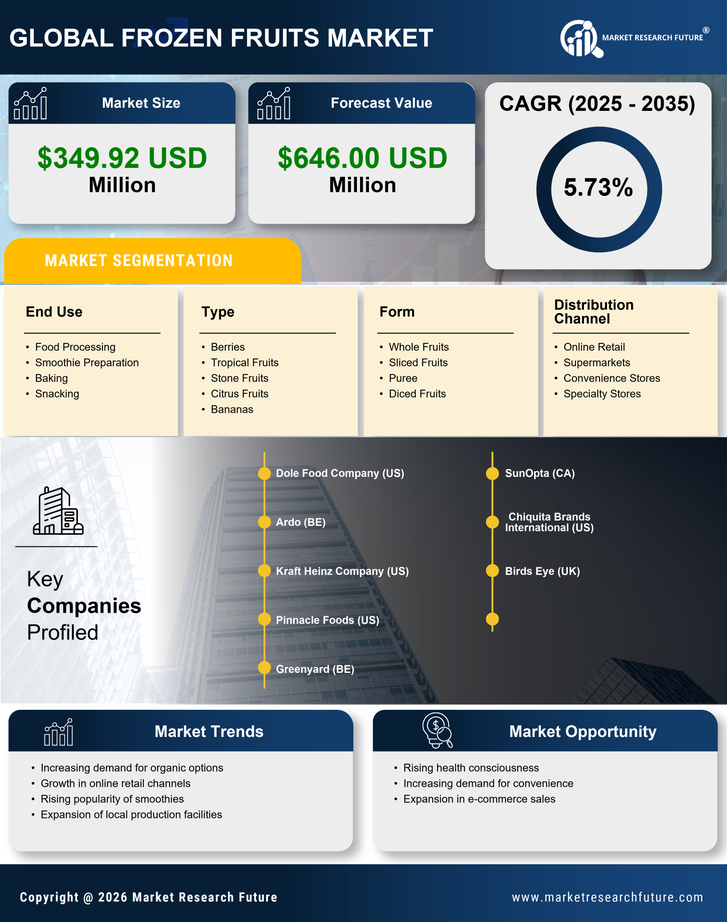
Chemicals and Materials By Type (USD Million, 2025-2035)

  • Berries
  • Tropical Fruits
  • Stone Fruits
  • Citrus Fruits
  • Bananas

Chemicals and Materials By Form (USD Million, 2025-2035)

  • Whole Fruits
  • Sliced Fruits
  • Puree
  • Diced Fruits

Chemicals and Materials By End Use (USD Million, 2025-2035)

  • Food Processing
  • Smoothie Preparation
  • Baking
  • Snacking

Chemicals and Materials By Distribution Channel (USD Million, 2025-2035)

  • Online Retail
  • Supermarkets
  • Convenience Stores
  • Specialty Stores

Compare Licence

×
Features License Type
Single User Multiuser License Enterprise User
Price $4,950 $5,950 $7,250
Maximum User Access Limit 1 User Upto 10 Users Unrestricted Access Throughout the Organization
Free Customization
Direct Access to Analyst
Deliverable Format
Platform Access
Discount on Next Purchase 10% 15% 15%
Printable Versions