Certified Global Research Member
Isomar fd.webp Wcrc 57.webp
Key Questions Answered
  • Global Market Outlook
  • In-depth analysis of global and regional trends
  • Analyze and identify the major players in the market, their market share, key developments, etc.
  • To understand the capability of the major players based on products offered, financials, and strategies.
  • Identify disrupting products, companies, and trends.
  • To identify opportunities in the market.
  • Analyze the key challenges in the market.
  • Analyze the regional penetration of players, products, and services in the market.
  • Comparison of major players’ financial performance.
  • Evaluate strategies adopted by major players.
  • Recommendations
Why Choose Market Research Future?
  • Vigorous research methodologies for specific market.
  • Knowledge partners across the globe
  • Large network of partner consultants.
  • Ever-increasing/ Escalating data base with quarterly monitoring of various markets
  • Trusted by fortune 500 companies/startups/ universities/organizations
  • Large database of 5000+ markets reports.
  • Effective and prompt pre- and post-sales support.

Brain Computer Interface Market Research Report: Information By Type (Non-Invasive, Invasive, and Partially Invasive), Component (Hardware (Headsets, Boards, Sensors, and Electrodes), Software, and Service), Application (Disabilities & Brain Function Repair, User State Monitoring, Games & Entertainment, Communication & Control, Advertisement & Marketing, Smart Environments), Industry Verticals (Healthcare, Manufacturing & Industrial, Government, Media & Entertainment, Military & Defense, Education) Regions - Forecast Till 2032.


ID: MRFR/ICT/6940-CR | 166 Pages | Author: Aarti Dhapte| January 2023

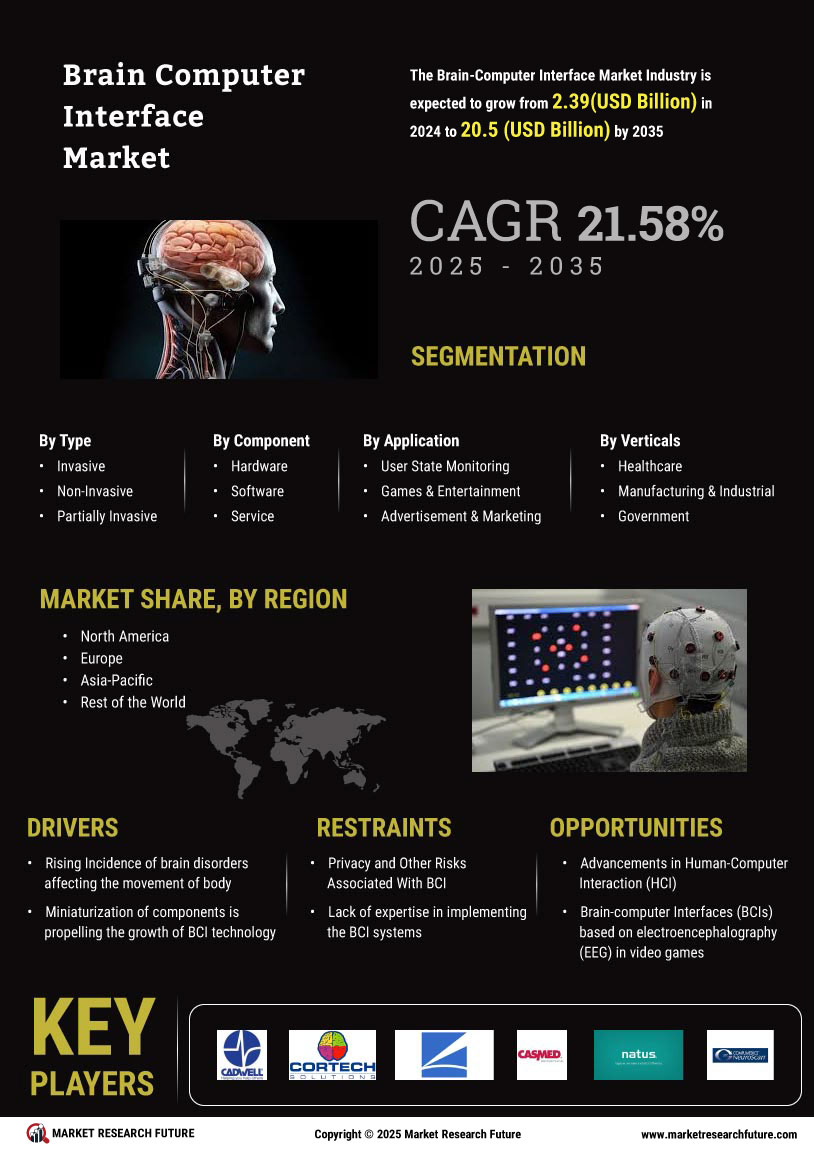
Brain Computer Interface Market Segmentation


Brain Computer Interface Type Outlook (USD Billion, 2018-2032)


  • Invasive


  • Non-Invasive


  • Partially Invasive


Brain Computer Interface Component Outlook (USD Billion, 2018-2032)


  • Hardware


    • Headsets


    • Boards


    • Sensors


    • Electrodes


  • Software


  • Service


Brain Computer Interface Application Outlook (USD Billion, 2018-2032)


  • Communication & Control


  • Disabilities And Brain Function Repair


  • User State Monitoring


  • Games & Entertainment


  • Advertisement & Marketing


  • Smart Environments


  • Others


Brain Computer Interface Industry Verticals Outlook (USD Billion, 2018-2032)


  • Healthcare


  • Manufacturing & Industrial


  • Government


  • Military & Defense


  • Media & Entertainment


  • Education


  • Others


Brain Computer Interface Regional Outlook (USD Billion, 2018-2032)


  • North America Outlook (USD Billion, 2018-2032)


    • North America Brain Computer Interface by Type


      • Invasive


      • Non-Invasive


      • Partially Invasive


    • North America Brain Computer Interface by Component


      • Hardware


        • Headsets


        • Boards


        • Sensors


        • Electrodes


      • Software


      • Service


    • North America Brain Computer Interface by Application


      • Communication & Control


      • Disabilities And Brain Function Repair


      • User State Monitoring


      • Games & Entertainment


      • Advertisement & Marketing


      • Smart Environments


      • Others


    • North America Brain Computer Interface by Industry Verticals


      • Healthcare


      • Manufacturing & Industrial


      • Government


      • Military & Defense


      • Media & Entertainment


      • Education


      • Others


    • US Outlook (USD Billion, 2018-2032)


    • US Brain Computer Interface by Type


      • Invasive


      • Non-Invasive


      • Partially Invasive


    • US Brain Computer Interface by Component


      • Hardware


        • Headsets


        • Boards


        • Sensors


        • Electrodes


      • Software


      • Service


    • US Brain Computer Interface by Application


      • Communication & Control


      • Disabilities And Brain Function Repair


      • User State Monitoring


      • Games & Entertainment


      • Advertisement & Marketing


      • Smart Environments


      • Others


    • US Brain Computer Interface by Industry Verticals


      • Healthcare


      • Manufacturing & Industrial


      • Government


      • Military & Defense


      • Media & Entertainment


      • Education


      • Others


    • CANADA Outlook (USD Billion, 2018-2032)


    • CANADA Brain Computer Interface by Type


      • Invasive


      • Non-Invasive


      • Partially Invasive


    • CANADA Brain Computer Interface by Component


      • Hardware


        • Headsets


        • Boards


        • Sensors


        • Electrodes


      • Software


      • Service


    • CANADA Brain Computer Interface by Application


      • Communication & Control


      • Disabilities And Brain Function Repair


      • User State Monitoring


      • Games & Entertainment


      • Advertisement & Marketing


      • Smart Environments


      • Others


    • CANADA Brain Computer Interface by Industry Verticals


      • Healthcare


      • Manufacturing & Industrial


      • Government


      • Military & Defense


      • Media & Entertainment


      • Education


      • Others


  • Europe Outlook (USD Billion, 2018-2032)


    • Europe Brain Computer Interface by Type


      • Invasive


      • Non-Invasive


      • Partially Invasive


    • Europe Brain Computer Interface by Component


      • Hardware


        • Headsets


        • Boards


        • Sensors


        • Electrodes


      • Software


      • Service


    • Europe Brain Computer Interface by Application


      • Communication & Control


      • Disabilities And Brain Function Repair


      • User State Monitoring


      • Games & Entertainment


      • Advertisement & Marketing


      • Smart Environments


      • Others


    • Europe Brain Computer Interface by Industry Verticals


      • Healthcare


      • Manufacturing & Industrial


      • Government


      • Military & Defense


      • Media & Entertainment


      • Education


      • Others


    • Germany Outlook (USD Billion, 2018-2032)


    • Germany Brain Computer Interface by Type


      • Invasive


      • Non-Invasive


      • Partially Invasive


    • Germany Brain Computer Interface by Component


      • Hardware


        • Headsets


        • Boards


        • Sensors


        • Electrodes


      • Software


      • Service


    • Germany Brain Computer Interface by Application


      • Communication & Control


      • Disabilities And Brain Function Repair


      • User State Monitoring


      • Games & Entertainment


      • Advertisement & Marketing


      • Smart Environments


      • Others


    • Germany Brain Computer Interface by Industry Verticals


      • Healthcare


      • Manufacturing & Industrial


      • Government


      • Military & Defense


      • Media & Entertainment


      • Education


      • Others


    • France Outlook (USD Billion, 2018-2032)


    • France Brain Computer Interface by Type


      • Invasive


      • Non-Invasive


      • Partially Invasive


    • France Brain Computer Interface by Component


      • Hardware


        • Headsets


        • Boards


        • Sensors


        • Electrodes


      • Software


      • Service


    • France Brain Computer Interface by Application


      • Communication & Control


      • Disabilities And Brain Function Repair


      • User State Monitoring


      • Games & Entertainment


      • Advertisement & Marketing


      • Smart Environments


      • Others


    • France Brain Computer Interface by Industry Verticals


      • Healthcare


      • Manufacturing & Industrial


      • Government


      • Military & Defense


      • Media & Entertainment


      • Education


      • Others


    • UK Outlook (USD Billion, 2018-2032)


    • UK Brain Computer Interface by Type


      • Invasive


      • Non-Invasive


      • Partially Invasive


    • UK Brain Computer Interface by Component


      • Hardware


        • Headsets


        • Boards


        • Sensors


        • Electrodes


      • Software


      • Service


    • UK Brain Computer Interface by Application


      • Communication & Control


      • Disabilities And Brain Function Repair


      • User State Monitoring


      • Games & Entertainment


      • Advertisement & Marketing


      • Smart Environments


      • Others


    • UK Brain Computer Interface by Industry Verticals


      • Healthcare


      • Manufacturing & Industrial


      • Government


      • Military & Defense


      • Media & Entertainment


      • Education


      • Others


    • ITALY Outlook (USD Billion, 2018-2032)


    • ITALY Brain Computer Interface by Type


      • Invasive


      • Non-Invasive


      • Partially Invasive


    • ITALY Brain Computer Interface by Component


      • Hardware


        • Headsets


        • Boards


        • Sensors


        • Electrodes


      • Software


      • Service


    • ITALY Brain Computer Interface by Application


      • Communication & Control


      • Disabilities And Brain Function Repair


      • User State Monitoring


      • Games & Entertainment


      • Advertisement & Marketing


      • Smart Environments


      • Others


    • ITALY Brain Computer Interface by Industry Verticals


      • Healthcare


      • Manufacturing & Industrial


      • Government


      • Military & Defense


      • Media & Entertainment


      • Education


      • Others


    • SPAIN Outlook (USD Billion, 2018-2032)


    • Spain Brain Computer Interface by Type


      • Invasive


      • Non-Invasive


      • Partially Invasive


    • Spain Brain Computer Interface by Component


      • Hardware


        • Headsets


        • Boards


        • Sensors


        • Electrodes


      • Software


      • Service


    • Spain Brain Computer Interface by Application


      • Communication & Control


      • Disabilities And Brain Function Repair


      • User State Monitoring


      • Games & Entertainment


      • Advertisement & Marketing


      • Smart Environments


      • Others


    • Spain Brain Computer Interface by Industry Verticals


      • Healthcare


      • Manufacturing & Industrial


      • Government


      • Military & Defense


      • Media & Entertainment


      • Education


      • Others


    • Rest Of Europe Outlook (USD Billion, 2018-2032)


    • Rest Of Europe Brain Computer Interface by Type


      • Invasive


      • Non-Invasive


      • Partially Invasive


    • Rest Of Europe Brain Computer Interface by Component


      • Hardware


        • Headsets


        • Boards


        • Sensors


        • Electrodes


      • Software


      • Service


    • Rest Of Europe Brain Computer Interface by Application


      • Communication & Control


      • Disabilities And Brain Function Repair


      • User State Monitoring


      • Games & Entertainment


      • Advertisement & Marketing


      • Smart Environments


      • Others


    • REST OF EUROPE Brain Computer Interface by Industry Verticals


      • Healthcare


      • Manufacturing & Industrial


      • Government


      • Military & Defense


      • Media & Entertainment


      • Education


      • Others


  • Asia-Pacific Outlook (USD Billion, 2018-2032)


    • Asia-Pacific Brain Computer Interface by Type


      • Invasive


      • Non-Invasive


      • Partially Invasive


    • Asia-Pacific Brain Computer Interface by Component


      • Hardware


        • Headsets


        • Boards


        • Sensors


        • Electrodes


      • Software


      • Service


    • Asia-Pacific Brain Computer Interface by Application


      • Communication & Control


      • Disabilities And Brain Function Repair


      • User State Monitoring


      • Games & Entertainment


      • Advertisement & Marketing


      • Smart Environments


      • Others


    • Asia-Pacific Brain Computer Interface by Industry Verticals


      • Healthcare


      • Manufacturing & Industrial


      • Government


      • Military & Defense


      • Media & Entertainment


      • Education


      • Others


    • China Outlook (USD Billion, 2018-2032)


    • China Brain Computer Interface by Type


      • Invasive


      • Non-Invasive


      • Partially Invasive


    • China Brain Computer Interface by Component


      • Hardware


        • Headsets


        • Boards


        • Sensors


        • Electrodes


      • Software


      • Service


    • China Brain Computer Interface by Application


      • Communication & Control


      • Disabilities And Brain Function Repair


      • User State Monitoring


      • Games & Entertainment


      • Advertisement & Marketing


      • Smart Environments


      • Others


    • China Brain Computer Interface by Industry Verticals


      • Healthcare


      • Manufacturing & Industrial


      • Government


      • Military & Defense


      • Media & Entertainment


      • Education


      • Others


    • Japan Outlook (USD Billion, 2018-2032)


    • Japan Brain Computer Interface by Type


      • Invasive


      • Non-Invasive


      • Partially Invasive


    • Japan Brain Computer Interface by Component


      • Hardware


        • Headsets


        • Boards


        • Sensors


        • Electrodes


      • Software


      • Service


    • Japan Brain Computer Interface by Application


      • Communication & Control


      • Disabilities And Brain Function Repair


      • User State Monitoring


      • Games & Entertainment


      • Advertisement & Marketing


      • Smart Environments


      • Others


    • Japan Brain Computer Interface by Industry Verticals


      • Healthcare


      • Manufacturing & Industrial


      • Government


      • Military & Defense


      • Media & Entertainment


      • Education


      • Others


    • India Outlook (USD Billion, 2018-2032)


    • India Brain Computer Interface by Type


      • Invasive


      • Non-Invasive


      • Partially Invasive


    • India Brain Computer Interface by Component


      • Hardware


        • Headsets


        • Boards


        • Sensors


        • Electrodes


      • Software


      • Service


    • India Brain Computer Interface by Application


      • Communication & Control


      • Disabilities And Brain Function Repair


      • User State Monitoring


      • Games & Entertainment


      • Advertisement & Marketing


      • Smart Environments


      • Others


    • India Brain Computer Interface by Industry Verticals


      • Healthcare


      • Manufacturing & Industrial


      • Government


      • Military & Defense


      • Media & Entertainment


      • Education


      • Others


    • Australia Outlook (USD Billion, 2018-2032)


    • Australia Brain Computer Interface by Type


      • Invasive


      • Non-Invasive


      • Partially Invasive


    • Australia Brain Computer Interface by Component


      • Hardware


        • Headsets


        • Boards


        • Sensors


        • Electrodes


      • Software


      • Service


    • Australia Brain Computer Interface by Application


      • Communication & Control


      • Disabilities And Brain Function Repair


      • User State Monitoring


      • Games & Entertainment


      • Advertisement & Marketing


      • Smart Environments


      • Others


    • Australia Brain Computer Interface by Industry Verticals


      • Healthcare


      • Manufacturing & Industrial


      • Government


      • Military & Defense


      • Media & Entertainment


      • Education


      • Others


    • Rest of Asia-Pacific Outlook (USD Billion, 2018-2032)


    • Rest of Asia-Pacific Brain Computer Interface by Type


      • Invasive


      • Non-Invasive


      • Partially Invasive


    • Rest of Asia-Pacific Brain Computer Interface by Component


      • Hardware


        • Headsets


        • Boards


        • Sensors


        • Electrodes


      • Software


      • Service


    • Rest of Asia-Pacific Brain Computer Interface by Application


      • Communication & Control


      • Disabilities And Brain Function Repair


      • User State Monitoring


      • Games & Entertainment


      • Advertisement & Marketing


      • Smart Environments


      • Others


    • Rest of Asia-Pacific Brain Computer Interface by Industry Verticals


      • Healthcare


      • Manufacturing & Industrial


      • Government


      • Military & Defense


      • Media & Entertainment


      • Education


      • Others


  • Rest of the World Outlook (USD Billion, 2018-2032)


    • Rest of the World Brain Computer Interface by Type


      • Invasive


      • Non-Invasive


      • Partially Invasive


    • Rest of the World Brain Computer Interface by Component


      • Hardware


        • Headsets


        • Boards


        • Sensors


        • Electrodes


      • Software


      • Service


    • Rest of the World Brain Computer Interface by Application


      • Communication & Control


      • Disabilities And Brain Function Repair


      • User State Monitoring


      • Games & Entertainment


      • Advertisement & Marketing


      • Smart Environments


      • Others


    • Rest of the World Brain Computer Interface by Industry Verticals


      • Healthcare


      • Manufacturing & Industrial


      • Government


      • Military & Defense


      • Media & Entertainment


      • Education


      • Others


    • Middle East Outlook (USD Billion, 2018-2032)


    • Middle East Brain Computer Interface by Type


      • Invasive


      • Non-Invasive


      • Partially Invasive


    • Middle East Brain Computer Interface by Component


      • Hardware


        • Headsets


        • Boards


        • Sensors


        • Electrodes


      • Software


      • Service


    • Middle East Brain Computer Interface by Application


      • Communication & Control


      • Disabilities And Brain Function Repair


      • User State Monitoring


      • Games & Entertainment


      • Advertisement & Marketing


      • Smart Environments


      • Others


    • Middle East Brain Computer Interface by Industry Verticals


      • Healthcare


      • Manufacturing & Industrial


      • Government


      • Military & Defense


      • Media & Entertainment


      • Education


      • Others


    • Africa Outlook (USD Billion, 2018-2032)


    • Africa Brain Computer Interface by Type


      • Invasive


      • Non-Invasive


      • Partially Invasive


    • Africa Brain Computer Interface by Component


      • Hardware


        • Headsets


        • Boards


        • Sensors


        • Electrodes


      • Software


      • Service


    • Africa Brain Computer Interface by Application


      • Communication & Control


      • Disabilities And Brain Function Repair


      • User State Monitoring


      • Games & Entertainment


      • Advertisement & Marketing


      • Smart Environments


      • Others


    • Africa Brain Computer Interface by Industry Verticals


      • Healthcare


      • Manufacturing & Industrial


      • Government


      • Military & Defense


      • Media & Entertainment


      • Education


      • Others


    • Latin America Outlook (USD Billion, 2018-2032)


    • Latin America Brain Computer Interface by Type


      • Invasive


      • Non-Invasive


      • Partially Invasive


    • Latin America Brain Computer Interface by Component


      • Hardware


        • Headsets


        • Boards


        • Sensors


        • Electrodes


      • Software


      • Service


    • Latin America Brain Computer Interface by Application


      • Communication & Control


      • Disabilities And Brain Function Repair


      • User State Monitoring


      • Games & Entertainment


      • Advertisement & Marketing


      • Smart Environments


      • Others


    • Latin America Brain Computer Interface by Industry Verticals


      • Healthcare


      • Manufacturing & Industrial


      • Government


      • Military & Defense


      • Media & Entertainment


      • Education


      • Others


Leading companies partner with us for data-driven Insights
client_1 client_2 client_3 client_4 client_5 client_6 client_7 client_8 client_9 client_10
Please fill in Business Email for Quick Response

TABLE OF CONTENTS

1. EXECUTIVE SUMMARY

1.1. Market Attractiveness Analysis

1.1.1. Global BRAIN-COMPUTER Interfaces Market, by Type

1.1.2. Global BRAIN-COMPUTER Interfaces Market, by Component

1.1.3. Global BRAIN-COMPUTER Interfaces Market, by Application

1.1.4. Global BRAIN-COMPUTER Interfaces Market, by Industry Vertical

1.1.5. Global BRAIN-COMPUTER Interfaces Market, by Region

2. MARKET INTRODUCTION

2.1. Definition

2.2. Scope of the Study

2.3. Market Structure

2.4. Key Buying Criteria

2.5. Macro Factor Indicator Analysis

3. RESEARCH METHODOLOGY

3.1. Research Process

3.2. Primary Research

3.3. Secondary Research

3.4. Market Size Estimation

3.5. Forecast Model

3.6. List of Assumptions

4. MARKET DYNAMICS

4.1. Introduction

4.2. Drivers

4.2.1. Rising Incidence of brain disorders affecting the movement of body

4.2.2. Miniaturization of components is propelling the growth of BCI technology

4.2.3. Drivers Impact Analysis

4.3. Restraints

4.3.1. Privacy and Other Risks Associated With BCI

4.3.2. Lack of expertise in implementing the BCI systems

4.3.3. Restraints Impact Analysis

4.4. Opportunities

4.4.1. Advancements in Human-Computer Interaction (HCI)

4.4.2. Brain-computer Interfaces (BCIs) based on electroencephalography (EEG) in video games

4.5. Challenges

4.5.1. Psychophysiological and Neurological Challenges

4.5.2. Technological Challenges

4.6. Impact of COVID-19

4.6.1. Impact on Brain-computer Interfaces provider

4.6.2. Impact on the end user

5. MARKET FACTOR ANALYSIS

5.1. Value Chain Analysis/Supply Chain Analysis

5.2. Porter’s Five Forces Model

5.3. Bargaining Power of Suppliers

5.4. Bargaining Power of Buyers

5.5. Threat of New Entrants

5.6. Threat of Substitutes

5.7. Intensity of Rivalry

6. GLOBAL BRAIN-COMPUTER INTERFACES MARKET, BY TYPE

6.1. Introduction

6.2. Invasive

6.3. Non-Invasive

6.4. Partially Invasive

7. GLOBAL BRAIN-COMPUTER INTERFACES MARKET, BY COMPONENT

7.1. Introduction

7.2. Hardware

7.2.1. Headsets

7.2.2. Boards

7.2.3. Sensors

7.2.4. Electrodes

7.3. Software

7.4. Service

8. GLOBAL BRAIN-COMPUTER INTERFACES MARKET, BY APPLICATION

8.1. Introduction

8.2. Communication & Control

8.3. Disabilities and Brain Function Repair

8.4. User State Monitoring

8.5. Games & Entertainment

8.6. Advertisement & Marketing

8.7. Smart Environments

8.8. Others

9. GLOBAL BRAIN-COMPUTER INTERFACES MARKET, BY INDUSTRY VERTICAL

9.1. Introduction

9.2. Healthcare

9.3. Manufacturing & Industrial

9.4. Government

9.5. Military & Defense

9.6. Media & Entertainment

9.7. Education

9.8. Others

10. GLOBAL BRAIN-COMPUTER INTERFACES MARKET SIZE ESTIMATION & FORECAST, BY REGION

10.1. Introduction

10.2. North America

10.2.1. Market Estimates & Forecast, by Country, 2018-2030

10.2.2. Market Estimates & Forecast, by Type, 2018-2030

10.2.3. Market Estimates & Forecast, by Component, 2018-2030

10.2.4. Market Estimates & Forecast, by Application, 2018-2030

10.2.5. Market Estimates & Forecast, by Industry Vertical, 2018-2030

10.2.6. US

10.2.6.1. Market Estimates & Forecast, by Type, 2018-2030

10.2.6.2. Market Estimates & Forecast, by Component, 2018-2030

10.2.6.3. Market Estimates & Forecast, by Application, 2018-2030

10.2.6.4. Market Estimates & Forecast, by Industry Vertical, 2018-2030

10.2.7. Canada

10.2.7.1. Market Estimates & Forecast, by Type, 2018-2030

10.2.7.2. Market Estimates & Forecast, by Component, 2018-2030

10.2.7.3. Market Estimates & Forecast, by Application, 2018-2030

10.2.7.4. Market Estimates & Forecast, by Industry Vertical, 2018-2030

10.2.8. Mexico

10.2.8.1. Market Estimates & Forecast, by Type, 2018-2030

10.2.8.2. Market Estimates & Forecast, by Component, 2018-2030

10.2.8.3. Market Estimates & Forecast, by Application, 2018-2030

10.2.8.4. Market Estimates & Forecast, by Industry Vertical, 2018-2030

10.3. Europe

10.3.1. Market Estimates & Forecast, by Country, 2018-2030

10.3.2. Market Estimates & Forecast, by Type, 2018-2030

10.3.3. Market Estimates & Forecast, by Component, 2018-2030

10.3.4. Market Estimates & Forecast, by Application, 2018-2030

10.3.5. Market Estimates & Forecast, by Industry Vertical, 2018-2030

10.3.6. UK

10.3.6.1. Market Estimates & Forecast, by Type, 2018-2030

10.3.6.2. Market Estimates & Forecast, by Component, 2018-2030

10.3.6.3. Market Estimates & Forecast, by Application, 2018-2030

10.3.6.4. Market Estimates & Forecast, by Industry Vertical, 2018-2030

10.3.7. Germany

10.3.7.1. Market Estimates & Forecast, by Type, 2018-2030

10.3.7.2. Market Estimates & Forecast, by Component, 2018-2030

10.3.7.3. Market Estimates & Forecast, by Application, 2018-2030

10.3.7.4. Market Estimates & Forecast, by Industry Vertical, 2018-2030

10.3.8. France

10.3.8.1. Market Estimates & Forecast, by Type, 2018-2030

10.3.8.2. Market Estimates & Forecast, by Component, 2018-2030

10.3.8.3. Market Estimates & Forecast, by Application, 2018-2030

10.3.8.4. Market Estimates & Forecast, by Industry Vertical, 2018-2030

10.3.9. Rest of Europe

10.3.9.1. Market Estimates & Forecast, by Type, 2018-2030

10.3.9.2. Market Estimates & Forecast, by Component, 2018-2030

10.3.9.3. Market Estimates & Forecast, by Application, 2018-2030

10.3.9.4. Market Estimates & Forecast, by Industry Vertical, 2018-2030

10.4. Asia-Pacific

10.4.1. Market Estimates & Forecast, by Country, 2018-2030

10.4.2. Market Estimates & Forecast, by Type, 2018-2030

10.4.3. Market Estimates & Forecast, by Component, 2018-2030

10.4.4. Market Estimates & Forecast, by Application, 2018-2030

10.4.5. Market Estimates & Forecast, by Industry Vertical, 2018-2030

10.4.6. China

10.4.6.1. Market Estimates & Forecast, by Type, 2018-2030

10.4.6.2. Market Estimates & Forecast, by Component, 2018-2030

10.4.6.3. Market Estimates & Forecast, by Application, 2018-2030

10.4.6.4. Market Estimates & Forecast, by Industry Vertical, 2018-2030

10.4.7. Japan

10.4.7.1. Market Estimates & Forecast, by Type, 2018-2030

10.4.7.2. Market Estimates & Forecast, by Component, 2018-2030

10.4.7.3. Market Estimates & Forecast, by Application, 2018-2030

10.4.7.4. Market Estimates & Forecast, by Industry Vertical, 2018-2030

10.4.8. India

10.4.8.1. Market Estimates & Forecast, by Type, 2018-2030

10.4.8.2. Market Estimates & Forecast, by Component, 2018-2030

10.4.8.3. Market Estimates & Forecast, by Application, 2018-2030

10.4.8.4. Market Estimates & Forecast, by Industry Vertical, 2018-2030

10.4.9. Rest of Asia-Pacific

10.4.9.1. Market Estimates & Forecast, by Type, 2018-2030

10.4.9.2. Market Estimates & Forecast, by Component, 2018-2030

10.4.9.3. Market Estimates & Forecast, by Application, 2018-2030

10.4.9.4. Market Estimates & Forecast, by Industry Vertical, 2018-2030

10.5. Middle East & Africa

10.5.1. Market Estimates & Forecast, by Type, 2018-2030

10.5.2. Market Estimates & Forecast, by Component, 2018-2030

10.5.3. Market Estimates & Forecast, by Application, 2018-2030

10.5.4. Market Estimates & Forecast, by Industry Vertical, 2018-2030

10.6. South America

10.6.1. Market Estimates & Forecast, by Type, 2018-2030

10.6.2. Market Estimates & Forecast, by Component, 2018-2030

10.6.3. Market Estimates & Forecast, by Application, 2018-2030

10.6.4. Market Estimates & Forecast, by Industry Vertical, 2018-2030

11. COMPETITIVE LANDSCAPE

11.1. Introduction

11.2. Key Developments & Growth Strategies

11.3. Competitor Benchmarking

11.4. Vendor Share Analysis, 2021(% Share)

12. COMPANY PROFILES

12.1. OpenBCI

12.2. Advanced Brain Monitoring, Inc.

12.3. Cadwell Industries, Inc.

12.4. Cortech Solutions, Inc.

12.5. Emotiv

12.6. G.tech Medical Engineering Gmbh

12.7. Integra Lifesciences

12.8. Natus Medical Incorporated

12.9. Neurosky

12.10. Nihon Kohden Corporation

12.11. Pantech ProLabs India Pvt Ltd

12.12. Neuralink

12.13. Neurable

12.14. Kernel

12.15. NextMind

12.16. MELTIN MMI

12.17. Bitbrain

12.18. Dreem (formerly Rythm)

12.19. Thync

12.20. Halo Neuroscience

12.21. Synchron

12.22. BrainCo, Inc.

12.23. Neurable

12.24. Cognixion

12.25. Bitbrain Technologies

12.26. Paradromics

12.26.1. Company Overview

12.26.2. Financial Overview

12.26.3. Solution/Services Offered

12.26.4. Key Developments

12.26.5. SWOT Analysis

12.26.6. Key Strategies

LIST OF TABLES

TABLE 1 MARKET SYNOPSIS 19

TABLE 2 GLOBAL BRAIN-COMPUTER INTERFACES MARKET, BY TYPE, 2018–2030 (USD MILLION) 49

TABLE 3 GLOBAL BRAIN-COMPUTER INTERFACES MARKET, BY COMPONENT, 2018–2030 (USD MILLION) 52

TABLE 4 GLOBAL BRAIN-COMPUTER INTERFACES MARKET, BY APPLICATION, 2018–2030 (USD MILLION) 55

TABLE 5 GLOBAL BRAIN-COMPUTER INTERFACES MARKET, BY INDUSTRY VERTICAL, 2018–2030 (USD MILLION) 57

TABLE 6 GLOBAL BRAIN-COMPUTER INTERFACES MARKET, BY REGION, 2018–2030 (USD MILLION) 61

TABLE 7 NORTH AMERICA BRAIN-COMPUTER INTERFACES MARKET, BY COUNTRY, 2018–2030 (USD MILLION) 63

TABLE 8 NORTH AMERICA BRAIN-COMPUTER INTERFACES MARKET, BY TYPE, 2018–2030 (USD MILLION) 63

TABLE 9 NORTH AMERICA BRAIN-COMPUTER INTERFACES MARKET, BY COMPONENT, 2018–2030 (USD MILLION) 64

TABLE 10 NORTH AMERICA BRAIN-COMPUTER INTERFACES MARKET, BY APPLICATION, 2018–2030 (USD MILLION) 65

TABLE 11 NORTH AMERICA BRAIN-COMPUTER INTERFACES MARKET, BY INDUSTRY VERTICAL, 2018–2030 (USD MILLION) 66

TABLE 12 US BRAIN-COMPUTER INTERFACES MARKET, BY TYPE, 2018–2030 (USD MILLION) 67

TABLE 13 US BRAIN-COMPUTER INTERFACES MARKET, BY COMPONENT, 2018–2030 (USD MILLION) 68

TABLE 14 US BRAIN-COMPUTER INTERFACES MARKET, BY APPLICATION, 2018–2030 (USD MILLION) 68

TABLE 15 US BRAIN-COMPUTER INTERFACES MARKET, BY INDUSTRY VERTICAL, 2018–2030 (USD MILLION) 68

TABLE 16 CANADA BRAIN-COMPUTER INTERFACES MARKET, BY TYPE, 2018–2030 (USD MILLION) 70

TABLE 17 CANADA BRAIN-COMPUTER INTERFACES MARKET, BY COMPONENT, 2018–2030 (USD MILLION) 70

TABLE 18 CANADA BRAIN-COMPUTER INTERFACES MARKET, BY APPLICATION, 2018–2030 (USD MILLION) 71

TABLE 19 CANADA BRAIN-COMPUTER INTERFACES MARKET, BY INDUSTRY VERTICAL, 2018–2030 (USD MILLION) 71

TABLE 20 MEXICO BRAIN-COMPUTER INTERFACES MARKET, BY TYPE, 2018–2030 (USD MILLION) 73

TABLE 21 MEXICO BRAIN-COMPUTER INTERFACES MARKET, BY COMPONENT, 2018–2030 (USD MILLION) 73

TABLE 22 MEXICO BRAIN-COMPUTER INTERFACES MARKET, BY APPLICATION, 2018–2030 (USD MILLION) 74

TABLE 23 MEXICO BRAIN-COMPUTER INTERFACES MARKET, BY INDUSTRY VERTICAL, 2018–2030 (USD MILLION) 74

TABLE 24 EUROPE BRAIN-COMPUTER INTERFACES MARKET, BY COUNTRY, 2018–2030 (USD MILLION) 77

TABLE 25 EUROPE BRAIN-COMPUTER INTERFACES MARKET, BY TYPE, 2018–2030 (USD MILLION) 78

TABLE 26 EUROPE BRAIN-COMPUTER INTERFACES MARKET, BY COMPONENT, 2018–2030 (USD MILLION) 78

TABLE 27 EUROPE BRAIN-COMPUTER INTERFACES MARKET, BY APPLICATION, 2018–2030 (USD MILLION) 79

TABLE 28 EUROPE BRAIN-COMPUTER INTERFACES MARKET, BY INDUSTRY VERTICAL, 2018–2030 (USD MILLION) 80

TABLE 29 UK BRAIN-COMPUTER INTERFACES MARKET, BY TYPE, 2018–2030 (USD MILLION) 81

TABLE 30 UK BRAIN-COMPUTER INTERFACES MARKET, BY COMPONENT, 2018–2030 (USD MILLION) 81

TABLE 31 UK BRAIN-COMPUTER INTERFACES MARKET, BY APPLICATION, 2018–2030 (USD MILLION) 82

TABLE 32 UK BRAIN-COMPUTER INTERFACES MARKET, BY INDUSTRY VERTICAL, 2018–2030 (USD MILLION) 82

TABLE 33 GERMANY BRAIN-COMPUTER INTERFACES MARKET, BY TYPE, 2018–2030 (USD MILLION) 84

TABLE 34 GERMANY BRAIN-COMPUTER INTERFACES MARKET, BY COMPONENT, 2018–2030 (USD MILLION) 85

TABLE 35 GERMANY BRAIN-COMPUTER INTERFACES MARKET, BY APPLICATION, 2018–2030 (USD MILLION) 85

TABLE 36 GERMANY BRAIN-COMPUTER INTERFACES MARKET, BY INDUSTRY VERTICAL, 2018–2030 (USD MILLION) 85

TABLE 37 FRANCE BRAIN-COMPUTER INTERFACES MARKET, BY TYPE, 2018–2030 (USD MILLION) 87

TABLE 38 FRANCE BRAIN-COMPUTER INTERFACES MARKET, BY COMPONENT, 2018–2030 (USD MILLION) 87

TABLE 39 FRANCE BRAIN-COMPUTER INTERFACES MARKET, BY APPLICATION, 2018–2030 (USD MILLION) 88

TABLE 40 FRANCE BRAIN-COMPUTER INTERFACES MARKET, BY INDUSTRY VERTICAL, 2018–2030 (USD MILLION) 88

TABLE 41 SPAIN BRAIN-COMPUTER INTERFACES MARKET, BY TYPE, 2018–2030 (USD MILLION) 90

TABLE 42 SPAIN BRAIN-COMPUTER INTERFACES MARKET, BY COMPONENT, 2018–2030 (USD MILLION) 90

TABLE 43 SPAIN BRAIN-COMPUTER INTERFACES MARKET, BY APPLICATION, 2018–2030 (USD MILLION) 90

TABLE 44 SPAIN BRAIN-COMPUTER INTERFACES MARKET, BY INDUSTRY VERTICAL, 2018–2030 (USD MILLION) 91

TABLE 45 ITALY BRAIN-COMPUTER INTERFACES MARKET, BY TYPE, 2018–2030 (USD MILLION) 92

TABLE 46 ITALY BRAIN-COMPUTER INTERFACES MARKET, BY COMPONENT, 2018–2030 (USD MILLION) 92

TABLE 47 ITALY BRAIN-COMPUTER INTERFACES MARKET, BY APPLICATION, 2018–2030 (USD MILLION) 93

TABLE 48 ITALY BRAIN-COMPUTER INTERFACES MARKET, BY INDUSTRY VERTICAL, 2018–2030 (USD MILLION) 93

TABLE 49 REST OF EUROPE BRAIN-COMPUTER INTERFACES MARKET, BY TYPE, 2018–2030 (USD MILLION) 95

TABLE 50 REST OF EUROPE BRAIN-COMPUTER INTERFACES MARKET, BY COMPONENT, 2018–2030 (USD MILLION) 95

TABLE 51 REST OF EUROPE BRAIN-COMPUTER INTERFACES MARKET, BY APPLICATION, 2018–2030 (USD MILLION) 96

TABLE 52 REST OF EUROPE BRAIN-COMPUTER INTERFACES MARKET, BY INDUSTRY VERTICAL, 2018–2030 (USD MILLION) 96

TABLE 53 ASIA-PACIFIC BRAIN-COMPUTER INTERFACES MARKET, BY COUNTRY, 2018–2030 (USD MILLION) 99

TABLE 54 ASIA-PACIFIC BRAIN-COMPUTER INTERFACES MARKET, BY TYPE, 2018–2030 (USD MILLION) 99

TABLE 55 ASIA-PACIFIC BRAIN-COMPUTER INTERFACES MARKET, BY COMPONENT, 2018–2030 (USD MILLION) 100

TABLE 56 ASIA-PACIFIC BRAIN-COMPUTER INTERFACES MARKET, BY APPLICATION, 2018–2030 (USD MILLION) 101

TABLE 57 ASIA-PACIFIC BRAIN-COMPUTER INTERFACES MARKET, BY INDUSTRY VERTICAL, 2018–2030 (USD MILLION) 102

TABLE 58 CHINA BRAIN-COMPUTER INTERFACES MARKET, BY TYPE, 2018–2030 (USD MILLION) 103

TABLE 59 CHINA BRAIN-COMPUTER INTERFACES MARKET, BY COMPONENT, 2018–2030 (USD MILLION) 103

TABLE 60 CHINA BRAIN-COMPUTER INTERFACES MARKET, BY APPLICATION, 2018–2030 (USD MILLION) 104

TABLE 61 CHINA BRAIN-COMPUTER INTERFACES MARKET, BY INDUSTRY VERTICAL, 2018–2030 (USD MILLION) 104

TABLE 62 JAPAN BRAIN-COMPUTER INTERFACES MARKET, BY TYPE, 2018–2030 (USD MILLION) 105

TABLE 63 JAPAN BRAIN-COMPUTER INTERFACES MARKET, BY COMPONENT, 2018–2030 (USD MILLION) 105

TABLE 64 JAPAN BRAIN-COMPUTER INTERFACES MARKET, BY APPLICATION, 2018–2030 (USD MILLION) 106

TABLE 65 JAPAN BRAIN-COMPUTER INTERFACES MARKET, BY INDUSTRY VERTICAL, 2018–2030 (USD MILLION) 106

TABLE 66 INDIA BRAIN-COMPUTER INTERFACES MARKET, BY TYPE, 2018–2030 (USD MILLION) 108

TABLE 67 INDIA BRAIN-COMPUTER INTERFACES MARKET, BY COMPONENT, 2018–2030 (USD MILLION) 108

TABLE 68 INDIA BRAIN-COMPUTER INTERFACES MARKET, BY APPLICATION, 2018–2030 (USD MILLION) 109

TABLE 69 INDIA BRAIN-COMPUTER INTERFACES MARKET, BY INDUSTRY VERTICAL, 2018–2030 (USD MILLION) 109

TABLE 70 SOUTH KOREA BRAIN-COMPUTER INTERFACES MARKET, BY TYPE, 2018–2030 (USD MILLION) 110

TABLE 71 SOUTH KOREA BRAIN-COMPUTER INTERFACES MARKET, BY COMPONENT, 2018–2030 (USD MILLION) 111

TABLE 72 SOUTH KOREA BRAIN-COMPUTER INTERFACES MARKET, BY APPLICATION, 2018–2030 (USD MILLION) 111

TABLE 73 SOUTH KOREA BRAIN-COMPUTER INTERFACES MARKET, BY INDUSTRY VERTICAL, 2018–2030 (USD MILLION) 112

TABLE 74 REST OF ASIA-PACIFIC BRAIN-COMPUTER INTERFACES MARKET, BY TYPE, 2018–2030 (USD MILLION) 113

TABLE 75 REST OF ASIA-PACIFIC BRAIN-COMPUTER INTERFACES MARKET, BY COMPONENT, 2018–2030 (USD MILLION) 113

TABLE 76 REST OF ASIA-PACIFIC BRAIN-COMPUTER INTERFACES MARKET, BY APPLICATION, 2018–2030 (USD MILLION) 114

TABLE 77 REST OF ASIA-PACIFIC BRAIN-COMPUTER INTERFACES MARKET, BY INDUSTRY VERTICAL, 2018–2030 (USD MILLION) 115

TABLE 78 SOUTH AMERICA BRAIN-COMPUTER INTERFACES MARKET, BY TYPE, 2018–2030 (USD MILLION) 117

TABLE 79 SOUTH AMERICA BRAIN-COMPUTER INTERFACES MARKET, BY COMPONENT, 2018–2030 (USD MILLION) 117

TABLE 80 SOUTH AMERICA BRAIN-COMPUTER INTERFACES MARKET, BY APPLICATION, 2018–2030 (USD MILLION) 119

TABLE 81 SOUTH AMERICA BRAIN-COMPUTER INTERFACES MARKET, BY INDUSTRY VERTICAL, 2018–2030 (USD MILLION) 120

TABLE 82 MIDDLE EAST & AFRICA BRAIN-COMPUTER INTERFACES MARKET, BY TYPE, 2018–2030 (USD MILLION) 121

TABLE 83 MIDDLE EAST & AFRICA BRAIN-COMPUTER INTERFACES MARKET, BY COMPONENT, 2018–2030 (USD MILLION) 122

TABLE 84 MIDDLE EAST & AFRICA BRAIN-COMPUTER INTERFACES MARKET, BY APPLICATION, 2018–2030 (USD MILLION) 123

TABLE 85 MIDDLE EAST & AFRICA BRAIN-COMPUTER INTERFACES MARKET, BY INDUSTRY VERTICAL, 2018–2030 (USD MILLION) 124

TABLE 86 BUSINESS EXPANSIONS/PRODUCT LAUNCHES 128

TABLE 87 PARTNERSHIPS/AGREEMENTS/CONTRACTS/COLLABORATIONS 130

TABLE 88 ACQUISITIONS/MERGERS 135

TABLE 89 OPENBCI PRODUCTS OFFERED 138

TABLE 90 OPENBCI KEY DEVELOPMENTS 139

TABLE 91 ADVANCED BRAIN MONITORING, INC.: PRODUCTS OFFERED 142

TABLE 92 ADVANCED BRAIN MONITORING, INC.: KEY DEVELOPMENTS 143

TABLE 93 CADWELL INDUSTRIES, INC.: PRODUCTS OFFERED 146

TABLE 94 CADWELL INDUSTRIES, INC.: KEY DEVELOPMENTS 147

TABLE 95 CORTECH SOLUTIONS, INC.: PRODUCTS OFFERED 150

TABLE 96 CORTECH SOLUTIONS, INC.: KEY DEVELOPMENTS 151

TABLE 97 EMOTIV: PRODUCTS/ SOLUTIONS/ SERVICES OFFERED 154

TABLE 98 EMOTIV: KEY DEVELOPMENTS 154

TABLE 99 G.TECH MEDICAL ENGINEERING GMBH: PRODUCTS OFFERED 158

TABLE 100 G.TECH MEDICAL ENGINEERING GMBH: KEY DEVELOPMENTS 158

TABLE 101 INTEGRA LIFESCIENCES: PRODUCTS OFFERED 161

TABLE 102 INTEGRA LIFESCIENCES: KEY DEVELOPMENTS 161

TABLE 103 NATUS MEDICAL INCORPORATED PRODUCTS OFFERED 165

TABLE 104 NATUS MEDICAL INCORPORATED KEY DEVELOPMENTS 166

TABLE 105 NEUROSKY PRODUCTS OFFERED 169

TABLE 106 NEUROSKY KEY DEVELOPMENTS 170

TABLE 107 NIHON KOHDEN CORPORATION PRODUCTS OFFERED 173

TABLE 108 NIHON KOHDEN CORPORATION KEY DEVELOPMENTS 174

TABLE 109 PANTECH PROLABS INDIA PVT LTD PRODUCTS OFFERED 177

TABLE 110 PANTECH PROLABS INDIA PVT LTD KEY DEVELOPMENTS 178

TABLE 111 NEURALINK PRODUCTS OFFERED 169

TABLE 112 NEURALINK KEY DEVELOPMENTS 170

TABLE 113 NEURABLE PRODUCTS OFFERED 173

TABLE 114 NEURABLE KEY DEVELOPMENTS 174

TABLE 115 KERNEL PRODUCTS OFFERED 177

TABLE 116 KERNEL KEY DEVELOPMENTS 174

TABLE 117 NEXTMIND PRODUCTS OFFERED 177

TABLE 118 NEXTMIND KEY DEVELOPMENTS 178

TABLE 119 MELTIN MMI PRODUCTS OFFERED 169

TABLE 120 MELTIN MMI KEY DEVELOPMENTS 170

TABLE 121 BITBRAIN PRODUCTS OFFERED 173

TABLE 122 BITBRAIN KEY DEVELOPMENTS 174

TABLE 123 DREEM (FORMERLY RYTHM) PRODUCTS OFFERED 169

TABLE 124 DREEM (FORMERLY RYTHM) KEY DEVELOPMENTS 170

TABLE 125 THYNC PRODUCTS OFFERED 173

TABLE 126 THYNC KEY DEVELOPMENTS 174

TABLE 127 HALO NEUROSCIENCE PRODUCTS OFFERED 177

TABLE 128 HALO NEUROSCIENCE KEY DEVELOPMENTS 174

TABLE 129 SYNCHRON PRODUCTS OFFERED 177

TABLE 130 SYNCHRON KEY DEVELOPMENTS 178

TABLE 131 BRAINCO, INC. PRODUCTS OFFERED 169

TABLE 132 BRAINCO, INC. KEY DEVELOPMENTS 170

TABLE 133 NEURABLE PRODUCTS OFFERED 177

TABLE 134 NEURABLE KEY DEVELOPMENTS 174

TABLE 135 COGNIXION PRODUCTS OFFERED 177

TABLE 136 COGNIXION KEY DEVELOPMENTS 178

TABLE 137 BITBRAIN TECHNOLOGIES PRODUCTS OFFERED 169

TABLE 138 BITBRAIN TECHNOLOGIES KEY DEVELOPMENTS 170

TABLE 139 PARADROMICS PRODUCTS OFFERED 169

TABLE 140 PARADROMICS KEY DEVELOPMENTS 169

LIST OF FIGURES

FIGURE 1 MARKET ATTRACTIVENESS ANALYSIS: GLOBAL BRAIN-COMPUTER INTERFACES MARKET 20

FIGURE 2 GLOBAL BRAIN-COMPUTER INTERFACES MARKET: MARKET STRUCTURE 22

FIGURE 3 BOTTOM-UP AND TOP-DOWN APPROACHES 27

FIGURE 4 NORTH AMERICA: BRAIN-COMPUTER INTERFACES MARKET SIZE (USD MILLION) & MARKET SHARE (%), BY COUNTRY (2021 VS 2030) 30

FIGURE 5 EUROPE: BRAIN-COMPUTER INTERFACES MARKET SIZE (USD MILLION) & MARKET SHARE (%), BY COUNTRY (2021 VS 2030) 30

FIGURE 6 ASIA–PACIFIC: BRAIN-COMPUTER INTERFACES MARKET SIZE (USD MILLION) & MARKET SHARE (%), BY COUNTRY (2021 VS 2030) 31

FIGURE 7 GLOBAL BRAIN-COMPUTER INTERFACES MARKET SIZE (USD MILLION) & MARKET SHARE (%), BY TYPE (2021 VS 2030) 32

FIGURE 8 GLOBAL BRAIN-COMPUTER INTERFACES MARKET SIZE (USD MILLION) & MARKET SHARE (%), BY COMPONENT (2021 VS 2030) 32

FIGURE 10 GLOBAL BRAIN-COMPUTER INTERFACES MARKET SIZE (USD MILLION) & MARKET SHARE (%), BY APPLICATION (2021 VS 2030) 33

FIGURE 11 GLOBAL BRAIN-COMPUTER INTERFACES MARKET SIZE (USD MILLION) & MARKET SHARE (%), BY INDUSTRY VERTICAL (2021 VS 2030) 34

FIGURE 12 MARKET DYNAMIC ANALYSIS OF THE GLOBAL BRAIN-COMPUTER INTERFACES MARKET 35

FIGURE 13 DRIVER IMPACT ANALYSIS 37

FIGURE 14 RESTRAINT IMPACT ANALYSIS 37

FIGURE 15 VALUE CHAIN: GLOBAL BRAIN-COMPUTER INTERFACES MARKET 43

FIGURE 16 PORTER'S FIVE FORCES ANALYSIS OF THE GLOBAL BRAIN-COMPUTER INTERFACES MARKET 45

FIGURE 17 GLOBAL BRAIN-COMPUTER INTERFACES MARKET, BY TYPE, 2021 (% SHARE) 48

FIGURE 18 GLOBAL BRAIN-COMPUTER INTERFACES MARKET, BY TYPE, 2021 VS 2030 (USD MILLION) 48

FIGURE 19 GLOBAL BRAIN-COMPUTER INTERFACES MARKET, BY COMPONENT, 2021 (% SHARE) 51

FIGURE 20 GLOBAL BRAIN-COMPUTER INTERFACES MARKET, BY COMPONENT, 2021 VS 2030 (USD MILLION) 51

FIGURE 21 GLOBAL BRAIN-COMPUTER INTERFACES MARKET, BY APPLICATION, 2021 (% SHARE) 54

FIGURE 22 GLOBAL BRAIN-COMPUTER INTERFACES MARKET, BY APPLICATION, 2021 VS 2030 (USD MILLION) 54

FIGURE 23 GLOBAL BRAIN-COMPUTER INTERFACES MARKET, BY INDUSTRY VERTICAL, 2021 (% SHARE) 56

FIGURE 24 GLOBAL BRAIN-COMPUTER INTERFACES MARKET, BY INDUSTRY VERTICAL, 2021 VS 2030 (USD MILLION) 56

FIGURE 25 GLOBAL BRAIN-COMPUTER INTERFACES MARKET, BY REGION, 2021 (% SHARE) 60

FIGURE 26 GLOBAL BRAIN-COMPUTER INTERFACES MARKET, BY REGION, 2021 VS 2030 (USD MILLION) 60

FIGURE 27 NORTH AMERICA BRAIN-COMPUTER INTERFACES MARKET, BY COUNTRY, 2021 (% SHARE) 62

FIGURE 28 NORTH AMERICA BRAIN-COMPUTER INTERFACES MARKET, BY COUNTRY, 2021 VS 2030 (USD MILLION) 62

FIGURE 29 NORTH AMERICA BRAIN-COMPUTER INTERFACES MARKET, BY TYPE, 2021-2030 (USD MILLION) 63

FIGURE 30 NORTH AMERICA BRAIN-COMPUTER INTERFACES MARKET, BY COMPONENT, 2021-2030 (USD MILLION) 64

FIGURE 31 NORTH AMERICA BRAIN-COMPUTER INTERFACES MARKET, BY APPLICATION, 2021-2030 (USD MILLION) 65

FIGURE 32 NORTH AMERICA BRAIN-COMPUTER INTERFACES MARKET, BY INDUSTRY VERTICAL, 2021-2030 (USD MILLION) 65

FIGURE 33 EUROPE BRAIN-COMPUTER INTERFACES MARKET, BY COUNTRY, 2021 (% SHARE) 76

FIGURE 34 EUROPE BRAIN-COMPUTER INTERFACES MARKET, BY COUNTRY, 2021 VS 2030 (USD MILLION) 76

FIGURE 35 EUROPE BRAIN-COMPUTER INTERFACES MARKET, BY TYPE, 2021-2030 (USD MILLION) 77

FIGURE 36 EUROPE BRAIN-COMPUTER INTERFACES MARKET, BY COMPONENT, 2021-2030 (USD MILLION) 78

FIGURE 37 EUROPE BRAIN-COMPUTER INTERFACES MARKET, BY APPLICATION, 2021-2030 (USD MILLION) 79

FIGURE 38 EUROPE BRAIN-COMPUTER INTERFACES MARKET, BY INDUSTRY VERTICAL, 2021-2030 (USD MILLION) 80

FIGURE 39 ASIA-PACIFIC BRAIN-COMPUTER INTERFACES MARKET, BY COUNTRY, 2021 (% SHARE) 98

FIGURE 40 ASIA-PACIFIC BRAIN-COMPUTER INTERFACES MARKET, BY COUNTRY, 2021 VS 2030 (USD MILLION) 98

FIGURE 41 ASIA-PACIFIC BRAIN-COMPUTER INTERFACES MARKET, BY TYPE, 2021-2030 (USD MILLION) 99

FIGURE 42 ASIA-PACIFIC BRAIN-COMPUTER INTERFACES MARKET, BY COMPONENT, 2021-2030 (USD MILLION) 100

FIGURE 43 ASIA-PACIFIC BRAIN-COMPUTER INTERFACES MARKET, BY APPLICATION, 2021-2030 (USD MILLION) 101

FIGURE 44 ASIA-PACIFIC BRAIN-COMPUTER INTERFACES MARKET, BY INDUSTRY VERTICAL, 2021-2030 (USD MILLION) 101

FIGURE 45 SOUTH AMERICA BRAIN-COMPUTER INTERFACES MARKET, BY TYPE, 2021-2030 (USD MILLION) 116

FIGURE 46 SOUTH AMERICA BRAIN-COMPUTER INTERFACES MARKET, BY COMPONENT, 2021-2030 (USD MILLION) 117

FIGURE 47 SOUTH AMERICA BRAIN-COMPUTER INTERFACES MARKET, BY APPLICATION, 2021-2030 (USD MILLION) 118

FIGURE 48 SOUTH AMERICA BRAIN-COMPUTER INTERFACES MARKET, BY INDUSTRY VERTICAL, 2021-2030 (USD MILLION) 119

FIGURE 49 MIDDLE EAST & AFRICA BRAIN-COMPUTER INTERFACES MARKET, BY TYPE, 2021-2030 (USD MILLION) 121

FIGURE 50 MIDDLE EAST & AFRICA BRAIN-COMPUTER INTERFACES MARKET, BY COMPONENT, 2021-2030 (USD MILLION) 122

FIGURE 51 MIDDLE EAST & AFRICA BRAIN-COMPUTER INTERFACES MARKET, BY APPLICATION, 2021-2030 (USD MILLION) 123

FIGURE 52 MIDDLE EAST & AFRICA BRAIN-COMPUTER INTERFACES MARKET, BY INDUSTRY VERTICAL, 2021-2030 (USD MILLION) 123

FIGURE 53 GLOBAL BRAIN-COMPUTER INTERFACES MARKET: COMPETITIVE BENCHMARKING 127

FIGURE 54 VENDOR SHARE ANALYSIS (2021) (%) 128

FIGURE 55 OPENBCI FINANCIAL OVERVIEW SNAPSHOT 138

FIGURE 56 OPENBCI: SWOT ANALYSIS 140

FIGURE 57 ADVANCED BRAIN MONITORING, INC. FINANCIAL OVERVIEW SNAPSHOT 142

FIGURE 58 ADVANCED BRAIN MONITORING, INC.: SWOT ANALYSIS 144

FIGURE 59 CADWELL INDUSTRIES, INC.: FINANCIAL OVERVIEW SNAPSHOT 146

FIGURE 60 CADWELL INDUSTRIES, INC.: SWOT ANALYSIS 148

FIGURE 61 CORTECH SOLUTIONS, INC.: FINANCIAL OVERVIEW SNAPSHOT 150

FIGURE 62 CORTECH SOLUTIONS, INC.: SWOT ANALYSIS 152

FIGURE 63 EMOTIV: FINANCIAL OVERVIEW SNAPSHOT 153

FIGURE 64 EMOTIV: SWOT ANALYSIS 155

FIGURE 65 G.TECH MEDICAL ENGINEERING GMBH: FINANCIAL OVERVIEW SNAPSHOT 157

FIGURE 66 G.TECH MEDICAL ENGINEERING GMBH: SWOT ANALYSIS 159

FIGURE 67 INTEGRA LIFESCIENCES: FINANCIAL OVERVIEW SNAPSHOT 160

FIGURE 68 INTEGRA LIFESCIENCES: SWOT ANALYSIS 162

FIGURE 69 NATUS MEDICAL INCORPORATED FINANCIAL OVERVIEW SNAPSHOT 165

FIGURE 70 NATUS MEDICAL INCORPORATED: SWOT ANALYSIS 166

FIGURE 71 NEUROSKY FINANCIAL OVERVIEW SNAPSHOT 169

FIGURE 72 NEUROSKY: SWOT ANALYSIS 171

FIGURE 73 PANTECH PROLABS INDIA PVT LTD FINANCIAL OVERVIEW SNAPSHOT 173

FIGURE 74 PANTECH PROLABS INDIA PVT LTD: SWOT ANALYSIS 175

FIGURE 75 NEURALINK FINANCIAL OVERVIEW SNAPSHOT 177

FIGURE 76 NEURABLE: SWOT ANALYSIS 179

FIGURE 77 KERNEL FINANCIAL OVERVIEW SNAPSHOT 169

FIGURE 78 KERNEL: SWOT ANALYSIS 171

FIGURE 79 NEXTMIND FINANCIAL OVERVIEW SNAPSHOT 173

FIGURE 80 NEXTMIND: SWOT ANALYSIS 175

FIGURE 81 MELTIN MMI FINANCIAL OVERVIEW SNAPSHOT 177

FIGURE 82 MELTIN MMI: SWOT ANALYSIS 179

FIGURE 83 BITBRAIN FINANCIAL OVERVIEW SNAPSHOT 138

FIGURE 84 BITBRAIN: SWOT ANALYSIS 140

FIGURE 85 DREEM (FORMERLY RYTHM) FINANCIAL OVERVIEW SNAPSHOT 142

FIGURE 86 DREEM (FORMERLY RYTHM): SWOT ANALYSIS 144

FIGURE 87 THYNC: FINANCIAL OVERVIEW SNAPSHOT 146

FIGURE 88 THYNC: SWOT ANALYSIS 148

FIGURE 89 HALO NEUROSCIENCE: FINANCIAL OVERVIEW SNAPSHOT 150

FIGURE 90 HALO NEUROSCIENCE: SWOT ANALYSIS 152

FIGURE 91 SYNCHRON: FINANCIAL OVERVIEW SNAPSHOT 153

FIGURE 92 SYNCHRON: SWOT ANALYSIS 155

FIGURE 93 BRAINCO, INC.: FINANCIAL OVERVIEW SNAPSHOT 157

FIGURE 94 BRAINCO, INC.: SWOT ANALYSIS 159

FIGURE 95 NEURABLE: FINANCIAL OVERVIEW SNAPSHOT 160

FIGURE 96 NEURABLE: SWOT ANALYSIS 162

FIGURE 97 COGNIXION FINANCIAL OVERVIEW SNAPSHOT 165

FIGURE 98 COGNIXION: SWOT ANALYSIS 166

FIGURE 99 BITBRAIN TECHNOLOGIES FINANCIAL OVERVIEW SNAPSHOT 169

FIGURE 100 BITBRAIN TECHNOLOGIES: SWOT ANALYSIS 171

FIGURE 101 PARADROMICS FINANCIAL OVERVIEW SNAPSHOT 173

FIGURE 102 PARADROMICS: SWOT ANALYSIS 175

NOTE:

This table of content is tentative and subject to change as the research progresses.

 In section 14, only the top 10 companies will be profiled. Each company will be profiled based on the Market Overview, Financials, Service Portfolio, Business Strategies, and Recent Developments parameters.

 The companies are selected based on two broad criteria¬– strength of product portfolio and excellence in business strategies.

 Key parameters considered for evaluating strength of the vendor’s product portfolio are industry experience, product capabilities/features, innovations/R&D investment, flexibility to customize the product, ability to integrate with other systems, pre- and post-sale services, and customer ratings/feedback.

Key parameters considered for evaluating a vendor’s excellence in business strategy are its market share, global presence, customer base, partner ecosystem (technology alliances/resellers/distributors), acquisitions, and marketing strategies/investments.

The financial details of the company cannot be provided if the information is not available in the public domain and or from reliable sources.

Purchase Option
Single User $ 4,950
Multiuser License $ 5,950
Enterprise User $ 7,250
Compare Licenses
Tailored for You
  • Dedicated Research on any specifics segment or region.
  • Focused Research on specific players in the market.
  • Custom Report based only on your requirements.
  • Flexibility to add or subtract any chapter in the study.
  • Historic data from 2014 and forecasts outlook till 2040.
  • Flexibility of providing data/insights in formats (PDF, PPT, Excel).
  • Provide cross segmentation in applicable scenario/markets.