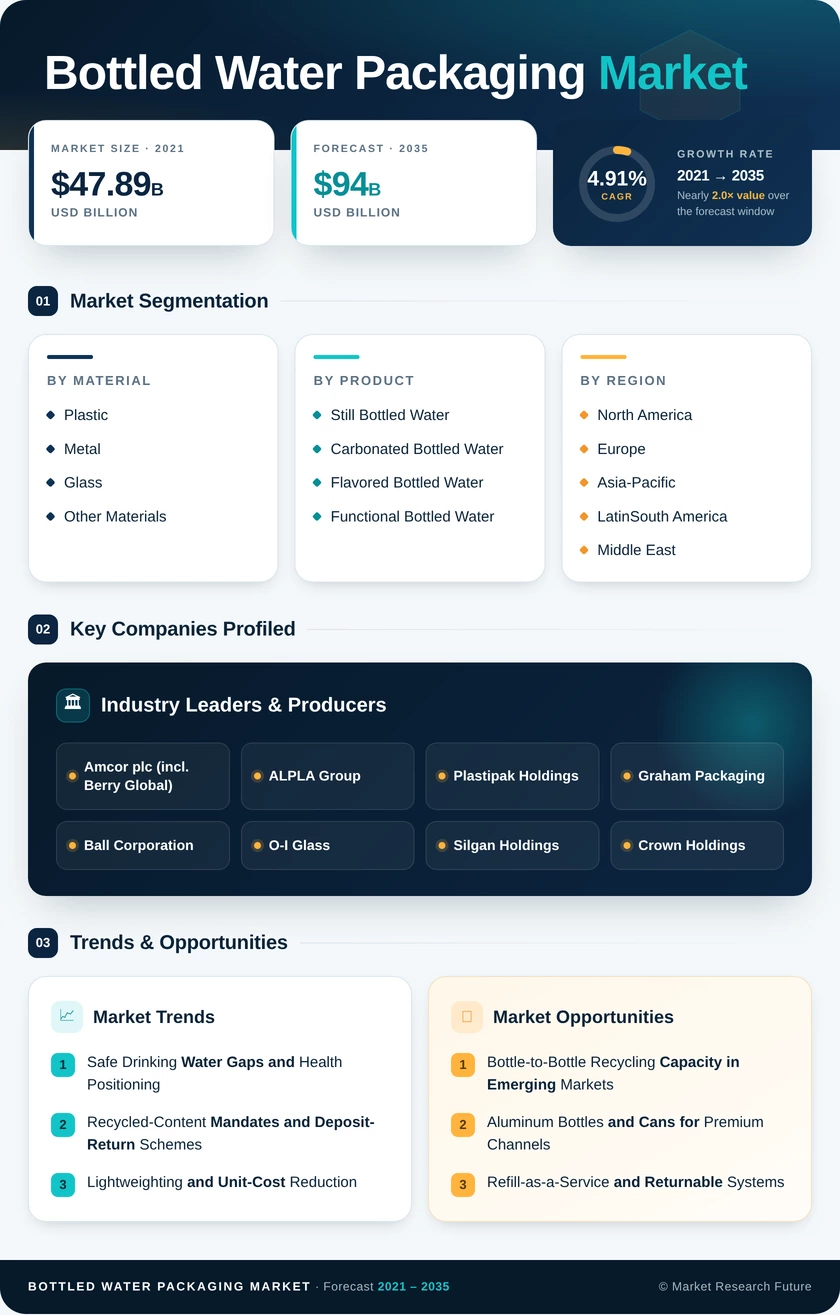
Bottled Water Packaging Market (2026 - 2035)

ID: MRFR/PCM/3749-HCR 185 Pages Pradeep Nandi Last Updated: October 26, 2026
Bottled Water Packaging Market Research Report Information By Material (Plastic, Metal, Glass, and Other Materials), By Product (Still Bottled Water, Carbonated Bottled Water, Flavored Bottled Water, and Functional Bottled Water), And By Region (North America, Europe, Asia-Pacific, and Rest of the World) – Market Forecast Till 2035.
Bottled Water Packaging Market
Market Size
Forecast Period2026-2035
CAGR (2026-2035)4.91%
2025 Market SizeUSD 58.20 Billion
2035 Market SizeUSD 94.00 Billion
Key Players
Amcor plc
ALPLA Group
Plastipak Holdings
Graham Packaging
Ball Corporation
O-I Glass
Opportunities
  • Bottle-to-Bottle Recycling Capacity in Emerging Markets
  • Aluminum Bottles and Cans for Premium Channels
  • Refill-as-a-Service and Returnable Systems
  1. 1 Market Summary | |
  2. 2 Key Report Takeaways | |
    1. 2.1 By Material | |
    2. 2.2 By Product | |
    3. 2.3 By Region | |
  3. 3 Market Size and Forecast (2021–2035) | |
  4. 4 Driver Impact Analysis | |
    1. 4.1 Safe Drinking Water Gaps and Health Positioning | |
    2. 4.2 Recycled-Content Mandates and Deposit-Return Schemes | |
    3. 4.3 Lightweighting and Unit-Cost Reduction | |
    4. 4.4 Premiumization of Functional and Mineral Waters | |
    5. 4.5 Urbanization and Modern Retail Expansion | |
    6. 4.6 Adoption of Aluminum and Premium Glass Formats | |
  5. 5 Restraints Impact Analysis | |
    1. 5.1 Single-Use Plastic Restrictions and EPR Fees | |
    2. 5.2 Resin and Energy Price Volatility | |
    3. 5.3 Food-Grade Recycled Resin Supply Shortfall | |
    4. 5.4 Tap-Water Access Policies and Reusable Bottles | |
    5. 5.5 Micro- and Nanoplastic Health Scrutiny | |
  6. 6 Opportunities | |
    1. 6.1 Bottle-to-Bottle Recycling Capacity in Emerging Markets | |
    2. 6.2 Aluminum Bottles and Cans for Premium Channels | |
    3. 6.3 Refill-as-a-Service and Returnable Systems | |
    4. 6.4 Digital Product Passports and Connected Packaging Data | |
    5. 6.5 Large-Format Containers for Home and Office Delivery | |
  7. 7 Regional Market Share and Country-Level Analysis | |
    1. 7.1 North America | | |
      1. 7.1.1 United States | | |
      2. 7.1.2 Canada | | |
      3. 7.1.3 Mexico | |
    2. 7.2 Europe | | |
      1. 7.2.1 Germany | | |
      2. 7.2.2 UK | | |
      3. 7.2.3 France | | |
      4. 7.2.4 Italy | | |
      5. 7.2.5 Spain | | |
      6. 7.2.6 Nordic Countries | | |
      7. 7.2.7 Russia | | |
      8. 7.2.8 Rest of Europe | |
    3. 7.3 Asia-Pacific | | |
      1. 7.3.1 China | | |
      2. 7.3.2 India | | |
      3. 7.3.3 Japan | | |
      4. 7.3.4 South Korea | | |
      5. 7.3.5 Australia and New Zealand | | |
      6. 7.3.6 ASEAN | | |
      7. 7.3.7 Rest of Asia-Pacific | |
    4. 7.4 South America | | |
      1. 7.4.1 Brazil | | |
      2. 7.4.2 Argentina | | |
      3. 7.4.3 Rest of South America | |
    5. 7.5 Middle East and Africa | | |
      1. 7.5.1 Saudi Arabia | | |
      2. 7.5.2 UAE | | |
      3. 7.5.3 South Africa | | |
      4. 7.5.4 Egypt | | |
      5. 7.5.5 Rest of MEA | |
  8. 8 Future Outlook (2026–2035) | |
    1. 8.1 Circular Feedstock Economics | |
    2. 8.2 AI-Enabled Smart Lines and Quality Inspection | |
    3. 8.3 Material Diversification Beyond PET | |
    4. 8.4 Disclosure Rules and Eco-Modulated EPR Fees | |
  9. 9 Segmentation Analysis | |
    1. 9.1 By Material | | |
      1. 9.1.1 Plastic | | |
      2. 9.1.2 Metal | | |
      3. 9.1.3 Glass | | |
      4. 9.1.4 Other Materials | |
    2. 9.2 By Product | | |
      1. 9.2.1 Still Bottled Water | | |
      2. 9.2.2 Carbonated Bottled Water | | |
      3. 9.2.3 Flavored Bottled Water | | |
      4. 9.2.4 Functional Bottled Water | |
  10. 10 Competitive Landscape | |
  11. 11 Recent News & Developments | |
  12. 12 Report Scope and Methodology | |
  13. 13 Detailed Sources and Citations | |
  14. 14 Frequently Asked Questions (FAQs) | | LIST OF TABLES | |
  15. TABLE 1 Global Market Snapshot, 2025 and 2035 | |
  16. TABLE 2 Global Market Size & Forecast, by Revenue (USD Billion), 2021–2035 | |
  17. TABLE 3 Driver Impact Analysis, 2026–2035 | |
  18. TABLE 4 Restraints Impact Analysis, 2026–2035 | |
  19. TABLE 5 Regional Summary, by Region, 2025 | |
  20. TABLE 6 North America Market, by Country, 2025 | |
  21. TABLE 7 Europe Market, by Country, 2025 | |
  22. TABLE 8 Asia-Pacific Market, by Country, 2025 | |
  23. TABLE 9 South America Market, by Country, 2025 | |
  24. TABLE 10 Middle East and Africa Market, by Country, 2025 | |
  25. TABLE 11 Global Market, by Material, 2025 | |
  26. TABLE 12 Global Market, by Product, 2025 | |
  27. TABLE 13 Competitive Benchmarking Matrix, 2025 | |
  28. TABLE 14 Report Scope and Methodology | |
  29. TABLE 15 Detailed Sources and Citations | |
  30. TABLE 16 Segmentation Quick Reference | |
  31. TABLE 17 Material Sub-Segment Key Trends | |
  32. TABLE 18 Product Sub-Segment Key Trends | | LIST OF FIGURES | |
  33. FIGURE 1 Market Dynamics Overview (Drivers, Restraints, Opportunities) | |
  34. FIGURE 2 Industry Value Chain Analysis | |
  35. FIGURE 3 Porter's Five Forces Analysis | |
  36. FIGURE 4 Global Market Size Trend, 2021–2035 (USD Billion) | |
  37. FIGURE 5 Market Share, by Material, 2025 (%) | |
  38. FIGURE 6 Market Share, by Product, 2025 (%) | |
  39. FIGURE 7 Regional Market Share, 2025 (%) | |
  40. FIGURE 8 Regional Growth Comparison, 2026–2035 (CAGR %) | |
  41. FIGURE 9 Competitive Landscape: Estimated Revenue Share Ranges, 2025 | |
  42. FIGURE 10 Market Concentration Analysis

Segmentation Quick Reference

DimensionSub-SegmentsDominant SegmentFastest Growing Segment
By MaterialPlastic, Metal, Glass, Other MaterialsPlastic (71.8% share)Metal (7.1% CAGR)
By ProductStill Bottled Water, Carbonated Bottled Water, Flavored Bottled Water, Functional Bottled WaterStill Bottled Water (62.7% share)Functional Bottled Water (7.6% CAGR)
By RegionNorth America, Europe, Asia-Pacific, South America, Middle East and AfricaNorth America (33.1% share)Asia-Pacific (6.1% CAGR)

Market Segmentation Overview

By Material

Sub-SegmentKey Trend
PlasticRising recycled-content ratios and continued gram reduction per bottle
MetalAluminum bottles and resealable cans entering hospitality and events
GlassElectric and hybrid furnaces lowering container emissions
Other MaterialsFibre-based bottles and cartons in pilot-stage premium launches

Plastic leads by a wide margin because PET offers the lowest cost per litre, and mandates in the EU, California and India are changing its resin mix rather than displacing it. Metal grows fastest as aluminum's recycling value and premium image win procurement contracts in airlines, hotels and stadiums. Glass holds its premium niche, while Other Materials remain constrained by barrier-liner costs.

By Product

Sub-SegmentKey Trend
Still Bottled WaterLightweight PET in single-serve and large-format jars
Carbonated Bottled WaterPressure-rated PET, aluminum and glass for sparkling mineral water
Flavored Bottled WaterSugar taxes driving substitution from soft drinks
Functional Bottled WaterElectrolyte and alkaline launches with premium, decorated packaging

Still Bottled Water dominates because it serves both everyday hydration and safe-water substitution in markets with unreliable tap supply. Functional Bottled Water grows fastest, as its higher price points justify aluminum, light-barrier PET and decorated formats that lift packaging value per litre. Carbonated Bottled Water and Flavored Bottled Water sit between these poles, each demanding specific pressure or barrier performance.


Download PDF ×

We do not share your information with anyone. However, we may send you emails based on your report interest from time to time. You may contact us at any time to opt-out.