Segmentation Quick Reference
| Dimension | Sub-Segments | Dominant Segment | Fastest Growing Segment |
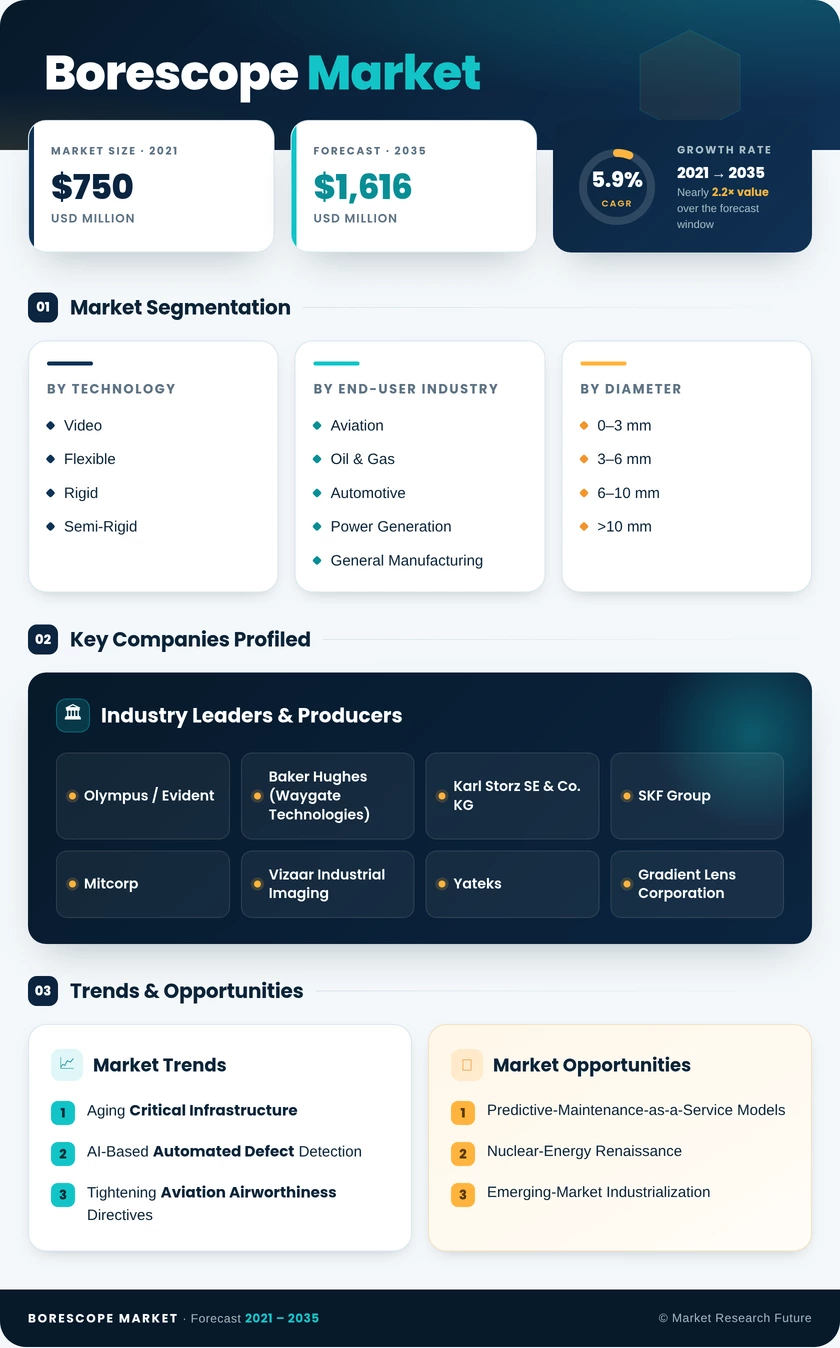
| By Technology | Video, Flexible, Rigid, Semi-Rigid | Video (44.5% share, 2025) | Video |
| By End-User Industry | Aviation, Oil & Gas, Automotive, Power Generation, General Manufacturing | Aviation (29.5% share, 2025) | Oil & Gas |
| By Diameter | 0–3 mm, 3–6 mm, 6–10 mm, >10 mm | 6–10 mm (37.0% share, 2025) | 0–3 mm |
| By Viewing Angle | 0°–90°, 90°–180°, 180°–360° | 0°–90° (42.5% share, 2025) | 180°–360° |
Market Segmentation Overview
By Technology
| Sub-Segment | Key Trend |
| Video | AI-assisted defect classification is becoming standard firmware; dominant share expanding. |
| Flexible | Retains relevance in long-reach confined-space inspections; moderate growth trajectory |
| Rigid | Cost-effective workhorse for automotive casting lines; stable but mature segment |
| Semi-Rigid | Gaining traction in mid-tier industrial settings where full articulation is unnecessary |
Video borescopes continue to pull away from competing technologies as regulatory mandates increasingly require digital, time-stamped inspection records. Flexible and rigid segments serve price-sensitive and application-specific niches, respectively, while semi-rigid models are carving out a middle ground for general-purpose industrial users.
By End-User Industry
| Sub-Segment | Key Trend |
| Aviation | Mandatory turbine-blade inspection at prescribed flight-cycle intervals |
| Oil & Gas | Pipeline integrity and refinery turnaround inspections are driving the fastest growth. |
| Automotive | In-line casting and machining quality assurance on high-volume production lines |
| Power Generation | Life-extension programs for aging gas and steam turbines |
| General Manufacturing | Adoption is spreading into precision-component verification across diverse industries. |
Aviation anchors the largest share through mandatory compliance-driven procurement, while oil and gas leads growth as midstream infrastructure expands globally. Automotive and power-generation end users represent steady, predictable demand pools tied to manufacturing output and fleet-age profiles.
By Diameter
| Sub-Segment | Key Trend |
| 0–3 mm | Micro-cavity access for aerospace and medical-device manufacturing; fastest growth |
| 3–6 mm | General-purpose industrial inspection across multiple verticals |
| 6–10 mm | Versatile mainstream platform balancing image quality and insertion flexibility |
| >10 mm | Large-bore vessel and pipeline entry; niche but stable demand |
The 6–10 mm diameter range dominates because it offers the best balance between image resolution and physical access across the widest variety of industrial applications. The ultra-small 0–3 mm segment is growing fastest as miniaturized sensor technology unlocks new inspection use cases in micro-turbines and compact aerospace assemblies.
By Viewing Angle
| Sub-Segment | Key Trend |
| 0°–90° | Standard forward-looking inspection for blade tips and bore walls |
| 90°–180° | Side-wall and lateral defect mapping in cylindrical cavities |
| 180°–360° | Full-circumferential coverage is gaining momentum for pipeline and tube inspection. |
Forward-looking 0°–90° systems hold the largest share because most inspection protocols begin with a direct axial view. The 180°–360° segment is growing fastest as pipeline operators and nuclear utilities demand single-pass circumferential coverage that eliminates the need for multiple probe insertions.