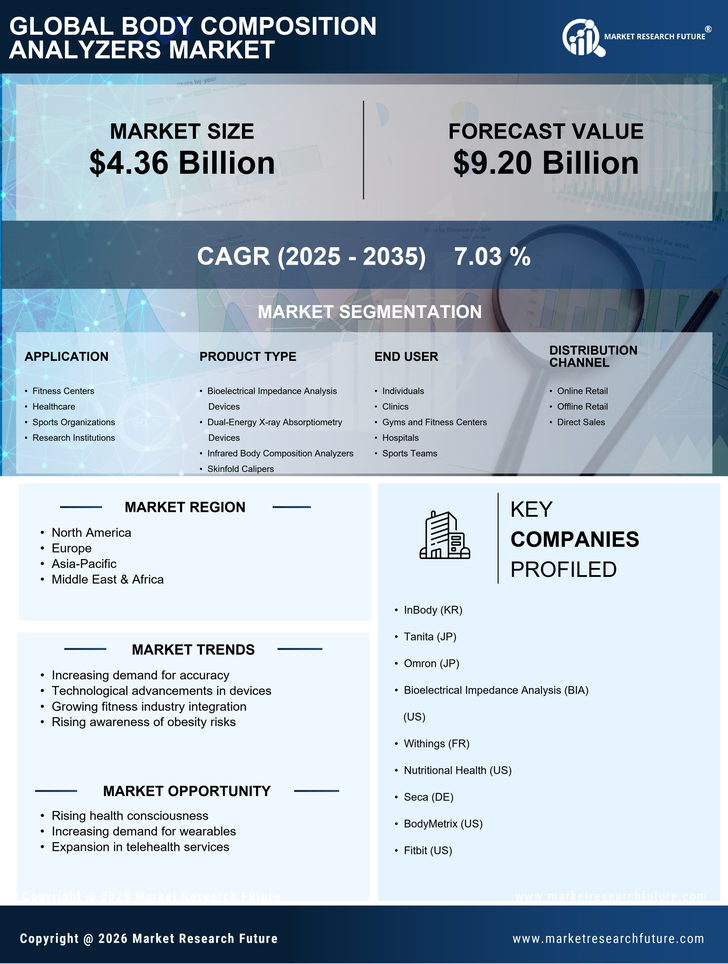
Certified Global Research Member
Isomar fd.webp Wcrc 57.webp
Key Questions Answered
  • Global Market Outlook
  • In-depth analysis of global and regional trends
  • Analyze and identify the major players in the market, their market share, key developments, etc.
  • To understand the capability of the major players based on products offered, financials, and strategies.
  • Identify disrupting products, companies, and trends.
  • To identify opportunities in the market.
  • Analyze the key challenges in the market.
  • Analyze the regional penetration of players, products, and services in the market.
  • Comparison of major players’ financial performance.
  • Evaluate strategies adopted by major players.
  • Recommendations
Why Choose Market Research Future?
  • Vigorous research methodologies for specific market.
  • Knowledge partners across the globe
  • Large network of partner consultants.
  • Ever-increasing/ Escalating data base with quarterly monitoring of various markets
  • Trusted by fortune 500 companies/startups/ universities/organizations
  • Large database of 5000+ markets reports.
  • Effective and prompt pre- and post-sales support.

Body Composition Analyzers Market Research Report Information By Product Type (Bioimpedance Analyzer, Skinfold Calipers, Dual Energy X-Ray Absorptiometry, Hydrostatic Weighing Equipment, Others), By Mobility (Portable, Stationary) and By End-User (Hospitals, Academic and Research Centers, Community Health Care Centers, Others) – Forecast to 2032


ID: MRFR/HC/7001-HCR | 105 Pages | Author: Kinjoll Dey| April 2024
Leading companies partner with us for data-driven Insights
client_1 client_2 client_3 client_4 client_5 client_6 client_7 client_8 client_9 client_10
Please fill in Business Email for Quick Response

Table of Contents

1. REPORT PROLOGUE

2. MARKET INTRODUCTION

2.1. Definition

2.2. Scope of the Study

2.2.1. Research Objective

2.2.2. Assumptions

2.2.3. Limitations

3. RESEARCH METHODOLOGY

3.1. Overview

3.2. Primary Research

3.3. Secondary Research

3.4. Market Size Estimation

4. MARKET DYNAMICS

4.1. Overview

4.2. Drivers

4.3. Restraints

4.4. Opportunities

5. MARKET FACTOR ANALYSIS

5.1. Porter’s Five Forces Analysis

5.1.1. Bargaining Power of Suppliers

5.1.2. Bargaining Power of Buyers

5.1.3. Threat of New Entrants

5.1.4. Threat of Substitutes

5.1.5. Intensity of Rivalry

5.2. Value Chain Analysis

6. GLOBAL BODY COMPOSITION ANALYZERS MARKET, BY PRODUCT TYPE

6.1. Overview

6.2. Bioimpedance Analyzer

Market Estimates & Forecast, by Region, 2020-2027

Market Estimates & Forecast, by Country, 2020-2027

6.3. Skinfold Calipers

Market Estimates & Forecast, by Region, 2020-2027

Market Estimates & Forecast, by Country, 2020-2027

6.4. Dual Energy X-Ray Absorptiometry

Market Estimates & Forecast, by Region, 2020-2027

Market Estimates & Forecast, by Country, 2020-2027

6.5. Hydrostatic Weighing Equipment

Market Estimates & Forecast, by Region, 2020-2027

Market Estimates & Forecast, by Country, 2020-2027

6.6. Air Displacement Plethysmography

Market Estimates & Forecast, by Region, 2020-2027

Market Estimates & Forecast, by Country, 2020-2027

6.7. Others

Market Estimates & Forecast, by Region, 2020-2027

Market Estimates & Forecast, by Country, 2020-2027

7. GLOBAL BODY COMPOSITION ANALYZERS MARKET, BY END USER

7.1. Overview

7.2. Hospitals

Market Estimates & Forecast, by Region, 2020-2027

Market Estimates & Forecast, by Country, 2020-2027

7.3. Academic and Research Centers

Market Estimates & Forecast, by Region, 2020-2027

Market Estimates & Forecast, by Country, 2020-2027

7.4. Fitness Centers

Market Estimates & Forecast, by Region, 2020-2027

Market Estimates & Forecast, by Country, 2020-2027

7.5. Home Users

Market Estimates & Forecast, by Region, 2020-2027

Market Estimates & Forecast, by Country, 2020-2027

7.6. Others

Market Estimates & Forecast, by Region, 2020-2027

Market Estimates & Forecast, by Country, 2020-2027

8. GLOBAL BODY COMPOSITION ANALYZERS MARKET, BY REGION

8.1. Overview

8.2. Americas

8.2.1. North America

8.2.1.1. US

8.2.1.2. Canada

8.2.2. Latin America

8.3. Europe

8.3.1. Western Europe

8.3.1.1. Germany

8.3.1.2. France

8.3.1.3. Italy

8.3.1.4. Spain

8.3.1.5. UK

8.3.1.6. Rest of Western Europe

8.3.2. Eastern Europe

8.4. Asia-Pacific

8.4.1. Japan

8.4.2. China

8.4.3. India

8.4.4. Australia

8.4.5. South Korea

8.4.6. Rest of Asia-Pacific

8.5. Middle East & Africa

8.5.1. Middle East

8.5.2. Africa

9. COMPANY LANDSCAPE

9.1.1. Overview

9.1.2. Competitive Analysis

10. COMPANY PROFILES

10.1. Bodystat

10.1.1. Company Overview

10.1.2. Product Type Overview

10.1.3. Financial Overview

10.1.4. Key Developments

10.1.5. SWOT Analysis

10.1.6. Key Strategies

10.2. COSMED S.R.L

10.2.1. Company Overview

10.2.2. Product Type Overview

10.2.3. Financial Overview

10.2.4. Key Developments

10.2.5. SWOT Analysis

10.2.6. Key Strategies

10.3. GE Healthcare, Inc.

10.3.1. Company Overview

10.3.2. Product Type Overview

10.3.3. Financial Overview

10.3.4. Key Developments

10.3.5. SWOT Analysis

10.3.6. Key Strategies

10.4. Hologic Inc.

10.4.1. Company Overview

10.4.2. Product Type Overview

10.4.3. Financial Overview

10.4.4. Key Developments

10.4.5. SWOT Analysis

10.4.6. Key Strategies

10.5. Beurer GmbH

10.5.1. Company Overview

10.5.2. Product Type Overview

10.5.3. Financial Overview

10.5.4. Key Developments

10.5.5. SWOT Analysis

10.5.6. Key Strategies

10.6. Inbody Co. Ltd.

10.6.1. Company Overview

10.6.2. Product Type Overview

10.6.3. Financial Overview

10.6.4. Key Developments

10.6.5. SWOT Analysis

10.6.6. Key Strategies

10.7. Jawon Medical Co., Ltd

10.7.1. Company Overview

10.7.2. Product Type Overview

10.7.3. Financial Overview

10.7.4. Key Developments

10.7.5. SWOT Analysis

10.7.6. Key Strategies

10.8. Maltron International Ltd.

10.8.1. Company Overview

10.8.2. Product Type Overview

10.8.3. Financial Overview

10.8.4. Key Developments

10.8.5. SWOT Analysis

10.8.6. Key Strategies

10.9. Omron Healthcare, Inc.

10.9.1. Company Overview

10.9.2. Product Type Overview

10.9.3. Financial Overview

10.9.4. Key Developments

10.9.5. SWOT Analysis

10.9.6. Key Strategies

10.10. Seca GmbH & Co. Kg.

10.10.1. Company Overview

10.10.2. Product Type Overview

10.10.3. Financial Overview

10.10.4. Key Developments

10.10.5. SWOT Analysis

10.10.6. Key Strategies

10.11. Tanita Corporation

10.11.1. Company Overview

10.11.2. Product Type Overview

10.11.3. Financial Overview

10.11.4. Key Developments

10.11.5. SWOT Analysis

10.11.6. Key Strategies

10.12. AccuFitness, LLC

10.12.1. Company Overview

10.12.2. Product Type Overview

10.12.3. Financial Overview

10.12.4. Key Developments

10.12.5. SWOT Analysis

10.12.6. Key Strategies

10.13. Others

11. APPENDIX

11.1. References

11.2. Related Reports

LIST OF TABLES

TABLE 1 GLOBAL BODY COMPOSITION ANALYZERS MARKET SYNOPSIS, 2020-2027

TABLE 2 GLOBAL BODY COMPOSITION ANALYZERS MARKET ESTIMATES & FORECAST, 2020-2027(USD MILLION)

TABLE 3 GLOBAL BODY COMPOSITION ANALYZERS MARKET, BY PRODUCT TYPE, 2020-2027(USD MILLION)

TABLE 4 GLOBAL BODY COMPOSITION ANALYZERS MARKET, BY MOBILITY, 2020-2027(USD MILLION)

TABLE 5 GLOBAL BODY COMPOSITION ANALYZERS MARKET, BY END USER, 2020-2027(USD MILLION)

TABLE 6 GLOBAL BODY COMPOSITION ANALYZERS MARKET, BY REGION, 2020-2027(USD MILLION)

TABLE 7 NORTH AMERICA: BODY COMPOSITION ANALYZERS MARKET, BY PRODUCT TYPE, 2020-2027(USD MILLION)

TABLE 8 NORTH AMERICA: BODY COMPOSITION ANALYZERS MARKET, BY MOBILITY, 2020-2027(USD MILLION)

TABLE 9 NORTH AMERICA: BODY COMPOSITION ANALYZERS MARKET, BY END USER, 2020-2027(USD MILLION)

TABLE 10 US: BODY COMPOSITION ANALYZERS MARKET, BY PRODUCT TYPE, 2020-2027(USD MILLION)

TABLE 11 US: BODY COMPOSITION ANALYZERS MARKET, BY MOBILITY, 2020-2027(USD MILLION)

TABLE 12 US: BODY COMPOSITION ANALYZERS MARKET, BY END USER, 2020-2027(USD MILLION)

TABLE 13 CANADA: BODY COMPOSITION ANALYZERS MARKET, BY PRODUCT TYPE, 2020-2027(USD MILLION)

TABLE 14 CANADA: BODY COMPOSITION ANALYZERS MARKET, BY MOBILITY, 2020-2027(USD MILLION)

TABLE 15 CANADA: BODY COMPOSITION ANALYZERS MARKET, BY END USER, 2020-2027(USD MILLION)

TABLE 16 LATIN AMERICA: BODY COMPOSITION ANALYZERS MARKET, BY PRODUCT TYPE, 2020-2027(USD MILLION)

TABLE 17 LATIN AMERICA: BODY COMPOSITION ANALYZERS MARKET, BY MOBILITY, 2020-2027(USD MILLION)

TABLE 18 LATIN AMERICA: BODY COMPOSITION ANALYZERS MARKET, BY END USER, 2020-2027(USD MILLION)

TABLE 19 EUROPE: BODY COMPOSITION ANALYZERS MARKET, BY PRODUCT TYPE, 2020-2027(USD MILLION)

TABLE 20 EUROPE: BODY COMPOSITION ANALYZERS MARKET, BY MOBILITY, 2020-2027(USD MILLION)

TABLE 21 EUROPE: BODY COMPOSITION ANALYZERS MARKET, BY END USER, 2020-2027(USD MILLION)

TABLE 22 WESTERN EUROPE: BODY COMPOSITION ANALYZERS MARKET, BY PRODUCT TYPE, 2020-2027(USD MILLION)

TABLE 23 WESTERN EUROPE: BODY COMPOSITION ANALYZERS MARKET, BY MOBILITY, 2020-2027(USD MILLION)

TABLE 24 WESTERN EUROPE: BODY COMPOSITION ANALYZERS MARKET, BY END USER, 2020-2027(USD MILLION)

TABLE 25 EASTERN EUROPE: BODY COMPOSITION ANALYZERS MARKET, BY PRODUCT TYPE, 2020-2027(USD MILLION)

TABLE 26 EASTERN EUROPE: BODY COMPOSITION ANALYZERS MARKET, BY MOBILITY, 2020-2027(USD MILLION)

TABLE 27 EASTERN EUROPE: BODY COMPOSITION ANALYZERS MARKET, BY END USER, 2020-2027(USD MILLION)

TABLE 28 ASIA-PACIFIC: BODY COMPOSITION ANALYZERS MARKET, BY PRODUCT TYPE, 2020-2027(USD MILLION)

TABLE 29 ASIA-PACIFIC: BODY COMPOSITION ANALYZERS MARKET, BY MOBILITY, 2020-2027(USD MILLION)

TABLE 30 ASIA-PACIFIC: BODY COMPOSITION ANALYZERS MARKET, BY END USER, 2020-2027(USD MILLION)

TABLE 31 MIDDLE EAST & AFRICA: BODY COMPOSITION ANALYZERS MARKET, BY PRODUCT TYPE, 2020-2027(USD MILLION)

TABLE 32 MIDDLE EAST & AFRICA: BODY COMPOSITION ANALYZERS MARKET, BY MOBILITY, 2020-2027(USD MILLION)

TABLE 33 MIDDLE EAST & AFRICA: BODY COMPOSITION ANALYZERS MARKET, BY END USER, 2020-2027(USD MILLION)

LIST OF FIGURES

FIGURE 1 RESEARCH PROCESS

FIGURE 2 MARKET STRUCTURE FOR THE GLOBAL BODY COMPOSITION ANALYZERS MARKET

FIGURE 3 MARKET DYNAMICS FOR THE GLOBAL BODY COMPOSITION ANALYZERS MARKET

FIGURE 4 GLOBAL BODY COMPOSITION ANALYZERS MARKET SHARE, BY PRODUCT TYPE, 2020 (%)

FIGURE 5 GLOBAL BODY COMPOSITION ANALYZERS MARKET SHARE, BY MOBILITY, 2020 (%)

FIGURE 6 GLOBAL BODY COMPOSITION ANALYZERS MARKET SHARE, BY END USER, 2020 (%)

FIGURE 7 GLOBAL BODY COMPOSITION ANALYZERS MARKET SHARE, BY REGION, 2020 (%)

FIGURE 8 AMERICAS: BODY COMPOSITION ANALYZERS MARKET SHARE BY REGION, 2020 (%)

FIGURE 9 NORTH AMERICA: BODY COMPOSITION ANALYZERS MARKET SHARE, BY COUNTRY, 2020 (%)

FIGURE 10 EUROPE: BODY COMPOSITION ANALYZERS MARKET SHARE, BY REGION, 2020 (%)

FIGURE 11 WESTERN EUROPE: BODY COMPOSITION ANALYZERS MARKET SHARE, BY COUNTRY, 2020 (%)

FIGURE 12 ASIA-PACIFIC: BODY COMPOSITION ANALYZERS MARKET SHARE, BY COUNTRY, 2020 (%)

FIGURE 13 MIDDLE EAST & AFRICA: BODY COMPOSITION ANALYZERS MARKET SHARE, BY COUNTRY, 2020 (%)

FIGURE 14 GLOBAL BODY COMPOSITION ANALYZERS MARKET: COMPANY SHARE ANALYSIS, 2020 (%)

FIGURE 15 BODYSTAT: KEY FINANCIALS

FIGURE 16 BODYSTAT: SEGMENTAL REVENUE

FIGURE 17 BODYSTAT: REGIONAL REVENUE

FIGURE 18 COSMED S.R.L: KEY FINANCIALS

FIGURE 19 COSMED S.R.L: SEGMENTAL REVENUE

FIGURE 20 COSMED S.R.L: REGIONAL REVENUE

FIGURE 21 GE HEALTHCARE INC.: KEY FINANCIALS

FIGURE 22 GE HEALTHCARE INC.: SEGMENTAL REVENUE

FIGURE 23 GE HEALTHCARE INC.: REGIONAL REVENUE

FIGURE 24 HOLOGIC INC.: KEY FINANCIALS

FIGURE 25 HOLOGIC INC.: SEGMENTAL REVENUE

FIGURE 26 HOLOGIC INC.: REGIONAL REVENUE

FIGURE 27 BEURER GMBH: KEY FINANCIALS

FIGURE 28 BEURER GMBH: SEGMENTAL REVENUE

FIGURE 29 BEURER GMBH: REGIONAL REVENUE

FIGURE 30 INBODY CO. LTD.: KEY FINANCIALS

FIGURE 31 INBODY CO. LTD.: SEGMENTAL REVENUE

FIGURE 32 INBODY CO. LTD.: REGIONAL REVENUE

FIGURE 33 JAWON MEDICAL CO., LTD: KEY FINANCIALS

FIGURE 34 JAWON MEDICAL CO., LTD: SEGMENTAL REVENUE

FIGURE 35 JAWON MEDICAL CO., LTD: REGIONAL REVENUE

FIGURE 36 MALTRON INTERNATIONAL LTD.: KEY FINANCIALS

FIGURE 37 MALTRON INTERNATIONAL LTD.: SEGMENTAL REVENUE

FIGURE 38 MALTRON INTERNATIONAL LTD.: REGIONAL REVENUE

FIGURE 39 OMRON HEALTHCARE INC.: KEY FINANCIALS

FIGURE 40 OMRON HEALTHCARE INC.: SEGMENTAL REVENUE

FIGURE 41 OMRON HEALTHCARE INC.: REGIONAL REVENUE

FIGURE 42 SECA GMBH & CO. KG.: KEY FINANCIALS

FIGURE 43 SECA GMBH & CO. KG.: SEGMENTAL REVENUE

FIGURE 44 SECA GMBH & CO. KG.: REGIONAL REVENUE

FIGURE 45 TANITA CORPORATION: KEY FINANCIALS

FIGURE 46 TANITA CORPORATION: SEGMENTAL REVENUE

FIGURE 47 TANITA CORPORATION: REGIONAL REVENUE

FIGURE 48 ACCUFITNESS, LLC: KEY FINANCIALS

FIGURE 49 ACCUFITNESS, LLC: SEGMENTAL REVENUE

FIGURE 50 ACCUFITNESS, LLC: REGIONAL REVENUE

Purchase Option
Single User $ 4,950
Multiuser License $ 5,950
Enterprise User $ 7,250
Compare Licenses
Tailored for You
  • Dedicated Research on any specifics segment or region.
  • Focused Research on specific players in the market.
  • Custom Report based only on your requirements.
  • Flexibility to add or subtract any chapter in the study.
  • Historic data from 2014 and forecasts outlook till 2040.
  • Flexibility of providing data/insights in formats (PDF, PPT, Excel).
  • Provide cross segmentation in applicable scenario/markets.