Blue Biotechnology Market Segmentation
Blue Biotechnology Market By Product (USD Billion, 2025-2035)
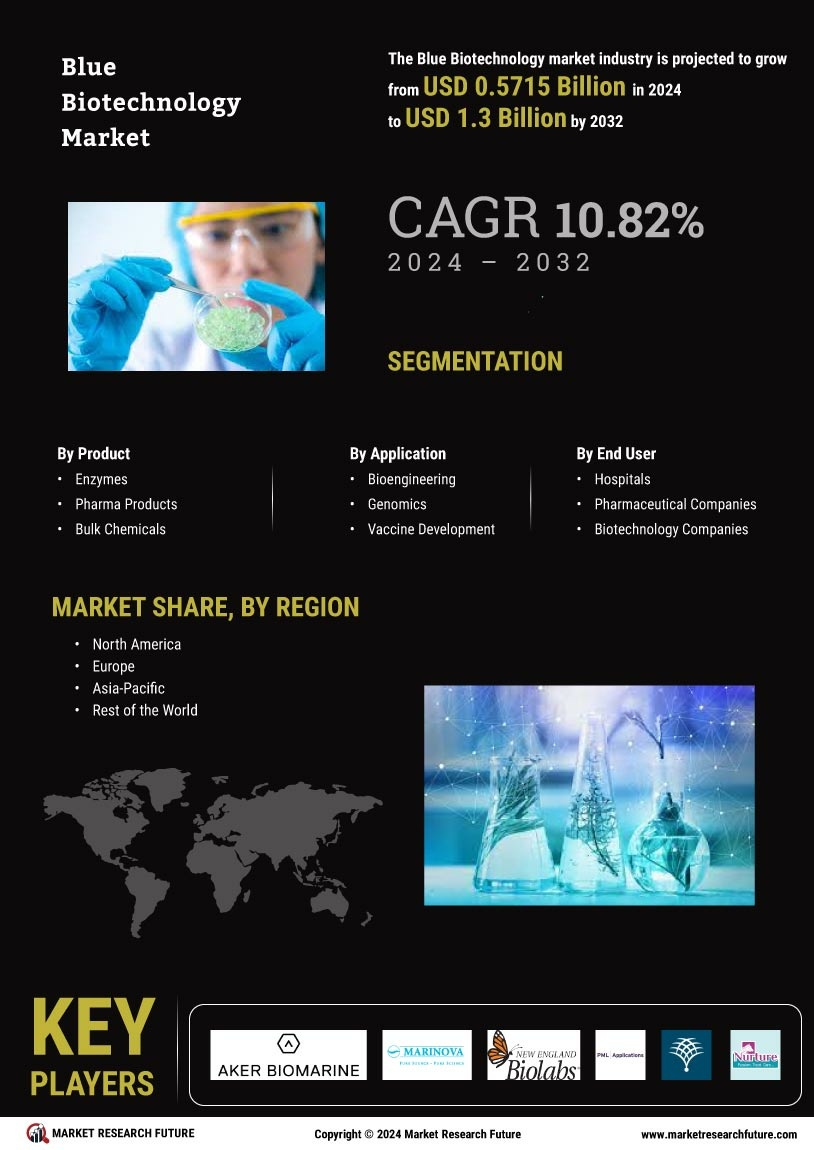
- Enzymes
- Pharma Products
- Bulk Chemicals
- Biopolymers
- Others
Blue Biotechnology Market By Application (USD Billion, 2025-2035)
- Bioengineering
- Genomics
- Vaccine Development
- Drug Discovery
- Fisheries
- Aquaculture
- Biofuels
- Water Treatment Services
- Others
Blue Biotechnology Market By End User (USD Billion, 2025-2035)
- Hospitals
- Pharmaceutical Companies
- Biotechnology Companies
- Others