Blepharitis Market Segmentation
Blepharitis Market By Type (USD Billion, 2025-2035)
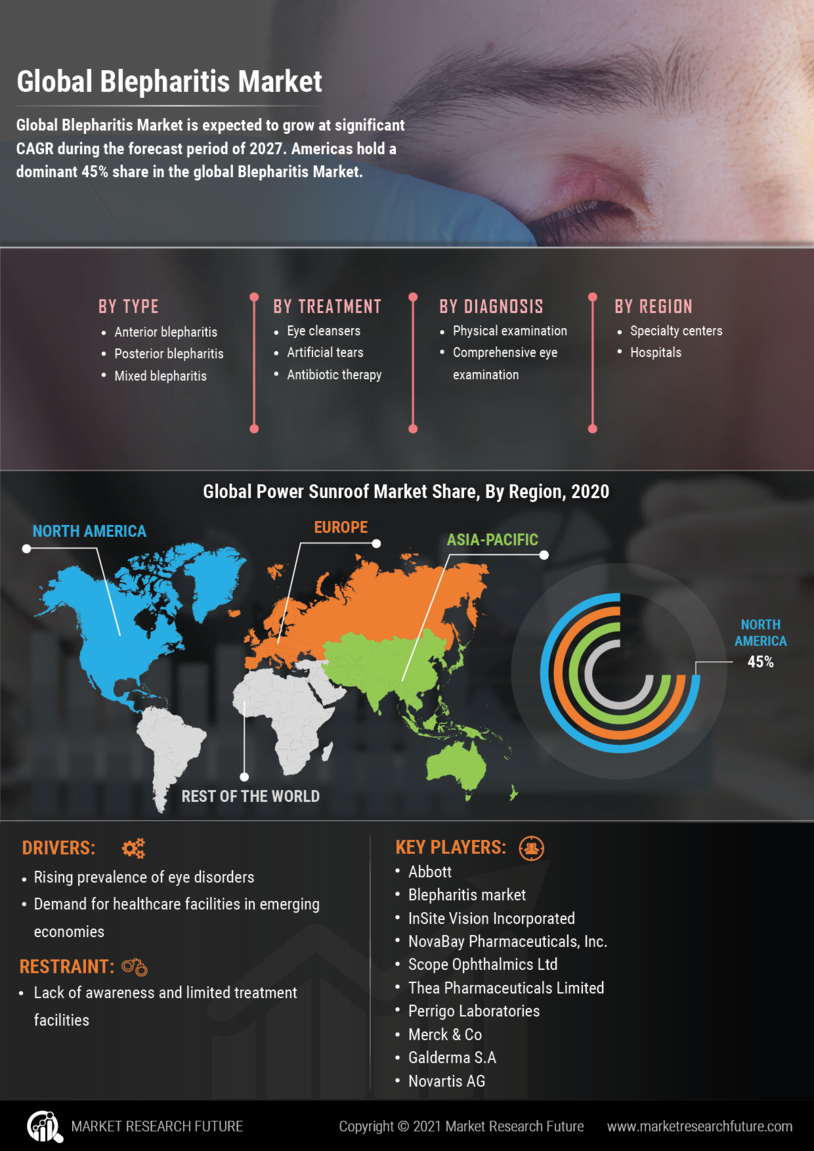
- Anterior Blepharitis
- Posterior Blepharitis
- Mixed Blepharitis
Blepharitis Market By Treatment (USD Billion, 2025-2035)
- Eye Cleansers
- Artificial Tears
- Antibiotic Therapy
Blepharitis Market By Diagnosis (USD Billion, 2025-2035)
- Physical Examination
- Comprehensive Eye Examination
- Others
Blepharitis Market By End-user (USD Billion, 2025-2035)
- Specialty Centers
- Hospitals
- Others